$AMD Update$AMD Update
So my buy order filled at 84.45… So I’m looking for 102.84 for 21.78% OR 66.06 to double my position….
There is a gap that was opened in July of 2020… that I also might add in….
Best of luck and have fun, y’all…
—-
I am not your financial advisor. Watch my setups first before you jump in… My trade set ups work very well and they are for my personal reference and if you decide to trade them you do so at your own risk. I will gladly answer questions to the best of my knowledge but ultimately the risk is on you. I will update targets as needed.
GL and happy trading.
IF you need anything analyzed Technically just comment with the Ticker and I’ll do it as soon as possible…
AMD

ADVANCE MICRO DEVICE .. IF YOU WANT TO SHORT please short only with small qty for practice with giving sl yellow line above..... let the red support break then go you can carry for tomorrow 1.2 target

AMD - Long PositionAdvanced Micro Devices has strengthened its position in the semiconductor market on the back of its evolution as an enterprise-focus company from a pure-bred consumer-PC chip provider. AMD has emerged as a strong challenger to NVIDIA’s dominance in the graphic processing unit or GPU market based on its Radeon technology.

AMD Short Call - A head and shoulder pattern AMD was forming a head and shoulder pattern which is started when it broke the resistance of $98 in Jun 2021 and till Apr 2022 it completed its pattern and it broke down made a low of $84 and again it retests its level of $98-$99 of resistance and came down. To become strong sell the rsi show close below 40 levels currently, it is at 41 levels. Sell below $90 levels Sl is $101 and the target is $74 - $60 and the final target is $36 levels. The time horizon is medium-term.
Fundamentally the company has reported good numbers and being in the semiconductor industry it has demand still intact. But the chart is saying there is a lot of pain ahead.
Overall the market sentiment is negative. So it can be under a lot of pressure.
What are your thoughts guys??

AMD looks dropyAMD looks dropping more with SPY.Stock market still going down which bring good stocks down to.

AMD possible retestFundamentals:
AMD has some bullish news about their new GPU refresh lineup, so I decided to see if the chart matches. On top of that, their quarterly earnings report was very impressive to me.
Technicals
We have strong bullish divergence forming that I believe will take us to the trendline, if not higher. That is where I will take some profits and see if we can make a higher high after that to let the rest ride. It's also looking good from a liquidation screener standpoint, which I will post as an update.
Entry: 95
Target 1: 105-110

AMD - Has Correction Completed? AMD might be a challenger or a leader in some specific areas compared to the competitors like Intel and NVIDIA.
But there is no doubt that it is one of few leaders in a semiconductor industry as a whole and it's here to stay.
The question is - is time to buy the dip having a discount at nearly 50% from the historic high?
Fundamental indicators:
Revenue and Profits - consistent growth for the past 10 years
Profit margin - the company is becoming more effective with a respectful 25% in 2021
P/E - although still overpriced with 54x ratio it has considerable reduced from circa 200 since 2019
Liabilities - no problems with debt
Technical Analysis (Elliott Waves):
According to the proposed scenario since the point when the current correction has started we have observed a circa 50% correction to wave 3
The rapid drop tells us that it is most likely to be an ABC pattern
Wave A of this zigzag was an impulse, wave B formed as a running flat and the current choppy movement resembles an Ending Diagonal where waves 1-3 have already completed
Wave 4 can be expected to be quite deep to wave 3 in the region of $116 and then to be followed by the final 5th wave drop to circa $80 to complete the whole corrective wave and start the new growth cycle
Given the deficits in the semiconductor industry which is currently the main source for the expansion of world digital economies do you think AMD is soon to start the new bull run?
What do you think about this idea?
Please share your thoughts in the comments and like this idea if you would like to see more stocks analysed using Elliott Waves.
Thanks

$AAPL $AMD $SPY $QQQ I OptionsSwing WatchlistAAPL 1W I Last week we got a new low on AAPL. It is barely holding the uptrend on the monthly chart. Bearish below $150, bullish as long as the uptrend is held.
AMD 1M I AMD is attempting to reclaim $100. The semiconductor industry is in a bear market, and unless AMD breaks from the downtrend we'll see more downside.
QQQ 1D I QQQ managed to print a new low last week and closed down below $320. Below $315 QQQ looks bearish above it looks bullish. Overall the trend remains bearish.
SPY 1D I We are seeing a double bottom on SPY near $405. Above $415 SPY looks bullish, below it looks bearish. Overall trend remains bearish.

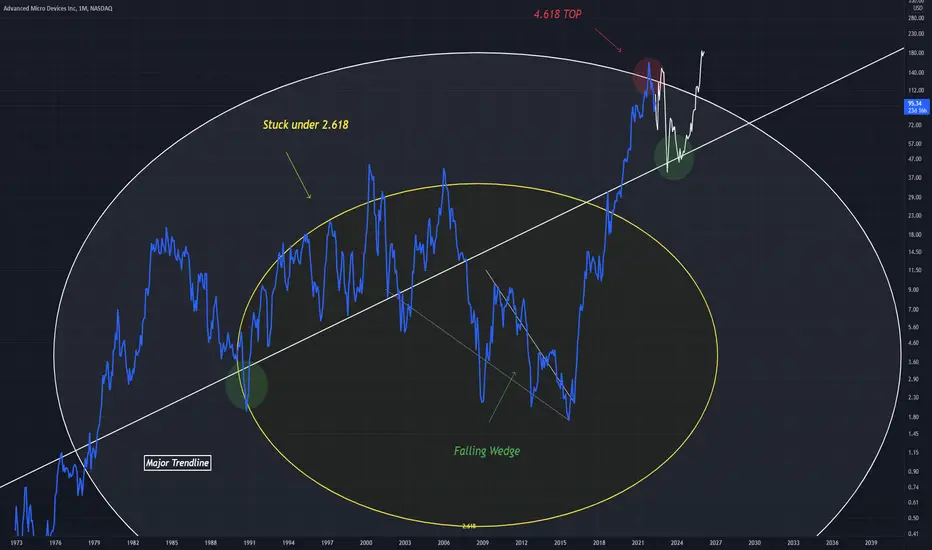
AMD AnalysisAn idea for AMD which suggests a pullback yet a support find above a major Trendline
Price action is very interesting in yellow, as it moves around the top of the circle (2.618)
White bars pattern is a guess of future price action (allowing support to be found at the Trendline.
AMD looking for a breakoutAMD is trying to get by the 100 mark, there is a lot of pressure from both buyers and sellers. It might retest $100 soon


$AMD on daily Potential Cup and Handle $AMD on daily Potential Cup and Handle (check next week for handle status)
What are your thoughts?
Thanks,
Kelly

Short $AMD CMP $104.05Short $AMD CMP $104.05. This one tried to bounce off of 200 SMA but failed. Today's big red candle is very big bearish sign that it will continue the downtrend. 20 and 50 SMA are nose diving on this one. It may hold $100 area but I am more inclined towards $90-$95 area support levels are more appropriate levels.
Short Target 1 is $100 area. Short Target 2 is $90-$95 area.

5/4/22 AMD Advanced Micro Devices ( NASDAQ:AMD )
Sector: Electronic Technology (Semiconductors)
Market Capitalization: 161.076B
Current Price: $99.42
Breakout price: $100.00
Buy Zone (Top/Bottom Range): $97.85-$84.75
Price Target: $113.80-$117.60 (1st), $138.30-$141.40 (2nd)
Estimated Duration to Target: 20-21d (1st), 38-40d (2nd)
Contract of Interest: $AMD 5/20/22 100c, $AMD 6/17/22 110c
Trade price as of publish date: $4.41/contract, $3.45/contract

AMD monster $100 levelIt is showtime for AMD.
The so strong $100 psychological level.
Not only it offered many times a good support and bounce, other times it offered a strong rejection/resistance.
Now price is back at it.
All it needs is another strong day in the indices and we might see a push above it towards 106 / 110

AMD very bullish - can test last swing high of $125 end of MayWith good earnings and market bouncing, AMD can test last swing high within weeks.
Bullish sentiment can push it to $120 before even slowing down a bit.
Levels to watch: $100 --> $107 --> $112 --> $118
