AMD Pullback Complete? Momentum Signals Say Watch Closely🚀 AMD – NASDAQ | Market Profit Playbook (Swing Trade)
🎯 Bullish Layered Entry Setup + Macro Factors
📌 Asset: Advanced Micro Devices, Inc. (Ticker: NASDAQ:AMD • NASDAQ Equity)
📈 Setup Type: Bullish Swing Play — Momentum + Pullback + Macro Support
📊 Timeframe: Swing / Multi-session
📍 Trade Plan — Bullish Thief Strategy (Layer Entries) 💰
Market Bias: Bullish continuation confirmed when price respects strong moving average pullback levels and accumulates buyers.
Strategy: Thief Style Layered Buy Limits 🧵
🔹 Buy Zones (Layered Limit Entries):
• 🛒 Layer 1: 205.00
• 🛒 Layer 2: 210.00
• 🛒 Layer 3: 215.00
• 🛒 Layer 4: 220.00
(You may extend layers above or below based on market context & risk tolerance)
💡 Layered limit orders help scale into the position during volatility and liquidity troughs for smoother basis.
🎯 Targets & Exits
📌 Primary Target: ~260.00 🚀
• Psychological resistance & overbought trap zone 👮♂️ — profit taking recommended as momentum stalls.
• Adjust partial exits as price approaches key levels.
⚠️ This is a range target — feel free to scale in/out based on price action, RSI divergence, trend strength.
🚨 Risk Management
🔻 Stop Loss: 195.00 — risk defined zone below major support.
📌 You choose your own SL — manage risk as per your trading plan.
🔍 Why This Setup Matters (Realtime Catalysts)
📊 Fundamental & Macro Drivers
🧠 AI and Data Center Demand: AMD’s data center business continues to expand with strong AI GPU & EPYC CPU adoption; record Q3 2025 revenue + partnerships with OpenAI & Oracle boost structural growth narrative.
💼 Strong Analyst Support: KeyBanc and other analysts reaffirm overweight views with robust targets, reflecting rising hyperscaler demand.
📈 Sector Momentum: Broader Nasdaq strength driven by tech & AI sentiment supports semiconductor plays like AMD.
🌍 Economic Factors to Watch
📊 Semiconductor Market Growth: Global market projected to expand significantly by 2025-26, fueled by AI, HPC & cloud infrastructure.
💡 Inflation / Cost Pressures: Ongoing inflation & supply chain costs continue to impact margins — track CPI & producer price data for risk gauges.
📉 Interest Rates: Any shifts in Fed policy or rate expectations can influence tech valuations quickly — watch upcoming FOMC dates.
🔗 Related Pairs / Correlations to Watch
🪙 Tech & Semiconductor Peers
• NASDAQ:NVDA (NVIDIA) — closely correlated AI / GPU leader
• NASDAQ:INTC (Intel) — fundamental demand indicator for chip cycle
• NASDAQ:AVGO (Broadcom) / NASDAQ:MU (Micron) — memory & connectivity cues
💡 Strength in peers often supports AMD momentum — divergence may signal rotation or sector rebalancing.
🛠 Technical Edge + Trader Sentiment
📌 Momentum Confluence:
• Pullbacks to key moving averages often trigger institutional buy pressure.
• Layered entries capture volatility while smoothing risk.
📌 Oscillators:
• Overbought RSI warns of profit zones near targets — taper positions accordingly.
📌 Market Structure:
• Watch for higher highs & higher lows formation for trend confirmation.
❗ Notes for Traders
• This is a plan template — adapt based on live price action.
• Always adjust layers, risk, and targets based on volatility & liquidity.
• Disclaimer: This is Thief style setup with fun rhythm — your execution + risk discipline matters.
✨ “If you find value in my analysis, a 👍 and 🚀 boost is much appreciated — it helps me share more setups with the community!”
📌 Disclaimer: This is thief style trading strategy just for fun.
Amdbuy

AMD I Retracement and more upside potential Welcome back! Let me know your thoughts in the comments!
** AMD Analysis - Listen to video!
We recommend that you keep this on your watch list and enter when the entry criteria of your strategy is met.
Please support this idea with a LIKE and COMMENT if you find it useful and Click "Follow" on our profile if you'd like these trade ideas delivered straight to your email in the future.
Thanks for your continued support!

Amd - This is still not over yet!🚀Amd ( NASDAQ:AMD ) can rally another +25%:
🔎Analysis summary:
This month alone, Amd has been rallying another +50%. All of this happened because of an expected rejection at a major confluence of support. Looking at the rising channel pattern though, Amd can still rally another +25% before this rally might actually be over.
📝Levels to watch:
$300
SwingTraderPhil
SwingTrading.Simplified. | Investing.Simplified. | #LONGTERMVISION

Amd - This is just the beginning!🎈Amd ( NASDAQ:AMD ) breaks out soon:
🔎Analysis summary:
Just a couple of months ago, we witnessed a very strong bullish retest on Amd. Back then the channel continuation remained extremely likely, perfectly playing out until today. But despite the recent parabolic rise, Amd can still rally another +50% according to the chart.
📝Levels to watch:
$200 and $300
SwingTraderPhil
SwingTrading.Simplified. | Investing.Simplified. | #LONGTERMVISION

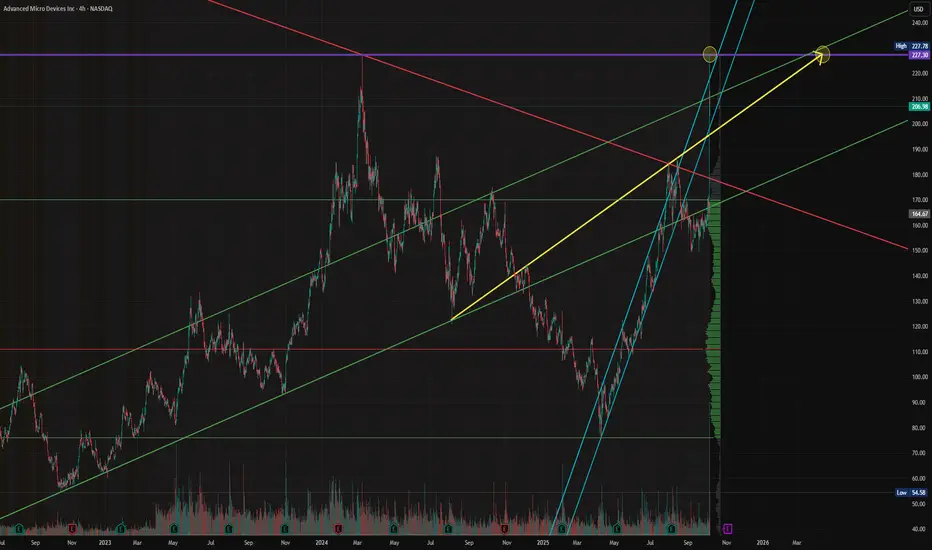
$AMD - Advanced Micro Device - $227.30 RetestNASDAQ:AMD continues its 2025 recovery rally — now clearing $200 and targeting the $227–$240 macro resistance zone.
After reclaiming the $165 structure break, AMD has re-entered its long-term ascending channel and is showing renewed strength in the AI-chip cycle.
Holding above $190 keeps this setup intact for continuation.
#AMD #AIStocks #Semiconductors #NASDAQ #BreakoutTrading #MyMIWallet
Advanced Micro Devices | AMD | Long at $126.00Advanced Micro Devices NASDAQ:AMD may be the sleeping giant in the semiconductor / AI space. While all eyes on NVidia NASDAQ:NVDA , earnings for NASDAQ:AMD grew by 800% over the past year... and are now forecast to grow 40% per year. Any other company would be soaring right now (like NVidia), but that company is getting all the attention. And, to me, this means opportunity for the future. The cashflow is likely to grow tremendously for
NASDAQ:AMD into 2027 and beyond, which may inevitably reward investors with dividends.
From a technical analysis perspective, NASDAQ:AMD just entered my historical simple moving average zone. This area (currently $108-$126) is where I will be gathering shares. Something tremendous would have to change regarding the fundamentals of this company (like a scandal) for the overall thesis to change. There may be some near-term price pains as NVidia gets all the focus, but to meet demand in the semiconductor and AI space, NASDAQ:AMD is poised to fulfill that roll in the future.
Target #1 = $158.00
Target #2 = $175.00
Target #3 = $188.00
Target #4 = $205.00

Amd - The path is too clear!🪓Amd ( NASDAQ:AMD ) will rally another +75%:
🔎Analysis summary:
For the past five years, Amd has been trading in a simple rising channel formation. With the recent retest of a major confluence of support, Amd once again confirmed the bullish trend. Following those previous cycles, Amd will now break the all time high and rally another +75% from here.
📝Levels to watch:
$200
SwingTraderPhil
SwingTrading.Simplified. | Investing.Simplified. | #LONGTERMVISION

Breakout or Fakeout? Watching AMD Resistance for Next Big Move📈 AMD “Advanced Micro Devices, Inc” – Wealth Strategy Map (Swing/Day Trade)
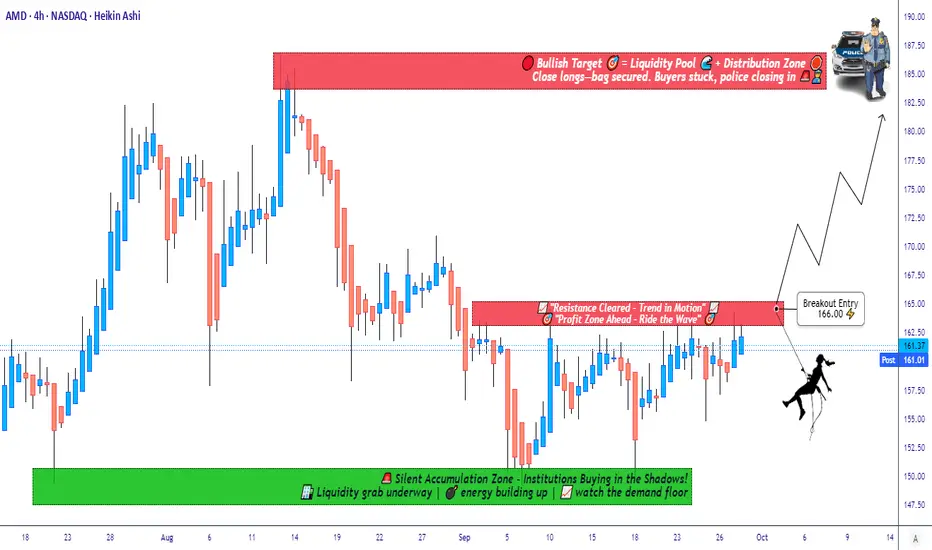
🗺️ Plan:
I’m tracking AMD with a bullish strategy — waiting for a resistance level breakout to confirm momentum. Once price breaks the key barrier, entry opportunities open up.
🎯 Entry Setup (Thief Strategy Layering Method):
Instead of one entry, I’m applying a layering strategy with multiple buy limit orders. This approach helps average entries across different levels.
Buy limit layers: 155.00, 158.00, 160.00, 162.00, 163.00. 164.00
(💡 You can increase layers based on your own risk & comfort.)
Breakout confirmation: Entry after breakout price level mentioned.
🛑 Stop Loss (Thief SL):
Suggested stop loss @150.00
⚠️ Note: Dear Ladies & Gentlemen (Thief OG’s), this is my SL level, but you are not required to follow it. Manage risk according to your own plan.
🎯 Profit Target (Police Barricade Zone 🚨):
Price faces a strong resistance around 186.00 — this area acts as a trap zone with overbought conditions.
Target @186.00 (escape with profits before police catch you 🚔).
⚠️ Note: Again, TP is personal. Take profit when satisfied — your money, your choice.
🔗 Related Assets to Watch (Correlation Insight):
AMD tends to move in line with broader tech sentiment and semiconductors:
NASDAQ:NVDA (NVIDIA) – Direct sector competitor, often mirrors momentum.
NASDAQ:SMH (VanEck Semiconductor ETF) – Strong correlation, broader chip market direction.
NASDAQ:QQQ (NASDAQ 100 ETF) – AMD is a major component; index momentum often drives AMD.
NASDAQ:INTC (Intel) – Rival stock; negative news on INTC can boost AMD sentiment.
Watching these pairs helps confirm breakouts & avoid false signals.
✨ “If you find value in my analysis, a 👍 and 🚀 boost is much appreciated — it helps me share more setups with the community!”
⚠️ Disclaimer:
This is a Thief Style Trading Strategy — shared for fun & educational purposes only.
Not financial advice. Trade at your own risk.
#AMD #SwingTrade #DayTrade #Stocks #Semiconductors #TradingStrategy #BreakoutSetup #StockMarket #NVDA #QQQ
AMD $160C – Tactical Bounce Trade You Don’t Want to Miss
# ⚡ AMD Weekly Mean-Reversion Setup (Sept 7, 2025)
### 🔍 Market Snapshot
* **Price:** \~\$151.14
* **Technicals:** Daily RSI 28.4 → Deeply oversold 📉 | Weekly RSI 54.1, falling
* **Options Flow:** Strongly bullish (C/P = 2.13) ⚡
* **Volatility:** Low (VIX \~15), gamma low → cheap premium
* **Timeframe:** 5-day weekly expiry
---
### 🎯 Trade Idea: Tactical Bounce Play
* **Instrument:** AMD
* **Direction:** CALL (Mean-reversion)
* **Strike:** \$160
* **Expiry:** 2025-09-12
* **Entry:** \$0.77 (mid/ask)
* **Profit Target:** \$1.54 (+100%)
* **Stop Loss:** \$0.31 (-40%)
* **Size:** 1 contract (small % account, scale per risk rules)
* **Confidence:** 65%
---
### ⚠️ Key Risks
* Prior week -10% drop & heavy distribution → counter-trend risk
* Full payoff requires \~\$9 move in 5 days → moderate probability
* Concentrated \$150 puts can act as support or accelerate downside
* Weekly theta decay → exit by Thursday, avoid Friday gamma ⚡
* News/macro shock risk → use small sizing
---
### 🔑 Trade Rationale
1. Daily RSI extreme → plausible 3–5 day bounce
2. High call flow @ \$160 → short gamma/short-term buying interest
3. Low VIX → cheap premium relative to potential move
---
### ⚙️ Execution Notes
* Enter at open, limit \$0.77
* Stop at \$0.31, take partial profit at +50% (\$1.16), full at +100% (\$1.54)
* Cut if price drops below \$148–\$149 on heavy volume
---
📊 **Summary:** Tactical, defined-risk mean-reversion play. Not a trend reversal — small allocation, event-driven weekly call.
\#AMD #OptionsTrading #WeeklySetups #TradingView #MeanReversion

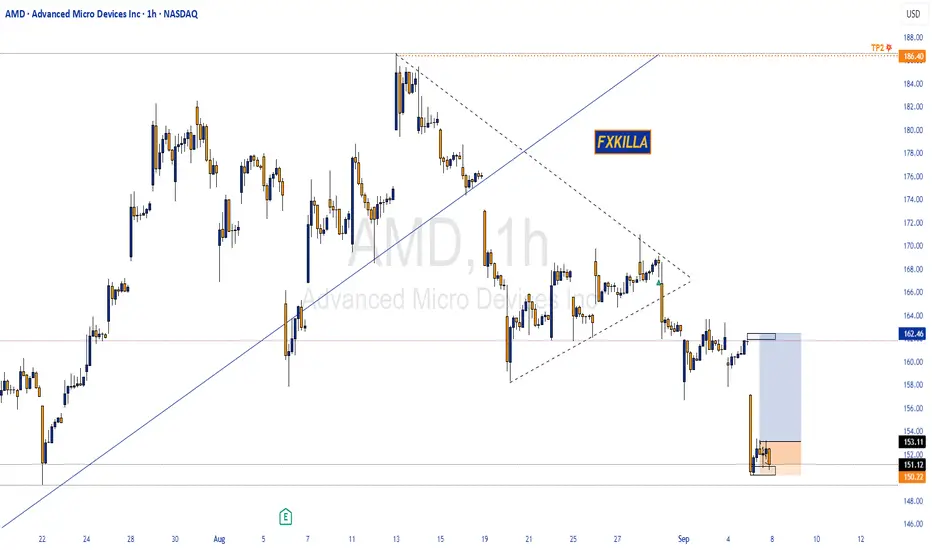
AMD HIGH PROBABILTY SETUP SOON !!!🚨 AMD HIGH PROBABILITY BUY SETUP 🚨
* Here We Can See Clearly The Next Potential Move For AMD Coming Hours/Days.
* Keep Your Eyes Close On Your Trading Positions.
* Happy PIP Hunting Traders.
FXKILLA
AMD Options Alert: $190 Call Ready to Pop!
# 🚀 AMD Weekly Options Analysis (Aug 19, 2025) 🚀
### **Market Snapshot**
📊 **Daily RSI:** 56.3 ⬇️ (Neutral)
📈 **Weekly RSI:** 85.1 ⬇️ (Potential Reversal ⚠️)
📉 **Volume:** Weak institutional activity (0.6x last week)
🔥 **Options Flow:** Call/Put ratio 1.21 → Moderate Bullish
✅ **Volatility:** Favorable (VIX < 15)
💡 **Overall Bias:** Moderate Weekly Bullish
---
### **Model Breakdown**
| Report | Trend | Volume | Options Flow | Bias |
| -------------------- | ------------------ | ------- | ------------ | ------------------- |
| **Grok/xAI** | NEUTRAL | WEAK 📉 | BULLISH 🔥 | Moderate Bullish 👍 |
| **Gemini/Google** | NEUTRAL/Bearish ⚠️ | WEAK 📉 | BULLISH 🔥 | Neutral/Bearish 🤔 |
| **Claude/Anthropic** | NEUTRAL/Bearish ⚠️ | WEAK 📉 | BULLISH 🔥 | Moderate Bearish 👎 |
| **Llama/Meta** | NEUTRAL ⚠️ | WEAK 📉 | BULLISH 🔥 | Moderate Bullish 👍 |
| **DeepSeek** | NEUTRAL ⚠️ | WEAK 📉 | BULLISH 🔥 | NEUTRAL 🤷 |
✅ **Consensus:**
* Weak volume = concern 🚨
* Low VIX = favorable for options 💎
* RSI signals mixed; overbought caution ⚠️
---
### **💥 Trade Recommendation 💥**
**Strategy:** Cautious Naked Call
* 🎯 **Instrument:** AMD
* 💰 **Strike:** \$190
* 🗓️ **Expiry:** Aug 22, 2025
* 💵 **Entry Price:** \$0.70
* 🎯 **Profit Target:** \$1.05 (50%)
* 🛑 **Stop Loss:** \$0.35
* ⏰ **Entry Timing:** Market Open
* 📈 **Confidence:** 65%
⚠️ **Key Risks:**
* ⏳ Accelerated time decay (3-day expiry)
* 📉 Weak volume may trigger profit-taking
---
### **Trade JSON**
```json
{
"instrument": "AMD",
"direction": "call",
"strike": 190.00,
"expiry": "2025-08-22",
"confidence": 0.65,
"profit_target": 1.05,
"stop_loss": 0.35,
"size": 1,
"entry_price": 0.70,
"entry_timing": "open",
"signal_publish_time": "2025-08-19 09:51:08 UTC-04:00"
}
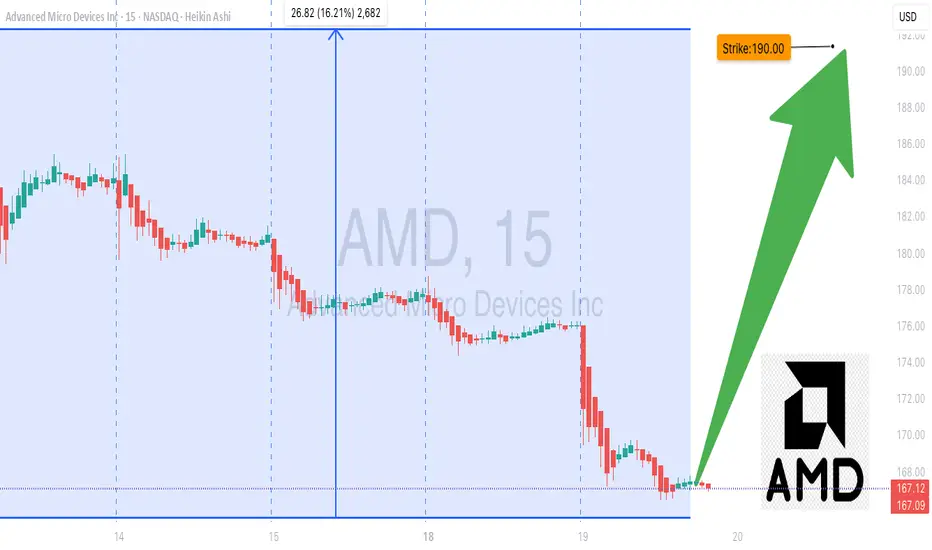
AMD Ready to Break Higher – $190 Calls Flashing Opportunity!
# 🚀 AMD Weekly Options Analysis (2025-08-17) – Don’t Miss Out!
### 🔎 Market Overview
AMD’s weekly options landscape shows **strong bullish sentiment**: high call volume and supportive sentiment suggest traders expect upward movement, though some caution arises from declining short-term indicators.
---
### 📊 Key Model Insights
* **Call/Put Ratio:** 2.03 → strong bullish flow
* **Weekly RSI:** 87.8 → extremely bullish momentum
* **Daily RSI:** 59.1 → short-term downward trend, caution advised
* **Volume:** 0.8x last week → declining institutional participation
* **Gamma Risk:** Low → favorable for entering near-term options
---
### 📌 Agreement & Disagreement
* **Agreement:** All models confirm **moderate-to-strong bullish sentiment** due to options flow and low VIX environment.
* **Disagreement:** Some models flag **weak volume**, raising caution, while others remain confident in ongoing bullish trends.
---
### 📊 Recommended Trade
* **Direction:** CALL (Long)
* **Strike:** \$190.00
* **Expiry:** 2025-08-22
* **Entry Price:** \$0.70 (midpoint)
* **Stop Loss:** \$0.35 (50% of premium)
* **Profit Target:** \$1.40 (100% gain)
* **Entry Timing:** Market Open
* **Confidence:** 65%
---
### ⚠️ Key Risks
* Weak volume → reduced institutional conviction
* Declining daily RSI → potential short-term reversals
* Monitor news/events → can affect volatility or price
---
📊 **TRADE DETAILS JSON**
```json
{
"instrument": "AMD",
"direction": "call",
"strike": 190.00,
"expiry": "2025-08-22",
"confidence": 0.65,
"profit_target": 1.40,
"stop_loss": 0.35,
"size": 1,
"entry_price": 0.70,
"entry_timing": "open",
"signal_publish_time": "2025-08-17 09:30:00 EDT"
}
``

AMD One-Day Call Opportunity – Quick Gains Ahead!🚀 AMD \$185 Call – One-Day Bullish Sprint
**Sentiment:** 🟢 *Strong Short-Term Bullish*
* **Daily RSI:** 64.2 📈
* **Weekly RSI:** 88.4 📈
* **Call/Put Volume:** Favoring calls strongly
* **Volume:** Weak (0.8× last week) → watch for support
* **Gamma Risk:** HIGH ⚡ — 1-day expiry
---
### 📊 **Consensus Snapshot**
✅ Majority of models: bullish momentum
⚠️ Weak volume + high gamma → strict risk management required
💡 Entry timing and discipline are critical
---
### 🎯 **Trade Setup**
* **Type:** CALL (Single-leg)
* **Strike:** \$185.00
* **Expiry:** 2025-08-15
* **Entry:** \$2.61 (mid-market)
* **Profit Target:** \$3.90 (+50%)
* **Stop Loss:** \$1.30 (–50%)
* **Confidence:** 70%
* **Trade Size:** 1 contract
* **Entry Timing:** Market open
---
💬 *High-momentum, short-term expiry play — monitor volume and be ready to exit quickly.*
📌 *Not financial advice. DYOR.*
---
**#AMD #OptionsTrading #CallOptions #DayTrading #StocksToWatch #GammaRisk #OptionsFlow #TradingSignals**

Amd - New all time highs will follow!🪠Amd ( NASDAQ:AMD ) rallies even much further:
🔎Analysis summary:
After Amd perfectly retested a major confluence of support a couple of months ago, we saw a textbook reversal. This retest was followed by a rally of more than +100% in a short period of time. But considering all the bullish momentum, Amd is far from creating a top formation.
📝Levels to watch:
$200
SwingTraderPhil
SwingTrading.Simplified. | Investing.Simplified. | #LONGTERMVISION

AMD Calls Flying Off the Shelves — Don’t Miss Out!🚀 AMD Weekly Options Alert (Aug 12, 2025)**
**Bias:** 🔥 **BULLISH** — Strong flow, high RSI, institutional backing
📊 **Quick Stats:**
* **Call/Put Ratio:** 2.31 → heavy call buying 📈
* **Daily RSI:** 60.4 ✅ bullish momentum
* **Weekly RSI:** 87.1 🚀 extreme strength
* **Volume:** 1.1× last week — institutional participation confirmed
* **VIX:** 15.0 → low volatility, stable premiums
* **DTE:** 3 | **Gamma Risk:** Moderate | **Time Decay:** Accelerating
💡 **Trade Setup:**
* **Type:** Naked CALL
* **Strike:** \$182.50
* **Expiry:** Aug 15, 2025
* **Entry:** \$0.69
* **PT:** \$1.38 (+100%)
* **SL:** \$0.34
* **Confidence:** 80%
⚠ **Risks:**
* 3 DTE = fast-moving gamma swings
* Semiconductor sector news could shift momentum
* RSI high — watch for intraday pullbacks
---
**📈 TL;DR:**
High RSI + bullish flow + strong volume = momentum play. Manage gamma risk, aim for quick profit.
\#AMD #OptionsTrading #CallOptions #WeeklyOptions #BullishBreakout #OptionsFlow #TradingSetup #TechnicalAnalysis #MomentumTrading #StockMarket #OptionsAlert

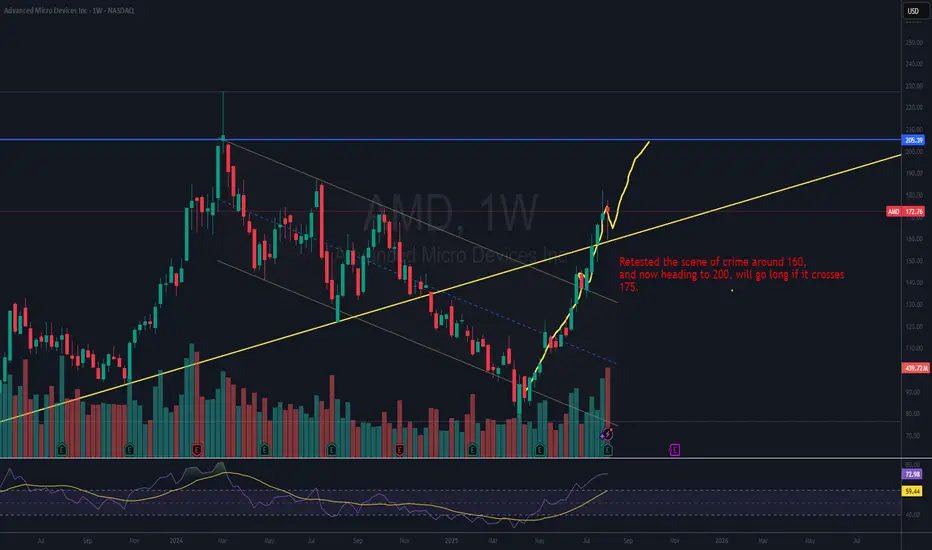
AMD Long for Aug 2025 Week2?Retested the scene of crime around 160,
and now heading to 200, will go long if it crosses
175.
AMD WEEKLY TRADE SIGNAL (7/31/25)
### 🚀 AMD WEEKLY TRADE SIGNAL (7/31/25)
📈 **MARKET SNAPSHOT**
🟢 Daily RSI: **86.0** 🔥
🟢 Weekly RSI: **80.4**
📊 Volume: 🔺 1.5x (Institutional surge)
💬 Call/Put Ratio: **1.90**
🌪 Gamma Risk: **HIGH (1DTE)**
🧠 Sentiment: **Extremely Bullish** across all models
---
💥 **TRADE IDEA**
📍 Ticker: **\ NASDAQ:AMD **
📈 Direction: **CALL (LONG)**
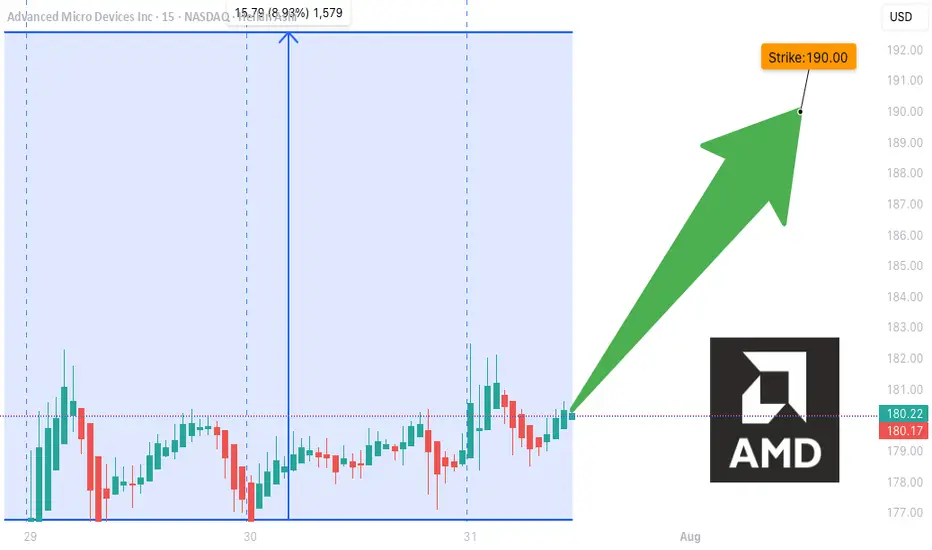
🎯 Strike: **\$190.00**
💵 Entry: **\$0.51**
🎯 Target: **\$0.90** (+75%)
🛑 Stop Loss: **\$0.30**
📆 Expiry: **Aug 1 (Friday)**
📊 Confidence: **85%**
⏰ Entry: Market Open (Time-sensitive!)
---
🧠 **STRATEGY CONTEXT**
✅ Bullish momentum from AI sector hype
✅ Institutional call buying volume spiking
⚠️ 1DTE = High Gamma Risk = TRADE FAST OR DON’T TRADE
⚠️ Manage decay & exit early if momentum stalls
---
📌 Signal Posted: 2025-07-31 @ 12:17 PM ET
\#AMD #OptionsAlert #AITrade #WeeklyOptions #TradingViewViral #1DTE #GammaSqueeze
AMD Weekly Trade Alert (2025-07-29)
**🔥 AMD Weekly Trade Alert (2025-07-29) 🔥**
💹 *Momentum Confirmed. Calls Loaded. Let’s Ride.*
📈 **Key Bullish Signals**
✔️ Daily RSI: **83.2** (Rising)
✔️ Weekly RSI: **79.9** (Rising)
✔️ Call/Put Ratio: **2.03** 🧨
✔️ Volatility: Low (VIX = 15.2)
⚠️ Volume Weak (0.9x) – But not a dealbreaker.
---
**🎯 TRADE SETUP**
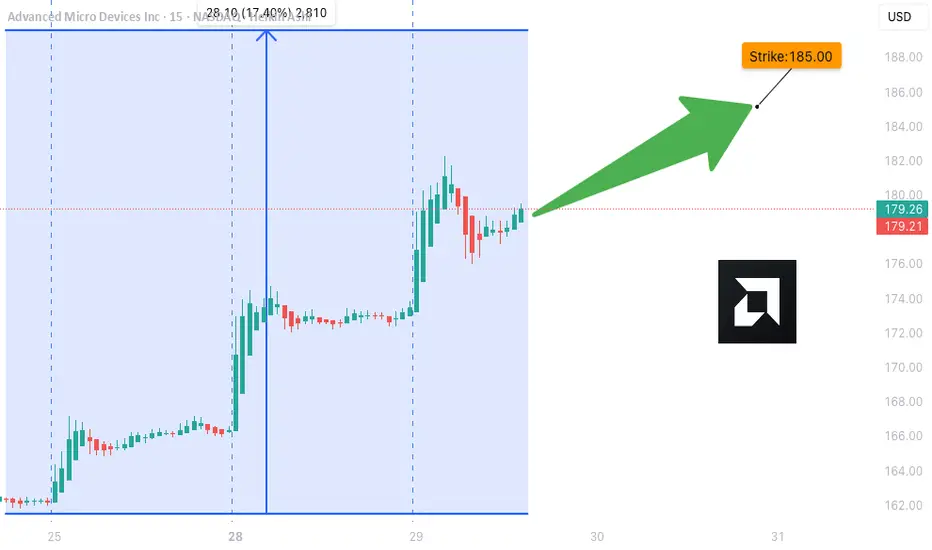
🔹 **Ticker**: \ NASDAQ:AMD
🔹 **Strategy**: Weekly Naked Call
🔹 **Strike**: \$185C
🔹 **Entry**: \$0.66
🔹 **Profit Target**: \$1.32 (100%)
🔹 **Stop Loss**: \$0.33
🔹 **Expiry**: 2025-08-01
🔹 **Size**: 3 Contracts
🔹 **Confidence**: 75%
---
**🧠 WHY THIS WORKS**
🔋 Momentum → STRONG
💰 Institutions are loading up calls
🧘 VIX = calm
⚡ Short gamma risk = fast payoff or cut
---
📢 **Watchlist it. Trade it. Exit fast.**
💬 Comment “🔥AMD” if you’re in.
🔁 Repost if you see \$190 coming.
\#AMD #OptionsTrading #CallOptions #TradingView #WeeklySetup #MomentumPlay #BullishSignal #MarketMomentum
AMD TRADE ALERT (07/24)
🚨 AMD TRADE ALERT (07/24) 🚨
Options flow is screaming bullish 📈
🧠 Key Insights:
• Call/Put Ratio: 1.80 (🔥 heavy call bias)
• RSI: Daily 75.5 / Weekly 77.2 = strong momentum
• Volume = weak ⚠️ but sentiment remains bullish
• High gamma risk = explosive potential near expiry
💥 TRADE IDEA
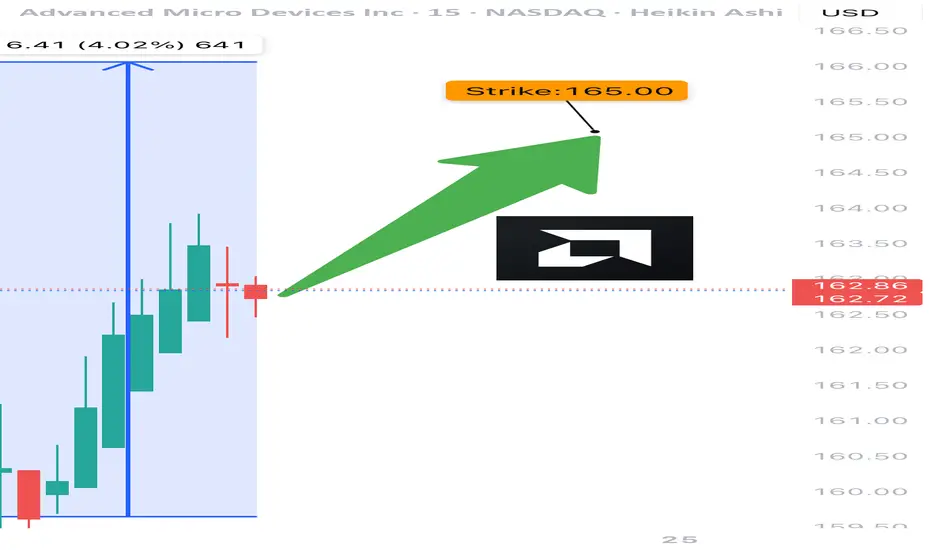
🟢 Buy AMD $165 Call exp 7/25
💰 Entry: $0.80
🎯 Target: $1.60
🛑 Stop: $0.48
📊 Confidence: 75%
⚠️ Quick expiry = fast moves. Monitor closely.
#AMD #OptionsFlow #UnusualOptionsActivity #TradingView #OptionsTrading #BullishSetup #TechStocks #DayTrading #GammaSqueeze #OptionAlerts
The AMD Long Heist – Ready to Rob the Bulls?!🚨 AMD Stock Vault Heist: Bullish Breakout Plan with Thief Trading Style! 📈💰
🌟 Greetings, Wealth Raiders & Market Mavericks! 🌟
Hello, Ciao, Salaam, Bonjour, and Hola to all you savvy traders! Ready to crack the AMD Stock Vault (Advanced Micro Devices Inc.) with our 🔥 Thief Trading Style 🔥? This high-energy strategy blends technical precision with fundamental firepower to execute the ultimate market heist. Let’s dive into the plan, lock in profits, and escape the high-risk resistance zone like pros! 🏆💸
📝 The Heist Plan: AMD Bullish Breakout Strategy
Our chart lays out a long-entry blueprint designed to capitalize on AMD’s bullish momentum. The goal? Swipe the profits and exit before the bears take control at the resistance zone. This is a high-reward, high-risk setup, so stay sharp! ⚠️
📈 Entry: Crack the Vault!
Timing: Strike when the vault is open! Place buy limit orders on pullbacks within a 15 or 30-minute timeframe targeting the most recent swing low or high.
Tactic: Use a Dollar Cost Averaging (DCA) or layering strategy to stack multiple entries for optimal positioning.
Pro Tip: Look for bullish confirmation (e.g., candlestick patterns or volume spikes) to ensure you’re entering with momentum. 🚀
🛑 Stop Loss: Secure the Getaway!
Place your stop loss below the nearest swing low on the 3-hour timeframe (around $148.00 for day/swing trades).
Adjust based on your risk tolerance, lot size, and number of layered entries.
Why? This protects your capital from sudden reversals while giving the trade room to breathe. 🛡️
🎯 Target: Cash Out Big!
Aim for $179.00, a key resistance zone where bears may counterattack.
Watch for signs of overbought conditions or consolidation near this level—be ready to take profits and treat yourself! 💪🎉
💡 Why AMD? The Fundamental Fuel ⛽
AMD’s bullish surge is powered by:
Tech Sector Momentum: Strong demand for semiconductors and AI-driven chips.
COT Report Insights: Institutional buying pressure (check latest Friday COT data, UTC+1). 📅
Macro Tailwinds: Favorable economic conditions and positive sentiment in tech indices.
Geopolitical Stability: No major disruptions impacting tech supply chains.
Intermarket Edge: Monitor NASDAQ 100 and semiconductor ETFs for correlated moves. 📊
For a deeper dive, review:
Macroeconomic trends
Sentiment analysis
Index-specific correlations
Future price projections (overall outlook score: Bullish). 🌎
⚠️ Trading Alert: Navigate News & Volatility 📰
News releases can shake up the market like a rogue alarm system! To stay safe:
Avoid new trades during major news events (e.g., earnings or Fed announcements).
Use trailing stop-loss orders to lock in profits and protect open positions.
Stay agile—monitor real-time updates to adjust your strategy. 🚨
📌 Risk Disclaimer
This analysis is for educational purposes only and not personalized investment advice. Always conduct your own research, assess your risk tolerance, and align your trades with your financial goals. Markets move fast—stay informed and adaptable! 📚
💥 Boost the Heist! 💥
Love this Thief Trading Style? Smash the Boost Button to supercharge our robbery squad! 💪 Every like and share fuels our mission to conquer the markets with ease. Join the team, steal the profits, and let’s make money rain! 🌧️💰
Stay tuned for the next heist plan, you legendary traders! 🤑🐱👤🚀

Breakout Alert: AMD Head & Shoulders Points to $160+Overview
Name: Advanced Micro Devices, Inc.
Ticker Symbol: AMD
Exchange: NASDAQ
Founded: 1969
Headquarters: Santa Clara, California, USA
CEO: Lisa Su (as of 2025)Sector: Technology / Semiconductors
About
AMD is a leading semiconductor company known for its high-performance computing and graphics solutions. It competes with Intel and NVIDIA in the CPU, GPU, and data center markets. Its product line includes Ryzen (desktop/laptop CPUs), EPYC (server CPUs), and Radeon (GPUs), with strong expansion in AI and custom silicon for next-gen applications.
Fundamentals
Earnings: AMD reported strong Q1 2025 earnings with a beat on both revenue and EPS, supported by explosive demand in the AI and data center segments.Revenue: $6.52B, up 21% YoY
Outlook: The company raised guidance for the second half of 2025 as it expects to benefit from the AI chip boom and new product rollouts.
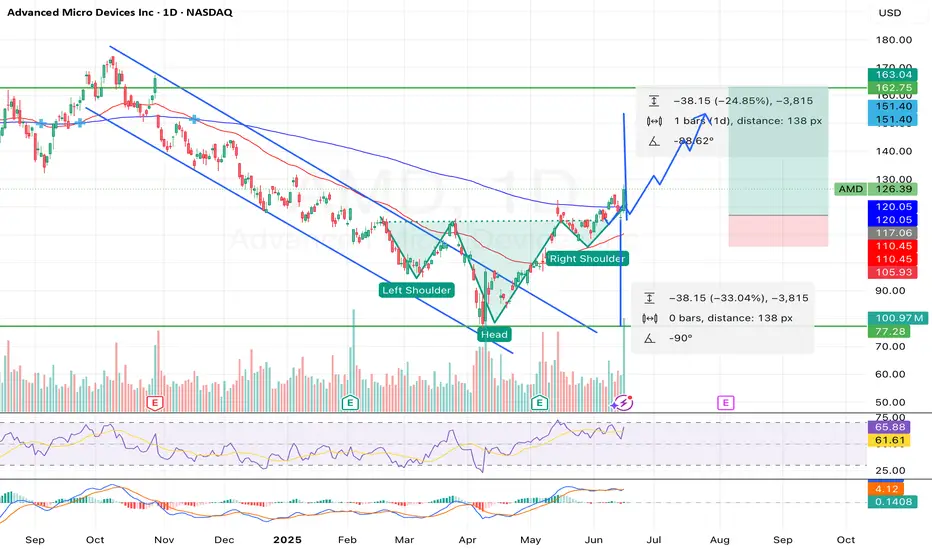
Technicals (4H Chart)
Inverted Head and Shoulders pattern confirmed with neckline breakout around ~$117
Breakout from Falling Channel aligning with bullish reversal structure
Price surged past resistance with strong volume, currently at $126.39 (+9.71%)
RSI at 65.88, approaching overbought but not signaling weakness
MACD bullish crossover, confirming momentum
Short-term target range: $145–$150, with extended projection up to $162.75
📌 Support Levels: $117, $111.50📈 Target Price (TP): $162.75 (based on pattern breakout height projection)
💡 My Take
AMD just pulled off a textbook bullish reversal — inverted head and shoulders breakout combined with a falling channel exit. With strong macro trends in AI hardware and data center expansion, this move feels well-supported fundamentally and technically.
The clean neckline breakout and explosive candle suggest continuation. I am expecting a potential consolidation around $130–$135ish before next leg to $150+. If momentum holds, $162+ is possible before August.
💼 Position
Type: AMD 145 Call
Expiry: July 03, 2025
Quantity: 15
Average Cost Basis: $.038
Date Purchased: June 12, 2025
Last Price: $0.47
Total % Gain/Loss: +23.4%
I entered after the neckline break and riding the wave. AMD’s setup is too clean to ignore — high conviction play.
AMD – The AI Underdog Setting Up for a Major MoveAMD is quietly building momentum as a major AI contender, rivaling NASDAQ:NVDA with its upcoming MI400 GPU series and strong Q2 guidance potential.
I'm watching this carefully for a medium-term swing with high reward potential based on both fundamental catalysts and technical structure.
🔍 Entry Points I'm Watching:
✅ $143 → Aggressive breakout entry if it clears $147.50 with strong volume
✅ $125 → Previous support + gap-fill zone from May
✅ $115 → Deep value zone near 200-day MA (if macro weakens)
🎯 Profit Targets:
• TP1: $160 – Key resistance & post-earnings reaction zone
• TP2: $176 – Melius Research target
• TP3: $200+ – ATH breakout potential if AI narrative extends into Q3
⚡ Catalysts to Watch:
• MI400 GPU launch in progress
• Q2 earnings (late July) – data center revenue in focus
• Sector momentum from NASDAQ:MU and NASDAQ:NVDA
⚠️ Disclaimer: This is not financial advice. I am sharing my personal trading plan and analysis for educational and discussion purposes only. Always do your own research and consult with a financial advisor before making investment decisions

Big move for AMD monday inverted H&S greatly confirmed 150USD!!!The pattern have been greatly confirmed for me and i will sell my amd this week at 150 USD and i will wait at july when a drop will occurs to rebuy and i will cumulate more stock or more profits in cash.
The information and publications are not meant to be, and do not constitute, financial, investment, trading, or other types of advice or recommendations.
Thank you!
Subcribe TSXGanG! (For real chart)
