AMD I Retracement and more upside potential Welcome back! Let me know your thoughts in the comments!
** AMD Analysis - Listen to video!
We recommend that you keep this on your watch list and enter when the entry criteria of your strategy is met.
Please support this idea with a LIKE and COMMENT if you find it useful and Click "Follow" on our profile if you'd like these trade ideas delivered straight to your email in the future.
Thanks for your continued support!
Amdlong

Breaking; Advanced Micro Devices, Inc. (AMD) Is Up 7%The price of Advanced Micro Devices, Inc. (AMD) spike 7% in early market trading on Thursday as the stock broke from a bullish flag pattern.
In another news that served as a catalyst, AMD, Cisco and HUMAIN to invest in a joint venture and serve as its exclusive technology partners, deepening their multi-year strategic collaboration announced in May during U.S. President Donald J. Trump's visit to the Kingdom of Saudi Arabia.
The joint venture plans to deploy up to 1 GW of AI infrastructure by 2030, with the shared ambition to expand capacity to multiple gigawatts, as a key pillar of HUMAIN's overall ambitions.
With the RSI at 44, the stock is more than able to break through highs and claim the $300 resistance.
Financial Performance
In 2024, Advanced Micro Devices's revenue was $25.79 billion, an increase of 13.69% compared to the previous year's $22.68 billion. Earnings were $1.64 billion, an increase of 92.15%.
About AMD
Advanced Micro Devices, Inc. operates as a semiconductor company worldwide. It operates in three segments: Data Center, Client and Gaming, and Embedded. The company offers artificial intelligence (AI) accelerators, x86 microprocessors, and graphics processing units (GPUs) as standalone devices or as incorporated into accelerated processing units, chipsets, and data center and professional GPUs; and embedded processors and semi-custom system-on-chip (SoC) products.

AMD Bull Flag: Breakout Above 262 Toward 286AMD on the 1D chart remains firmly bullish after its October surge, now pausing in a tight flag beneath the recent swing high at 262. Price is riding above the 20/60/120 MAs with all slopes positive, and Bollinger Bands have contracted after expanding during the rally—classic consolidation behavior. The prior ceiling at 240 has flipped to support, framing a clean structure for continuation.
Primary path: a break-and-close above 262 confirms the bull flag and opens room toward 286, where measured move projections align with the first objective. Traders wanting earlier exposure can stalk dips into the MA20 buy zone at 245–255, but confirmation still matters—strength should be reflected by a daily close reclaiming 250s and then 262. If momentum extends post-breakout, consider trimming into 285–290.
Alternative: if buyers fail to punch through 262, expect further range development between 240–262 while energy builds. The bullish thesis is invalidated on a daily close below 240, which would point to a deeper retrace toward prior October levels; risk should be sized with that line in mind.
Trigger: daily close > 262 (breakout). Targets: 286 first, then manage into 285–290. Invalidation: daily close < 240. This is a study, not financial advice. Manage risk and invalidations.

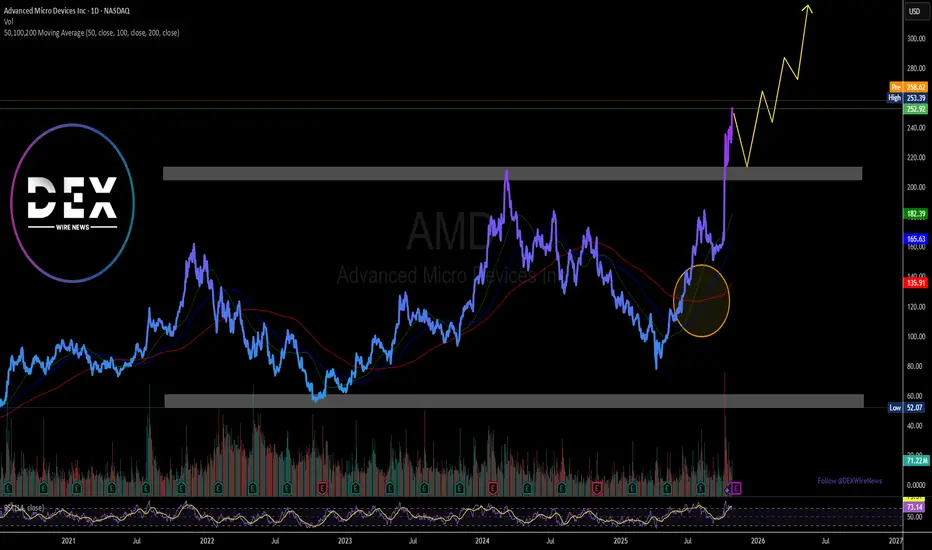
AMD's Tsunami Hitting $10,000+ | 8-Decade Blueprint🔥 FOR OUR DEDICATED FOLLOWER: The AMD Upside Target Blueprint is HERE! 🔥
You asked for clarity on AMD's path forward. This is for you, and for every trader who wants to see the real roadmap.
We've broken down the 3-week super-chart that tells the whole story. This isn't just about the next 10%; it's about the next 1,000%.
🎯 The Upside Target Hierarchy: From Tactical to Generational
1. The Wave 3 Target (~$1,000 by 2029)
· This is the MAIN EVENT for the next 5 years.
· We are currently inside this massive third wave.
· It is being powered by AMD's undeniable dominance in the AI and high-performance computing revolution.
· This wave represents the 161.8% Fibonacci Extension of the foundational Wave 1. The math is clear.
2. The Ultimate Wave 5 Target (~$10,000+ Beyond 2050)
· This is the generational wealth target.
· It represents the 261.8% Fibonacci Extension and is the final, parabolic peak of this entire 70+ year cycle.
· This is driven by technologies that are still in their infancy: Quantum Computing, AI Singularity, and interplanetary tech stacks .
🧭 The Trader's Compass: Navigating the Now
· Current Mission: Ride Wave 3 to $1,000 .
· Key Support (The Buy Zone): Any pullback toward the $240 - $230 Fibonacci confluence is a gift within the larger uptrend.
· The Catalyst: The AI boom is not a story; it's a fundamental shift . AMD is a primary architect of this new world.
🚨 NOW, WE TURN TO THE COMMUNITY 🚨
Our follower has their blueprint. Now, we turn to you, the TradingView family , to sharpen it.
We're starting a Chart Battle to help our follower see EVERY angle.
👇 THE CHALLENGE IS LIVE: 👇
Drop YOUR AMD chart below and show us:
· Your Wave Count: Do you agree with our ~$1,000 Wave 3?
· Your Targets: What's your ultimate price and timeline?
· Your Best Chart: Post your cleanest, most convincing technical analysis.
The most insightful bull OR bear case gets pinned at the top. Let's build the most comprehensive AMD analysis on TradingView, together.
Let's get it!
#AMD #ElliottWave #SuperCycle #GenerationalTrade #1000AMD #10000AMD #TechInvesting #Stocks #TradingView #Fibonacci #Wave3 #MarketCycle #LegacyWealth

Amd - This is still not over yet!🚀Amd ( NASDAQ:AMD ) can rally another +25%:
🔎Analysis summary:
This month alone, Amd has been rallying another +50%. All of this happened because of an expected rejection at a major confluence of support. Looking at the rising channel pattern though, Amd can still rally another +25% before this rally might actually be over.
📝Levels to watch:
$300
SwingTraderPhil
SwingTrading.Simplified. | Investing.Simplified. | #LONGTERMVISION

AMD Bullish Breakout: Flag Resolution Toward 278–290AMD on the 1D chart is pausing after a powerful October run from ~170 to above 260, with a clear Bullish Flag forming. The prior swing high near 264.58 is the immediate ceiling. Price holds above all key MAs, with the MA20 around 222.61 acting as nearest dynamic support, while the MA60 aligns with structural support near 183.87. Bollinger Bands remain expanded, and momentum is constructive but cooling—typical of a digestion phase before the next leg.
Primary path: a break-and-daily-close above ~265 with rising volume would confirm the flag and open a push toward the upper band/prior extremes around 278 first, then 290, with a stretch objective near 300 if momentum expands. If buyers don’t get the close, a controlled pullback into 222–225 (MA20 area) could offer a higher-low retest before another attempt higher.
Invalidate the short-term bullish thesis on a daily close below 220. That would shift risk toward the 185 area (183.87) where the MA60 and prior breakout structure converge. Until confirmation, position sizing should remain moderate; if the breakout triggers, trail risk under reclaimed levels to protect gains.
This is a study, not financial advice. Manage risk and invalidations

BUY AMD!!!!Approaching a significant level where we can expect AMD to complete this bearish cycle and begin a bullish cycle. Partial Profits at All-Time-Highs.

Advanced Micro Devices, Inc. (AMD) Gearing For A BreakoutThe share price of Advanced Micro Devices, Inc. (NASDAQ: NASDAQ:AMD ) is setting sail for a 50% breakout albeit market condition is overbought.
Sitting with an RSI of 73, Advance Micro Devices (AMD) shows continuous bullish momentum with the daily price chart indicating a golden cross pattern- this is an interception between the 50day-MA and the 200-day MA indicating bullish momentum building.
In another news, - Advance Micro Devices (NASDAQ: AMD) today announced the completion of the agreement to divest the ZT Systems U.S.-headquartered data center infrastructure manufacturing business to Sanmina (NASDAQ: SANM).
About AMD
Advanced Micro Devices, Inc. operates as a semiconductor company worldwide. It operates in three segments: Data Center, Client and Gaming, and Embedded. The company offers artificial intelligence (AI) accelerators, x86 microprocessors, and graphics processing units (GPUs) as standalone devices or as incorporated into accelerated processing units, chipsets, and data center and professional GPUs; and embedded processors and semi-custom system-on-chip (SoC) products, microprocessor and SoC development services and technology.
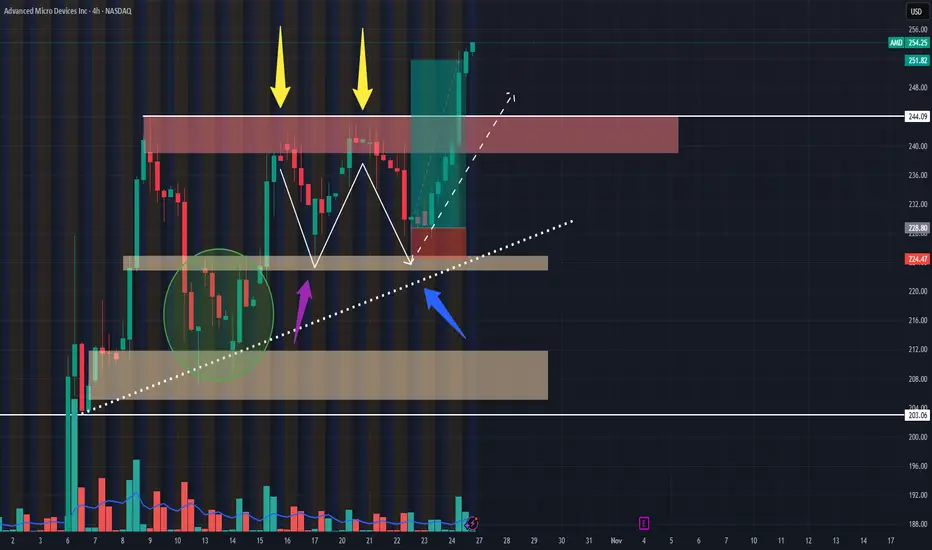
AMD Went Crazy!!! Post Trade Analysis 10/25/24Hello all,
This is my first time posting on here. So, please feel free to leave any questions, advice, or anything else in the comments!
I took this AMD swing trade on the 10/22/25 @ 2:12ish PM CST.
POSITION:
1 $300 Strike Call Exp Nov 7th 2025
Risk: $30 (price takes out low of hammer candle)
Initial PT: Previous highs (Red box) for $75 profit
Final PT: Actively managed since price moved past previous highs ($144 final profit)
WHY I TOOK THE TRADE
1. From the 7th-23rd AMD looked to be forming an ascending triangle pattern on the 1 day and 4HR timeframe.
2. AMD validated 2 support areas to me, which was an ascending support line (Blue arrow) and a demand zone from $222.92 to $225.11 (Purple arrow). In addition to this, price recently broke out from a W pattern (Green bubble) around 10/14 on the 1-4HR time frame (wish I saw it forming sooner lol), which confirmed to me that there was still momentum for the upside.
3. I saw that AMD was potentially forming another larger W pattern on the 1-4HR timeframes (Yellow arrows).
ENTRY Rules:
1. Measure Risk to Reward position, if less than 1.8 to 2.5 R/R, don't take the trade.
2. Wait for price to pull back to area of value (confirmed by multiple touch points.
3. Wait for a strong bullish candle to close 60% or above previous bearish candle (at the demand zone level), to confirm potential price reversal; then enter on the open of the very next candle.
4. Place SL where price invalidates analysis (below bullish hammer candle and demand zone), and PT at most recent highs (or actively manage if price pushes to the upside with momentum).
SUMMARY:
I am glad I took this trade, because it I am still relatively new to trading and I am improving on following my trade plan and TA more.
If anyone has any comments or feedback I would love to chat!
Thank you!
Amd - This is just the beginning!🎈Amd ( NASDAQ:AMD ) breaks out soon:
🔎Analysis summary:
Just a couple of months ago, we witnessed a very strong bullish retest on Amd. Back then the channel continuation remained extremely likely, perfectly playing out until today. But despite the recent parabolic rise, Amd can still rally another +50% according to the chart.
📝Levels to watch:
$200 and $300
SwingTraderPhil
SwingTrading.Simplified. | Investing.Simplified. | #LONGTERMVISION

AMD - Bull Rush IdeaAn idea suggesting a surge in price for AMD
This is made by comparing a previous situation on chart with current (grey rectangles) within the channel in blue
This is the 3 Monthly chart for AMD which is a very long timeframe
RSI also shows a cool pattern of rise and then long stagnation then right now a sharp rise.

AMD woke up from sleep; It was its timesAMD Update and New Outlook.
In my previous forecast, I maintained a bullish stance on AMD, identifying entry zones between $176 – $172 and projecting a potential move toward $200, with a longer-term target near its all-time high of $226.
Following the recent news of OpenAI acquiring a 10% stake in AMD, the asset successfully reached my forecasted targets.
After the subsequent rally, AMD has experienced a natural pullback, presenting fresh long-term opportunities.
I’m currently watching two new buy zones at $200 and $185 for potential long-term positions.
As always, this is not financial advice. Please conduct your own research (DYOR) before making any investment decisions.
Connect with me here on TradingView. Please, like, follow me and connect.
Previous forecast
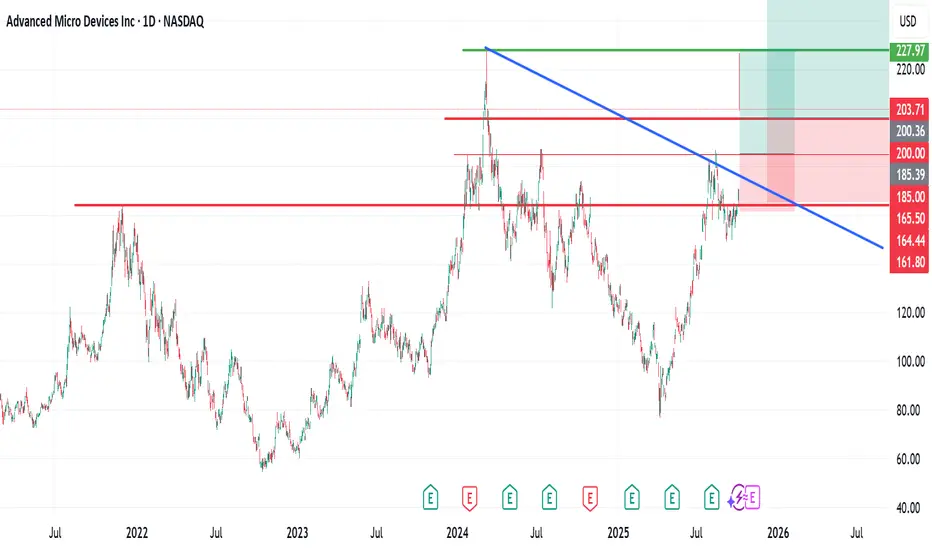
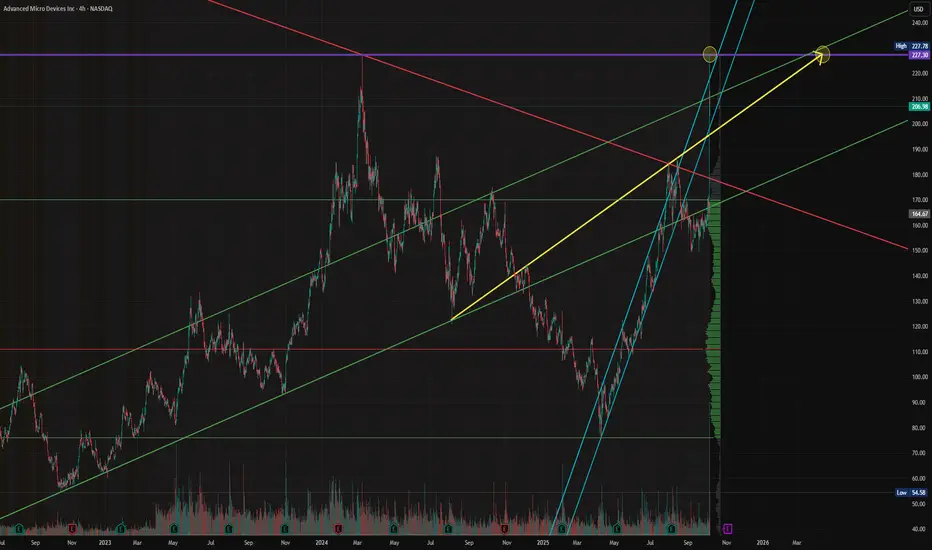
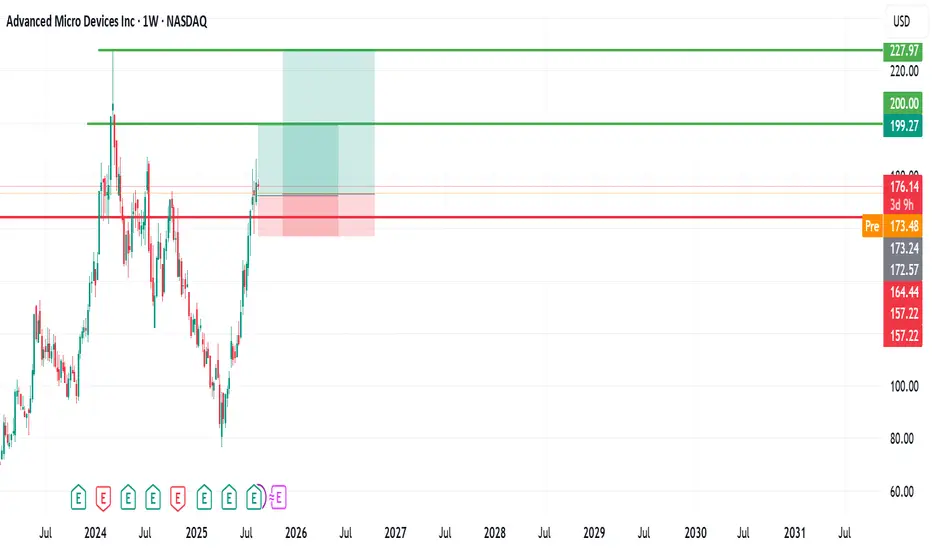
$AMD - Advanced Micro Device - $227.30 RetestNASDAQ:AMD continues its 2025 recovery rally — now clearing $200 and targeting the $227–$240 macro resistance zone.
After reclaiming the $165 structure break, AMD has re-entered its long-term ascending channel and is showing renewed strength in the AI-chip cycle.
Holding above $190 keeps this setup intact for continuation.
#AMD #AIStocks #Semiconductors #NASDAQ #BreakoutTrading #MyMIWallet
Advanced Micro Devices | AMD | Long at $126.00Advanced Micro Devices NASDAQ:AMD may be the sleeping giant in the semiconductor / AI space. While all eyes on NVidia NASDAQ:NVDA , earnings for NASDAQ:AMD grew by 800% over the past year... and are now forecast to grow 40% per year. Any other company would be soaring right now (like NVidia), but that company is getting all the attention. And, to me, this means opportunity for the future. The cashflow is likely to grow tremendously for
NASDAQ:AMD into 2027 and beyond, which may inevitably reward investors with dividends.
From a technical analysis perspective, NASDAQ:AMD just entered my historical simple moving average zone. This area (currently $108-$126) is where I will be gathering shares. Something tremendous would have to change regarding the fundamentals of this company (like a scandal) for the overall thesis to change. There may be some near-term price pains as NVidia gets all the focus, but to meet demand in the semiconductor and AI space, NASDAQ:AMD is poised to fulfill that roll in the future.
Target #1 = $158.00
Target #2 = $175.00
Target #3 = $188.00
Target #4 = $205.00

Amd - The path is too clear!🪓Amd ( NASDAQ:AMD ) will rally another +75%:
🔎Analysis summary:
For the past five years, Amd has been trading in a simple rising channel formation. With the recent retest of a major confluence of support, Amd once again confirmed the bullish trend. Following those previous cycles, Amd will now break the all time high and rally another +75% from here.
📝Levels to watch:
$200
SwingTraderPhil
SwingTrading.Simplified. | Investing.Simplified. | #LONGTERMVISION

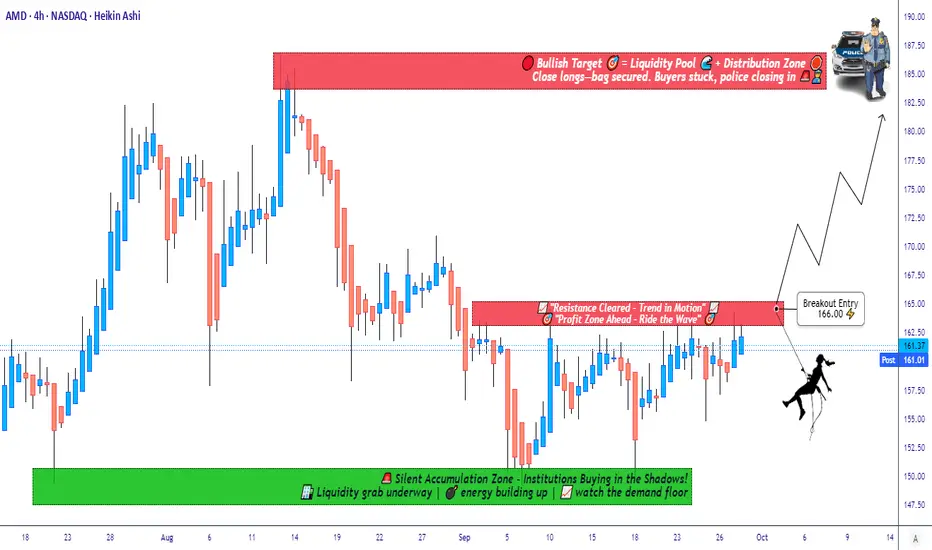
Breakout or Fakeout? Watching AMD Resistance for Next Big Move📈 AMD “Advanced Micro Devices, Inc” – Wealth Strategy Map (Swing/Day Trade)
🗺️ Plan:
I’m tracking AMD with a bullish strategy — waiting for a resistance level breakout to confirm momentum. Once price breaks the key barrier, entry opportunities open up.
🎯 Entry Setup (Thief Strategy Layering Method):
Instead of one entry, I’m applying a layering strategy with multiple buy limit orders. This approach helps average entries across different levels.
Buy limit layers: 155.00, 158.00, 160.00, 162.00, 163.00. 164.00
(💡 You can increase layers based on your own risk & comfort.)
Breakout confirmation: Entry after breakout price level mentioned.
🛑 Stop Loss (Thief SL):
Suggested stop loss @150.00
⚠️ Note: Dear Ladies & Gentlemen (Thief OG’s), this is my SL level, but you are not required to follow it. Manage risk according to your own plan.
🎯 Profit Target (Police Barricade Zone 🚨):
Price faces a strong resistance around 186.00 — this area acts as a trap zone with overbought conditions.
Target @186.00 (escape with profits before police catch you 🚔).
⚠️ Note: Again, TP is personal. Take profit when satisfied — your money, your choice.
🔗 Related Assets to Watch (Correlation Insight):
AMD tends to move in line with broader tech sentiment and semiconductors:
NASDAQ:NVDA (NVIDIA) – Direct sector competitor, often mirrors momentum.
NASDAQ:SMH (VanEck Semiconductor ETF) – Strong correlation, broader chip market direction.
NASDAQ:QQQ (NASDAQ 100 ETF) – AMD is a major component; index momentum often drives AMD.
NASDAQ:INTC (Intel) – Rival stock; negative news on INTC can boost AMD sentiment.
Watching these pairs helps confirm breakouts & avoid false signals.
✨ “If you find value in my analysis, a 👍 and 🚀 boost is much appreciated — it helps me share more setups with the community!”
⚠️ Disclaimer:
This is a Thief Style Trading Strategy — shared for fun & educational purposes only.
Not financial advice. Trade at your own risk.
#AMD #SwingTrade #DayTrade #Stocks #Semiconductors #TradingStrategy #BreakoutSetup #StockMarket #NVDA #QQQ
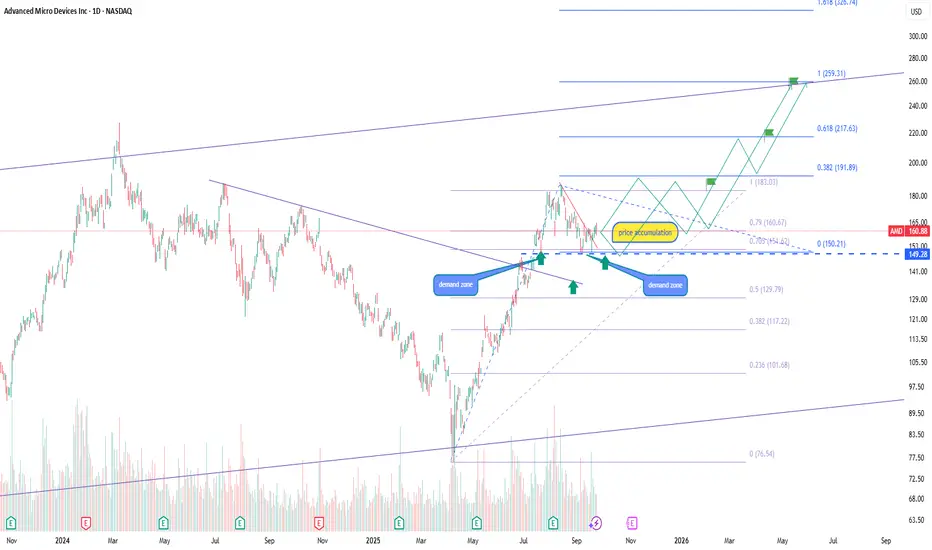
AMD reversal pattern and long-term growth potentialOn the AMD chart price holds the key support around 149–150 forming a base for continuation of the bullish trend. Above the consolidation zone at 160 targets open at 183, 217 and 259. In the longer-term perspective the structure points toward 326 and even higher as the trend remains bullish. Should a correction occur the 129 zone acts as major support to preserve the upward structure.
AMD keeps strengthening its market share in processors and GPUs, expanding rapidly in the server and AI segments. Strong demand for company products and its growing role in the AI ecosystem continue to attract institutional investors. Looking ahead to 2026, some analysts expect the stock to potentially reach levels around 900 per share.
Both the technical setup and fundamentals support further upside with near-term targets at 183, 217 and 259 while in the long-term a scenario above 300 and potentially up to 900 stays in focus for strategic investors. Risk-to-reward conditions provide a strong basis for holding existing positions and considering new entries. Additionally, investors may also look at opportunities through the AMD-linked ETF (AMDL).
Advanced Micro Devices (AMD) Stock Analysis. My buyAdvanced Micro Devices (AMD) Stock Analysis
AMD, listed on NASDAQ, has generally been on an upward trend. However, the last 2 weeks, the stock experienced a brief flash downturn, dropping to around the $157 level and witnessed a good recovery last week, reaching $186 zone.
Since then, it has pulled back and is currently trading at approximately $176 share.
Outlook:
I remain bullish on AMD with entries from $176 - $172 and anticipate a potential move toward the $200 level, with a longer-term target around its all-time high near $226.
For my entry strategy, I am adding positions at different levels, with an initial entry around $176 and another if it drops further
Position (s) are for a mid- to long-term hold.
Let’s see how it unfolds! If you have any insights or thoughts, please share them in the comments. I’d love to connect with you. Don’t forget to follow, share, and subscribe. Thank you.
AMD $160C – Tactical Bounce Trade You Don’t Want to Miss
# ⚡ AMD Weekly Mean-Reversion Setup (Sept 7, 2025)
### 🔍 Market Snapshot
* **Price:** \~\$151.14
* **Technicals:** Daily RSI 28.4 → Deeply oversold 📉 | Weekly RSI 54.1, falling
* **Options Flow:** Strongly bullish (C/P = 2.13) ⚡
* **Volatility:** Low (VIX \~15), gamma low → cheap premium
* **Timeframe:** 5-day weekly expiry
---
### 🎯 Trade Idea: Tactical Bounce Play
* **Instrument:** AMD
* **Direction:** CALL (Mean-reversion)
* **Strike:** \$160
* **Expiry:** 2025-09-12
* **Entry:** \$0.77 (mid/ask)
* **Profit Target:** \$1.54 (+100%)
* **Stop Loss:** \$0.31 (-40%)
* **Size:** 1 contract (small % account, scale per risk rules)
* **Confidence:** 65%
---
### ⚠️ Key Risks
* Prior week -10% drop & heavy distribution → counter-trend risk
* Full payoff requires \~\$9 move in 5 days → moderate probability
* Concentrated \$150 puts can act as support or accelerate downside
* Weekly theta decay → exit by Thursday, avoid Friday gamma ⚡
* News/macro shock risk → use small sizing
---
### 🔑 Trade Rationale
1. Daily RSI extreme → plausible 3–5 day bounce
2. High call flow @ \$160 → short gamma/short-term buying interest
3. Low VIX → cheap premium relative to potential move
---
### ⚙️ Execution Notes
* Enter at open, limit \$0.77
* Stop at \$0.31, take partial profit at +50% (\$1.16), full at +100% (\$1.54)
* Cut if price drops below \$148–\$149 on heavy volume
---
📊 **Summary:** Tactical, defined-risk mean-reversion play. Not a trend reversal — small allocation, event-driven weekly call.
\#AMD #OptionsTrading #WeeklySetups #TradingView #MeanReversion

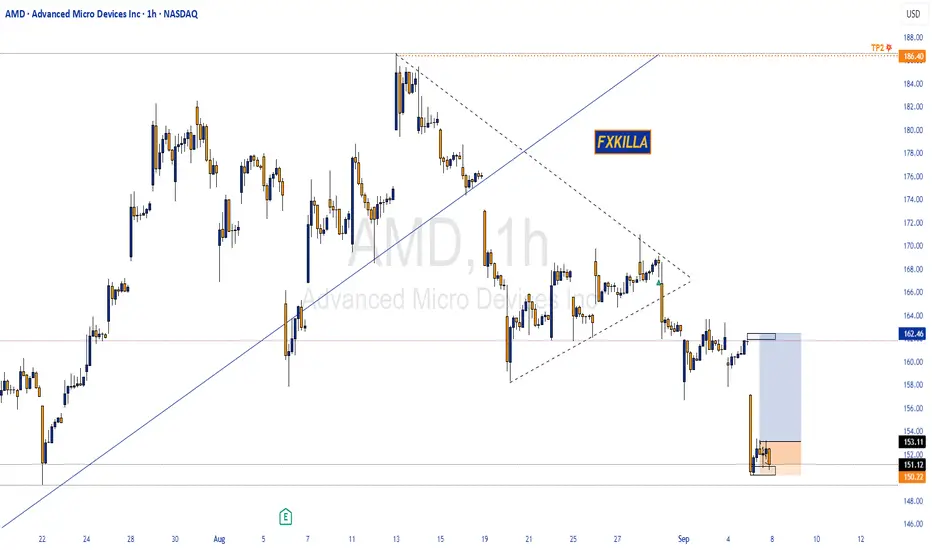
AMD HIGH PROBABILTY SETUP SOON !!!🚨 AMD HIGH PROBABILITY BUY SETUP 🚨
* Here We Can See Clearly The Next Potential Move For AMD Coming Hours/Days.
* Keep Your Eyes Close On Your Trading Positions.
* Happy PIP Hunting Traders.
FXKILLA
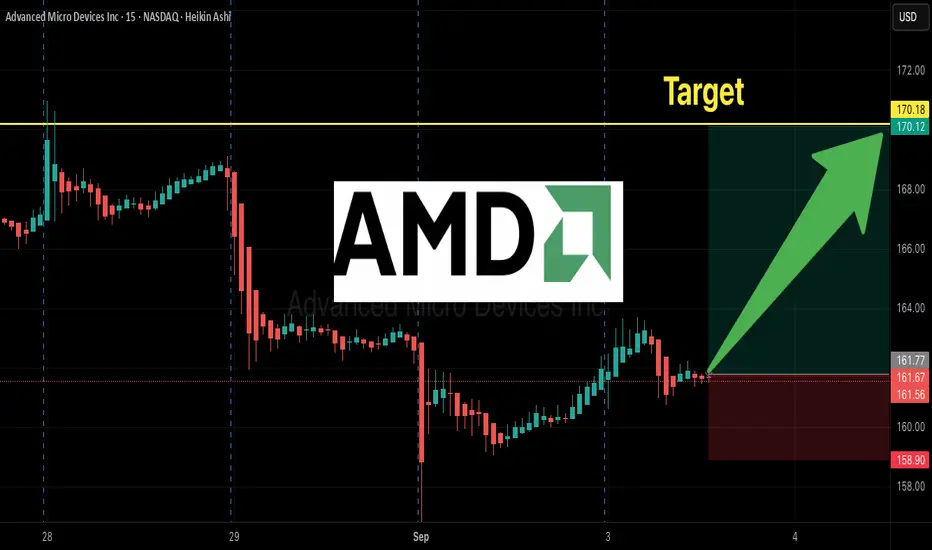
AMD Weekly Call Play – $170 Strike Ready to Explode?
## 🔥🚀 AMD Weekly Options Setup (Sep 3, 2025) 🚀🔥
💎 **High-Risk, High-Reward Call Play!** 💎
### 📊 Market Consensus
* 📈 **Bias:** Moderately Bullish (short-term upside skew).
* 🏦 **Flow:** Institutional heavy call buying (C/P = **2.19**) at \$170 strike.
* 📊 **RSI:** Weekly strong (70.8), Daily weak (43.2) → divergence ⚠️.
* ⏰ **Risk:** Only 2 DTE → Gamma & Theta decay **very high**.
---
### 🎯 Trade Setup
* 🏦 **Instrument:** AMD Weekly Call (Exp 09/05)
* 🚀 **Strike:** \$170
* 💵 **Entry:** \$0.59
* 🛑 **Stop Loss:** \$0.30 (≈50%)
* 🎯 **Target:** \$1.18 (+100%)
* 📅 **Exit Rule:** Close **by Thursday EOD** (don’t hold into Friday gamma).
* 📏 **Size:** 1 contract (keep it small)
* 📈 **Confidence:** 65%
---
### ⚠️ Key Risks
* ⏳ Time decay → Premium can evaporate fast.
* 📉 Weak daily momentum → Possible pullback.
* 🕒 Slippage & spreads → Use **limit orders**.
---
## 📌 Tags (TradingView + SEO Boost)
\#AMD #OptionsTrading #WeeklyOptions #CallOptions #SwingTrade #Breakout #TechStocks #RiskReward #StockMarket #TradingSetup #GammaRisk #ThetaDecay #MomentumTrading
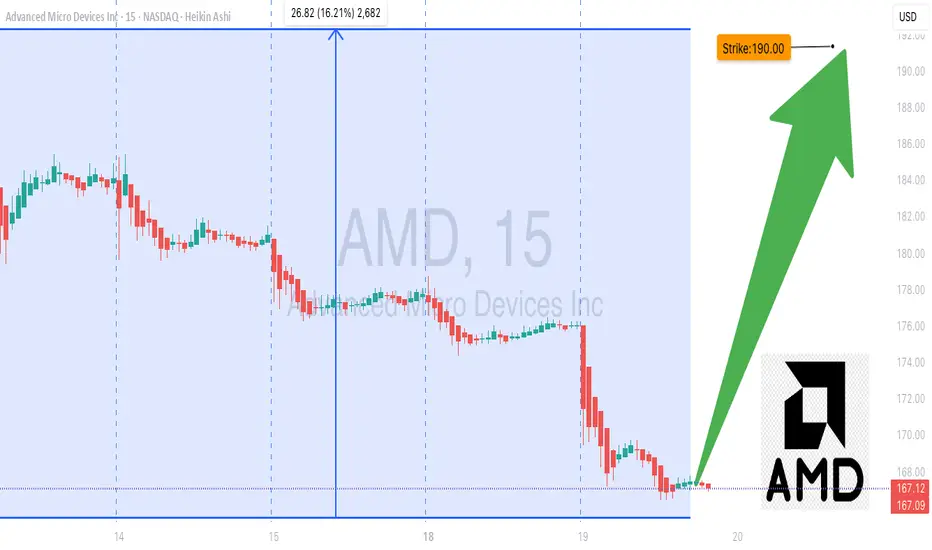
AMD Options Alert: $190 Call Ready to Pop!
# 🚀 AMD Weekly Options Analysis (Aug 19, 2025) 🚀
### **Market Snapshot**
📊 **Daily RSI:** 56.3 ⬇️ (Neutral)
📈 **Weekly RSI:** 85.1 ⬇️ (Potential Reversal ⚠️)
📉 **Volume:** Weak institutional activity (0.6x last week)
🔥 **Options Flow:** Call/Put ratio 1.21 → Moderate Bullish
✅ **Volatility:** Favorable (VIX < 15)
💡 **Overall Bias:** Moderate Weekly Bullish
---
### **Model Breakdown**
| Report | Trend | Volume | Options Flow | Bias |
| -------------------- | ------------------ | ------- | ------------ | ------------------- |
| **Grok/xAI** | NEUTRAL | WEAK 📉 | BULLISH 🔥 | Moderate Bullish 👍 |
| **Gemini/Google** | NEUTRAL/Bearish ⚠️ | WEAK 📉 | BULLISH 🔥 | Neutral/Bearish 🤔 |
| **Claude/Anthropic** | NEUTRAL/Bearish ⚠️ | WEAK 📉 | BULLISH 🔥 | Moderate Bearish 👎 |
| **Llama/Meta** | NEUTRAL ⚠️ | WEAK 📉 | BULLISH 🔥 | Moderate Bullish 👍 |
| **DeepSeek** | NEUTRAL ⚠️ | WEAK 📉 | BULLISH 🔥 | NEUTRAL 🤷 |
✅ **Consensus:**
* Weak volume = concern 🚨
* Low VIX = favorable for options 💎
* RSI signals mixed; overbought caution ⚠️
---
### **💥 Trade Recommendation 💥**
**Strategy:** Cautious Naked Call
* 🎯 **Instrument:** AMD
* 💰 **Strike:** \$190
* 🗓️ **Expiry:** Aug 22, 2025
* 💵 **Entry Price:** \$0.70
* 🎯 **Profit Target:** \$1.05 (50%)
* 🛑 **Stop Loss:** \$0.35
* ⏰ **Entry Timing:** Market Open
* 📈 **Confidence:** 65%
⚠️ **Key Risks:**
* ⏳ Accelerated time decay (3-day expiry)
* 📉 Weak volume may trigger profit-taking
---
### **Trade JSON**
```json
{
"instrument": "AMD",
"direction": "call",
"strike": 190.00,
"expiry": "2025-08-22",
"confidence": 0.65,
"profit_target": 1.05,
"stop_loss": 0.35,
"size": 1,
"entry_price": 0.70,
"entry_timing": "open",
"signal_publish_time": "2025-08-19 09:51:08 UTC-04:00"
}
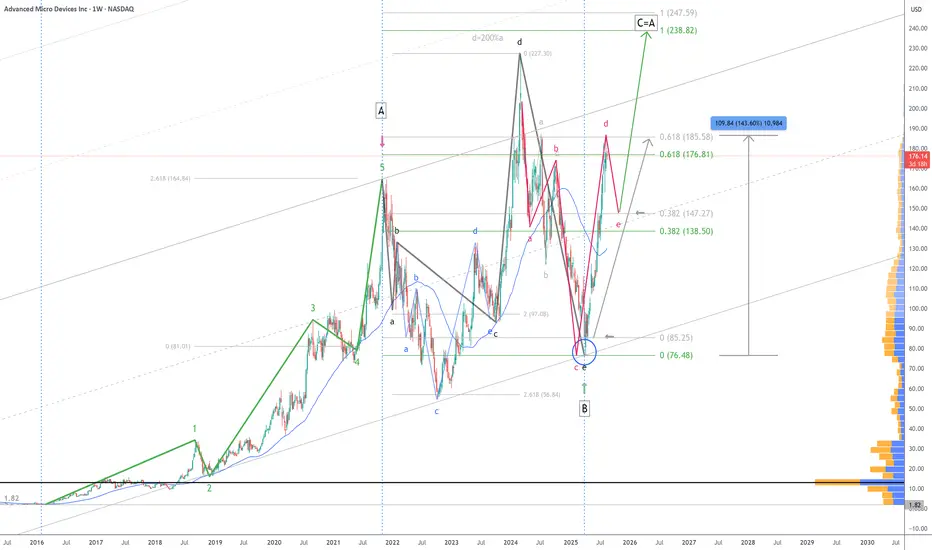
$AMD Analysis: Perfect Hit & One of Many Scenarios! 8/18/2025NASDAQ:AMD hits the 61.8% target of major wave A - up nearly 144% gain in 3 months! 👌
📈 A pause near $148 could complete the red NT (abcde) structure before a potential continuation toward C=A target at $236 or $247
One of many paths... let’s see how it unfolds!
Cheers!
#ElliottWave #AMD #TechnicalAnalysis