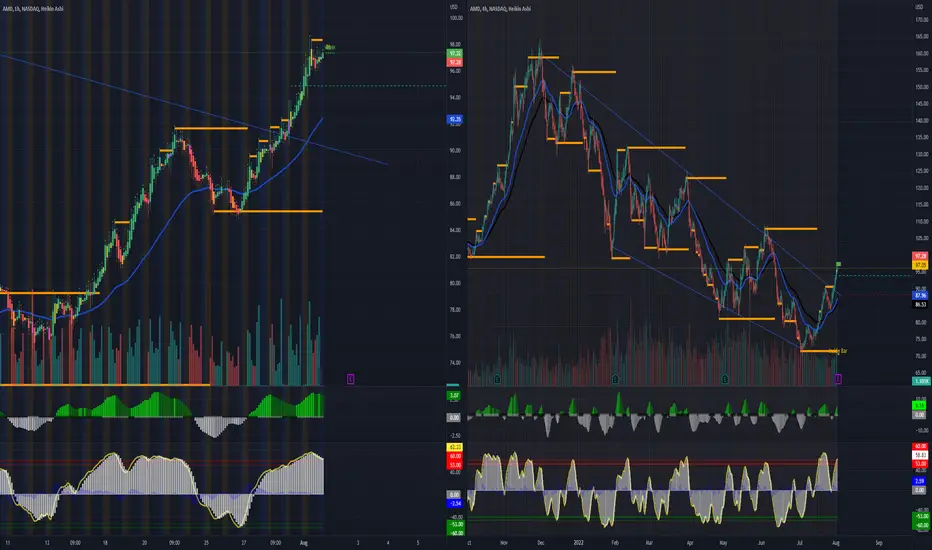
AMD INV H&S ( SHORT TERM BULLISH )
AMD Inv. H&S, high chance of another bullish leg up to capitalize off of. The reasoning for short term bullish is due to the fact that the weekly time frame is over extended with a similar historial pattern to the previous "top" of AMD's weekly high before falling to correct.
Amdsignal

ANALYSIS ON AMDDear Traders and Investors,
I'm sharing with you this analysis on AMD to tell you to close your position if you're holding a long trade, as you can see in the chart, the price pulled back on the 0.5 level of the fib and gave us a confirmation, now it's heading towards the 0.6.
For further question, don't hesitate to ask!

$AMD Due for a Correction This WeekAMD has been showing a lot of bullishness since September 26. However, AMD has reached the upper range of the white channel and is due for a correction this week. I have the yellow trend line as a key support level and my first price target. I think there will be a solid bounce off this yellow support line in the short term.

$AMD Quarter 3 (Q3) AnalysisAMD is playing out as planned since the initial Q2 prediction with a dip into the buy zone. I’ve been saying that AMD is an excellent buy opportunity under $100, and the bearish August and September price action has helped to send AMD down to this price level. I have $158.53 as a key price target for Q4, and I believe that AMD will form a new all-time high afterwards. Long-term I think AMD will be a $400-500 stock. The yellow trendline has been acting as a support level and AMD just formed a bullish bounce off this support. The red trendline will act as short-term resistance on the way up.

AMD BUYHi, According to my analysis of AMD stock, there is a good opportunity to buy. Or a long-term investment. All reasons for purchasing are explained as shown in the analysis. Good luck everyone

AMD stocks experienced range fluctuations in 1.382 and 1.618AMD stocks experienced range fluctuations in 1.382 and 1.618 positions
This chart shows the weekly candle chart of AMD stocks over the past two years. The top to bottom golden section at the end of 2021 is superimposed in the figure. As shown in the figure, AMD stocks experienced range fluctuations in May and mid June of this year after retreating to 1.382 and 1.618 positions, following the 1.000 position of the golden section in the upper test chart! The weekly chart for the past two weeks has shown a long upward shadow and a steady downward shift in center of gravity! In the future, the probability of AMD stocks weakening is expected to return to the bullish starting point in May 2023 as shown in the chart!

20 Reasons for long AMD
🔆MULTI-TIME FRAME TOP-DOWN ANALYSIS OVERVIEW☀️
1:✨Eagle eye: In 2016, the stock started its bullish run and created its first multi-year Bullish Order Structure (BOS) and also set an All-Time High (ATH). After a correction move last year, an important point to note is that the Point of Interest (POI) area held, indicating that bulls still have power and the stock is showing strength. It is now poised for the next impulsive move towards a new ATH.
2:📆Monthly: In October 2022, the correction move confirmed a Lower High (LH), signaling the end of the correction. Now, the price may either consolidate sideways or take a reversal impulse move. We need to consider both possibilities. If the price consolidates, the range between 98 and 110 is important, and we should only look for buying opportunities within this range.
3:📅Weekly: A very strong bullish structure has already formed, and the price has made a BOS and almost completed its corrective move. The corrective area ranges from 100 to 104. Here, we need to wait for a strong reversal signal to confirm the buying opportunity. No further signals are needed, only one confirmed reversal signal.
4:🕛Daily: A well-established bullish trend is evident, with a strong inducement and a corrective move that has filled the gap and window. The price is now approaching the most recent support area after the inducement. The most important thing to watch carefully is the confirmation of today's pro-gap. If the price closes above 112 for the next two or three days, or even today, it will provide a buying confirmation.
😇7 Dimension analysis
🟢 analysis time frame: Daily
5: 1 Price Structure: Extremely bullish
6: 2 Pattern Candle Chart: Pro-gap
7: 3 Volume: High selling volumes indicate the end of the correction, and now a confirmation of the long position is needed.
8: 4 Momentum UNCONVENTIONAL RSI: Holding above the 40 area, indicating a middle strength bullish zone.
9: 5 Volatility measure Bollinger bands: Volatility is starting to squeeze, which may lead to a temporary calm or sideways movement before a bullish move. The breakout of the squeeze will provide final confirmation.
10: 6 Strength ADX: Completely sideways.
11: 7 Sentiment ROC:
✔️ Entry Time Frame: Daily
12: Entry TF Structure: Bullish
13: Entry Move: Initial impulsive move
14: Support Resistance Base: The most recent Order Structure (OS) after the inducement acts as strong support.
15: FIB: Not activated yet. Additionally, a breakout of the hourly trend line will provide an additional confirmation.
☑️ Final comments: Buy at confirmation.
16: 💡Decision: Go long.
17: 🚀Entry: 112
18: ✋Stop Loss: 104
19: 🎯Take Profit: 148
20: 😊Risk to Reward Ratio: 1:6.5
🕛 Expected Duration: 30 days

There is still room above of AMD stock !There is still room above of AMD stock !
This chart shows the Line chart of AMD shares in the last two years. The top to bottom golden section is superimposed in the figure. As shown in the figure, the recent high point of AMD stock happens to be 1.000 level of the top to bottom golden section in the figure, and the recent wave of long start bits also happens to be 2.382 level of the top to bottom golden section in the figure! So, in the future, the probability of AMD stocks will continue to break through upwards, test the 0.618 level of the golden section, and then fall back, fluctuating and weakening!

AMD -> The Breakout Happened As PredictedHello Traders,
welcome to this free and educational multi-timeframe technical analysis .
In my last video analysis of AMD, linked below, I explained all the reasons for which I do expect the market to provide further continuation towards the upside and actually breaking above the neckline of the very obvious weekly double bottom.
With todays price action, this is exactly what happened, we are seeing a massive breakout to the upside, which could definitely lead to a significant short covering rally.
I am now just waiting for a small retracement on AMD and bullish confirmation to enter a long to also participate in this very bullish momentum.
Thank you for watching and I will see you tomorrow!
You can also check out my previous analysis of this asset:

Advanced Micro Devices Analysis 23.01.2023Hello Traders,
welcome to this free and educational analysis.
I am going to explain where I think this asset is going to go over the next few days and weeks and where I would look for trading opportunities.
If you have any questions or suggestions which asset I should analyse tomorrow, please leave a comment below.
I will personally reply to every single comment!
If you enjoyed this analysis, I would definitely appreciate it, if you smash that like button and maybe consider following my channel.
Thank you for watching and I will see you tomorrow!
You can also check out my previous analysis of this asset:

Advanced Micro Devices Analysis 27.12.2022
Hello Traders,
welcome to this free and educational analysis.
I am going to explain where I think this asset is going to go over the next few days and weeks and where I would look for trading opportunities.
If you have any questions or suggestions which asset I should analyse tomorrow, please leave a comment below.
I will personally reply to every single comment!
If you enjoyed this analysis, I would definitely appreciate it, if you smash that like button and maybe consider following my channel.
Thank you for watching and I will see you tomorrow!
You can also check out my previous analysis of this asset:

Advanced Micro Devices Analysis 12.12.2022Hello Traders,
welcome to this free and educational analysis.
I am going to explain where I think this asset is going to go over the next few days and weeks and where I would look for trading opportunities.
If you have any questions or suggestions which asset I should analyse tomorrow, please leave a comment below.
I will personally reply to every single comment!
If you enjoyed this analysis, I would definitely appreciate it, if you smash that like button and maybe consider following my channel.
Thank you for watching and I will see you tomorrow!
You can also check out my previous analysis:

Advanced Micro Devices Analysis 27.11.2022Hello Traders,
welcome to this free and educational analysis.
I am going to explain where I think this asset is going to go over the next few days and weeks and where I would look for trading opportunities.
If you have any questions or suggestions which asset I should analyse tomorrow, please leave a comment below.
I will personally reply to every single comment!
If you enjoyed this analysis, I would definitely appreciate it, if you smash that like button and maybe consider following my channel.
Thank you for watching and I will see you tomorrow!

AMD Advanced Micro Devices Options Ahead of EarningsLooking at the AMD Advanced Micro Devices options chain, i would buy the $60 strike price Puts with
2022-11-4 expiration date for about
$1.81 premium.
If the options turn out to be profitable Before the earnings release, i would sell at least 50%.
Looking forward to read your opinion about it.

🟢 AMD - 3D (06.10.2022)🟢 AMD
TF: 3D
Side: Long
SL: $54.69
TP 1: $86.81
TP 2: $101.65
TP 3: $113.65
AMD has done falling and showing signs of recovery by creating a possible rounding bottom in lower time frames.
I think it will start pushing back up now as RSI and MACD look like they have bottomed and wanting to go up.

AMD trade setup idea 15-september-2022AMD is in a downward channel since Jan this year. Partly because of the Semiconductor issue.
The current support level is an important level(75-77) for AMD. It has already tested this level twice.
We would have to wait for the price to show us the direction.
If we cross 78.5, we could take a long position with the first target around 83.5 levels.
If it penetrates the support levels of 75, we could take a short position with a mid term target of 60.

$AMD big resistance..$AMD needs to break the big resistance of $104 before it continues its rally back to 106+ no major news so far about the company and its products. Semis dipped after a market shifted its focus to energy stocks. i believe the semis and the tech stocks will continue to pull back, expect more pain until J Powell next meeting. For now, you might want to check out retail stocks and travel stocks.
here's my day trade price target for AMD on FRIDAY 08/12/22.
============================================================
For calls; buy above $99.39 and sell at 100.47 or above
For puts, buy below 96.62 and sell at 95.13 or below
============================================================
Welcome to this free technical analysis . ( mostly momentum play )
I am going to explain where I think this stock might possibly go the next day or week play and where I would look for trading opportunities for day trades or scalp play.
If you have any questions or suggestions on which stocks I should analyze, please leave a comment below.
If you enjoyed this analysis, I would appreciate it if you smashed that LIKE or BOOST button and maybe consider following my channel.

$AMD falling chopstick breakout?AMD breaks out from its 3 day losing streak to 4 day winning streak after the feed week and blue chips earnings. AMD looks like a falling chopstick at 4hr chart. but also clearly visible its lower high movement. with earnings coming up tomorrow after market close. i expect $AMD to pull back along with the overall market as it starts to cool off its steam from 4 day winning streak. or it can go sideway like consolidation and make little move before the market close. AMD could breakout to $100 if they beat the Wall Street EPS estimate with positive guidance.
here my price target for $AMD for monday 08/02/22.
============================================================
For calls; buy above $98.30 and sell at 100.36 or above
For puts, buy below 96.50 and sell at 93.95 or below
============================================================
Welcome to this free technical analysis . ( mostly momentum play )
I am going to explain where I think this stock might possibly go the next day or week play and where I would look for trading opportunities
for day trades or scalp play.
If you have any questions or suggestions on which stocks I should analyze, please leave a comment below.
If you enjoyed this analysis, I would appreciate it if you smashed that LIKE or BOOST button and maybe consider following my channel.
$AMD down trend momentum$AMD has been trending down at a lower level ever since the market continues to pull back. Since then, $AMD picks ups a lot of short interest creating this downward move. The company's earnings have been amazing lately and continues its innovation for computer chips and probably expanding their reach to cloud computing and so on. a lot of big institutional traders seeing a buy, but the uncertain of the current market right now, preventing some traders to hold the stocks for long swing.
The average move of AMD per day is about $4.00-6.00 depending on market conditions and news.
here my price target for $AMD for monday 07/11/22.
============================================================
For calls; buy above $80.15 and sell at 82.14 or above
For puts, buy below 78.18 and sell at 77.40 or below
============================================================
Welcome to this free technical analysis . ( mostly momentum play )
I am going to explain where I think this stock might possibly go the next day or week play and where I would look for trading opportunities
for day trades or scalp play.
If you have any questions or suggestions on which stocks I should analyze, please leave a comment below.
If you enjoyed this analysis, I would appreciate it if you smashed that LIKE button and maybe consider following my channel.

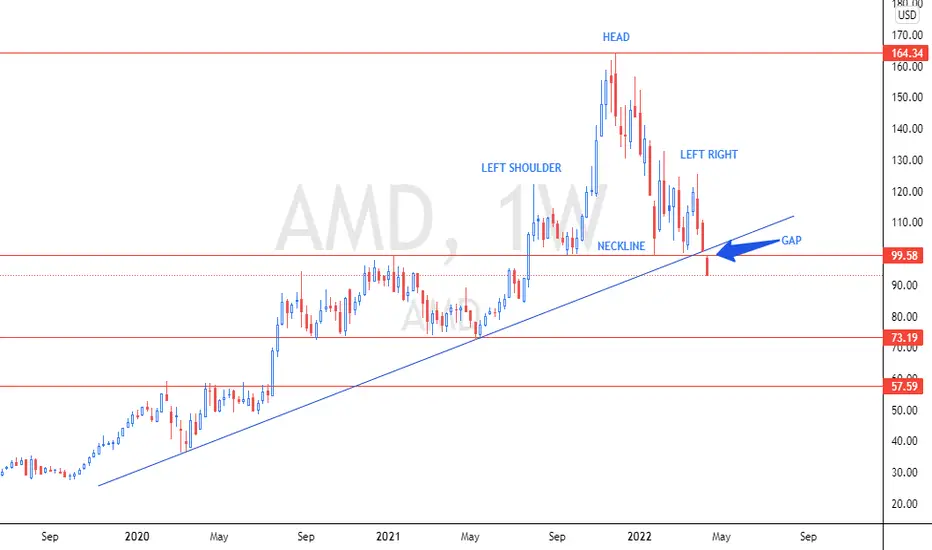
AMD HEAD & SHOULDER POISONED AMD Bears in action, Active Head & Shoulders + Gap + Broken multi-year ascending trendline. Next potential support level acts at $73.19
AMD Forward P/E discountIf you haven`t bought AMD here:
or here:
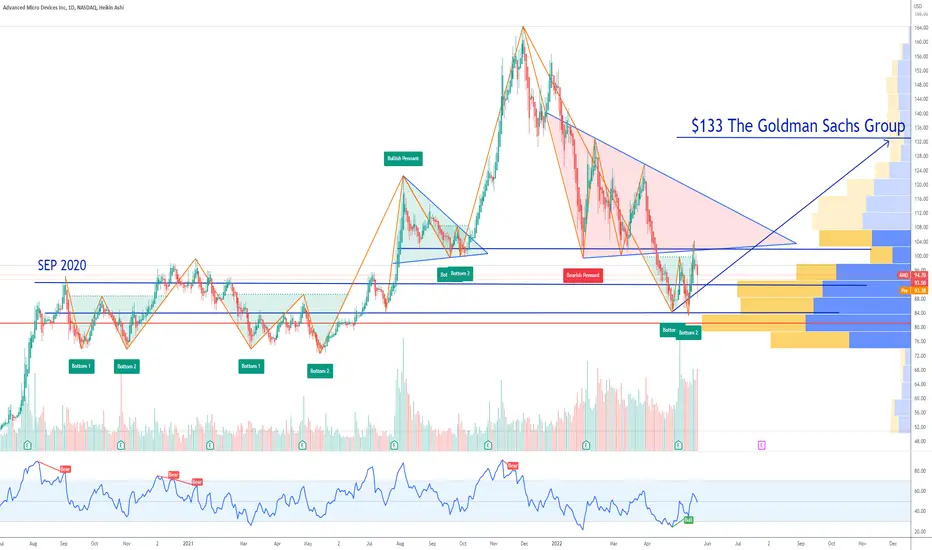
then you should know that AMD is trading at a 61% forward P/E ratio discount versus the 5 year average!
The Goldman Sachs Group has an $133 price target for it!
Looking forward to read your opinion about it.
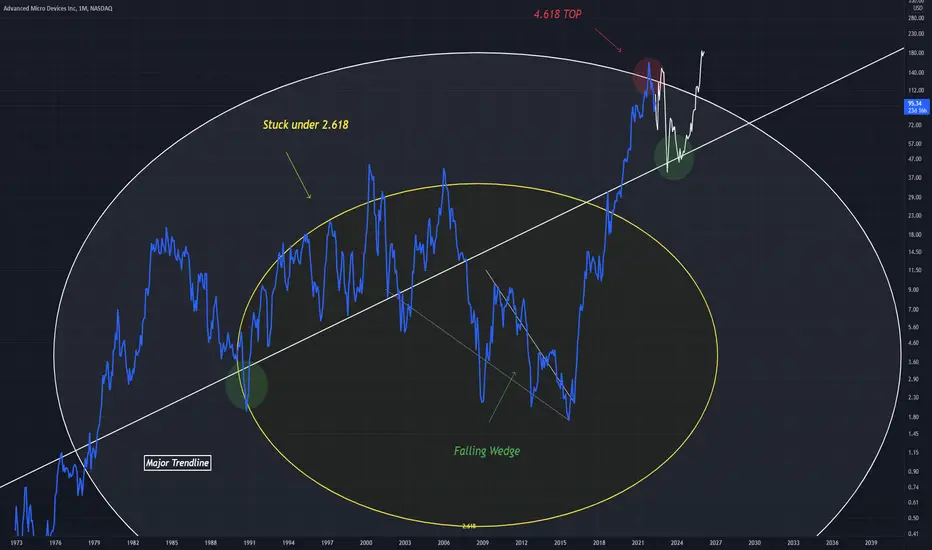
AMD AnalysisAn idea for AMD which suggests a pullback yet a support find above a major Trendline
Price action is very interesting in yellow, as it moves around the top of the circle (2.618)
White bars pattern is a guess of future price action (allowing support to be found at the Trendline.
AMD - Final Push UpA chart for AMD showing bullish activity and price entering a major channel
A phase like this has been seen previously and has been marked with corresponding colours
A giant falling wedge is the culprit for the recent bullishness
One more final move up until top at 1.272
