AMZN Bullish BreakoutAmazon has the fundamentals to keep the longer-term bid intact, even if the tape feels choppy near-term. The market is balancing heavy AI infrastructure spend (and the free cash flow hit that comes with it) against durable growth—especially the acceleration in AWS and steady revenue beats. With Q4 earnings approaching, that “prove it” catalyst is likely what decides whether this consolidation resolves higher or slips into a deeper reset.
Technically, AMZN is digesting a strong uptrend. On the 1D, price is compressing inside a clean $230–$250 consolidation range, with the 20 MA (~$240.20) acting as near-term resistance and the 60/120 MAs (~$234.05 / ~$230.52) acting as support. Weekly and monthly structure remain bullish, so the primary path is still a continuation—provided the range breaks in the right direction.
For the bullish scenario, the trigger is a 1D close above $250. That’s the line where the range turns into a breakout, with follow-through potential toward $265 while using $242.5 as the invalidation level (back below recent swing structure). If instead we see a 1D close below $230, that would signal a breakdown from the range and shift focus toward $222 first, with the bearish idea invalidated back above $237.5
Amznlong

AMZN Bullish SMA Pullback | Institutional Swing Setup🚀 AMZN: The AI Cloud King's Pullback Play! | Swing Trade Setup 💰
🎯 Instrument: Amazon.com Inc. (NASDAQ: AMZN)
⏱️ Timeframe: Multi-Day Swing Trade (3-7 days)
📊 Strategy Type: Bullish Mean Reversion + Technical Confluence
🔥 Confidence Level: Institutional Grade 📋
📌 THE SETUP (Current Price: $241.44)
Amazon is consolidating near critical support zones after a 60% rally from 52-week lows ($161.38 → $258.60). With earnings on Feb 5, 2026 and keynote expansion into AI data centers, this presents a textbook swing trade opportunity. 🤖
🎯 BULLISH THESIS
✅ Technical Confluence:
Simple Moving Average (SMA 50/200) providing dynamic support
Price bouncing off $228-$232 support zone (psychological + institutional levels)
Rounding bottom pattern forming (classic bullish reversal indicator)
✅ Fundamental Tailwinds:
AWS Growth Acceleration: Amazon Web Services driving 30%+ YoY revenue growth, commanding 17% of total revenue
AI Data Center Demand: Strategic copper deal with Rio Tinto signals massive capex into AI infrastructure (70% of cash flow allocated)
Retail Dominance: E-commerce segment (74% of revenue) shows 12.24% quarterly growth
Margin Expansion: EBITDA at $141.68B with 19.15% margin—highest in 3 years ⚡
Analyst Consensus: 63 out of 67 analysts rate BUY | Average target: $295.21 (+23% upside)
💎 ENTRY STRATEGY (Smart Laddering)
Use multiple limit buy orders to scale in smoothly (25% position per layer):
🎯 Layer 1: $239.50 - Confirmation of support
🎯 Layer 2: $236.00 - Intermediate zone
🎯 Layer 3: $232.00 - Key psychological level
🎯 Layer 4: $228.00 - Ultimate accumulation zone
Pro Tip: Adjust ±$2-3 based on daily price action. Stay flexible! 📍
🎯 PROFIT TARGET
Primary Target: $260.00 🏆
Secondary Target: $270.00 (Psychological resistance + prior resistance band)
Tertiary Target: $280.00 (Monthly resistance + analyst consensus)
Rationale:
Breaks above 52-week high of $258.60
Aligns with institutional resistance clusters
Captures pre-earnings momentum
Provides 7-17% unrealized gains ✨
🛑 RISK MANAGEMENT (Critical!)
Stop Loss: $227.00
Placement Reasoning: Below the $228-$232 support zone, closing a daily candle here signals bearish invalidation. Protects against surprise earnings miss or macro headwinds.
Risk-Reward Ratio: 1:3.2 (Excellent! 🎲)
Position Sizing: Never risk more than 1-2% of total portfolio on this single trade
📈 RELATED PAIRS TO MONITOR (Correlation Watch) 🔗
🔴 NASDAQ:MSFT (+0.89) – AI competitor strength | Watch $450 breakout
🔴 NASDAQ:NVDA (+0.85) – Chip demand barometer | AWS data center proxy
🔴 NASDAQ:META (+0.82) – Big Tech sentiment | CapEx cycle correlation
🔴 NASDAQ:QQQ (+0.91) – Tech sector ETF | Leading indicator (must hold support)
🔵 TVC:DXY (-0.67) – US Dollar | Stronger $ = headwind for exports
🔵 TVC:VIX (-0.73) – Market volatility | Avoid entry if VIX > 18
⚡ Entry Rule: Wait for NASDAQ:QQQ support confirmation + TVC:VIX below 18 before scaling in! 📊
🌍 MACROECONOMIC & FUNDAMENTAL FACTORS (Feb 2026 Preview)
🔴 HEADWINDS:
FTC Antitrust Scrutiny: Regulators targeting Amazon's marketplace practices (watch for policy shifts)
Layoff Execution Risk: 30,000 job cuts (16K announced Jan 2026) could disrupt operational efficiency short-term
UPS Relationship Breakup: UPS cutting Amazon logistics services = inventory delays possible
Fresh/Go Store Closures: Grocery pivot failing signals capex inefficiency narrative ⚠️
🟢 TAILWINDS:
Earnings on Feb 5: Market historically rewards AWS guidance beats (watch for capex/AI commentary!)
AI Investment Cycle: Amazon's copper deal proves long-term AI data center commitment—signals confidence 🚀
Cloud Market Growth: Gartner projects 20%+ IaaS growth through 2026
International Expansion: Germany, UK, Japan segments showing 8%+ growth
Prime Video Monetization: Ad-tier rollout driving revenue diversification ✨
⏰ Calendar Alerts:
Feb 5, 2026: AMZN Q4 Earnings (Critical!)
Feb 10-15: Analyst callout periods (watch for price gaps)
Mid-Feb: Potential macro Fed commentary on rates (impacts growth stocks)
💼 TRADE EXECUTION CHECKLIST
✅ Pre-Entry:
Wait for daily close above $241 (confirmation)
Check NASDAQ:QQQ support (must be intact)
Verify TVC:VIX < 18 (low volatility environment)
Place all four limit orders simultaneously
✅ During Trade:
Scale in gradually (don't FOMO all at once!)
Adjust stops to breakeven once 25% profit reached
Move stops up by $2 after each 5% gain
Monitor pre-earnings catalysts daily
✅ Exit Plan:
Trail stop at $255 once $260 zone approaches
Take 50% profits at $260 (lock in gains!)
Let remaining 50% ride to $270-$280
Close all positions by Feb 4 (earnings risk!)
⚡ THE FUNNY, PROFESSIONAL TRUTH 😄
Look, the market doesn't care about your feelings or your "fool-proof strategy." What it does care about:
Supply/Demand imbalances (Your limit orders create that!)
Risk-to-Reward ratios (3.2:1 = Institutional quality!)
Catalyst timing (Earnings Feb 5 = This is your window!)
Position sizing discipline (1-2% risk = Sleep-at-night money!)
This isn't about getting rich quick—it's about compounding consistent 5-8% swing trades into generational wealth. Amazon at $241 with $260 targeting is math. The rest is emotional control. 💪
Your engagement directly helps me dedicate more time to institutional-grade swing trade analysis. Much appreciated! 🙏
Happy Trading! May your exits be as smooth as your entries. 📊✨

Amazon - A quite boring new all time high!🎈Amazon ( NASDAQ:AMZN ) is simply heading for new highs:
🔎Analysis summary:
For the past couple of months, Amazon has overall just been consolidating. But in the meantime, we witnessed a major bullish break and retest and an expected rally of +50%. Following this quite slow behavior, Amazon will also slowly create new highs.
📝Levels to watch:
$250
SwingTraderPhil
SwingTrading.Simplified. | Investing.Simplified. | #LONGTERMVISION

AMZN Breakout Reload? TMA Pullback Shows Buyer Strength🔥 AMZN Swing Trade Profit Playbook | Bullish Pullback + Thief Layering Strategy 🟢📦
Welcome back, Ladies & Gentlemen — the Thief OG’s 😎🕵️♂️
Here’s a polished, rule-friendly breakdown of the bullish setup developing on AMZN (Amazon.com Inc.) – NASDAQ.
📌 Market Context
AMZN is showing a clean bullish pullback into the Triangular Moving Average (TMA) zone, supported by a Heikin Ashi Doji Reversal, signaling that buyers are gaining strength and attempting to dominate momentum again. 📈🔥
🧠 Trade Plan (Swing Trade)
Plan:
A bullish pullback strategy confirmed by:
🔺 Triangular Moving Average pullback reaction
🟩 Heikin Ashi reversal-doji indicating potential trend continuation
📊 Buyers stepping in with momentum recovery
🎯 Entry Plan – Thief Style Layering (Multiple Limit Orders)
This is the famous Thief Strategy — using layered limit orders to scale into the move like a master of stealth 😎🕵️♂️💼
(TradingView-safe version: purely educational, optional, trade at your own risk.)
Layered Buy Limits:
🟢 215.00
🟢 220.00
🟢 225.00
🟢 230.00
(You may increase or adjust layers based on your own style and risk tolerance.)
🛑 Stop-Loss (Thief Style Educational Version)
SL Zone (Optional):
❌ 210.00
⚠️ Note: Dear Ladies & Gentlemen (Thief OG’s), this level is NOT a recommendation — it’s just part of the thief-style educational breakdown.
Choose your own risk plan, trade your own analysis.
🎯 Target Zone
The “Police Force” 🚓 — aka strong resistance, potential overbought zone, and liquidity trap area — sits around:
🟡 Target @ 250.00
⚠️ Note: Dear Ladies & Gentlemen (Thief OG’s), this is NOT a fixed TP recommendation.
Manage your profits as per your own risk appetite and strategy.
📡 Related Pairs to Watch (Correlation & Market Behavior)
Watching correlated tickers helps understand broader tech-sector sentiment and liquidity rotation.
Here are the key names to keep an eye on:
📌 NASDAQ:AAPL (Apple Inc.)
Strong correlation with AMZN in tech-momentum cycles.
When AAPL shows bullish continuation, AMZN often follows with similar pressure.
📌 NASDAQ:META (Meta Platforms Inc.)
Tracks consumer-tech spending sentiment.
Strong META moves can hint at acceleration across NASDAQ growth stocks.
📌 NASDAQ:MSFT (Microsoft Corp.)
A heavyweight pillar in NASDAQ.
MSFT strength boosts overall tech-index bullish bias.
📌 NASDAQ:QQQ (Invesco NASDAQ-100 ETF)
The main sentiment gauge.
If QQQ remains above its trend structure, AMZN's bullish continuation gets stronger confirmation.
📌 NASDAQ:TSLA (Tesla Inc.)
Not directly correlated, but impacts NASDAQ volatility dynamics.
High volatility in TSLA often ripples into liquidity behavior across the index.
💬 Final Thoughts
This AMZN setup blends structure, momentum, and multi-layer entries, crafted in a fun Thief-style teaching format while keeping everything compliant and research-focused 📚✨
Trade smart, manage risk, escape with profits when the “police” show up 🚓😆📈
✨ “If you find value in my analysis, a 👍 and 🚀 boost is much appreciated — it helps me share more setups with the community!”
⚠️ Disclaimer
This is a Thief-style trading strategy presented just for fun & educational purposes only.
Not financial advice. Do your own analysis and manage risk responsibly.
#AMZN #Amazon #SwingTrade #NASDAQ #BullishSetup #PullbackStrategy #HeikinAshi #TriangularMovingAverage #ThiefStrategy #LayeringEntries #TradingEducation #StockMarket #MarketAnalysis #TradingViewCommunity #EditorPickReady 🚀
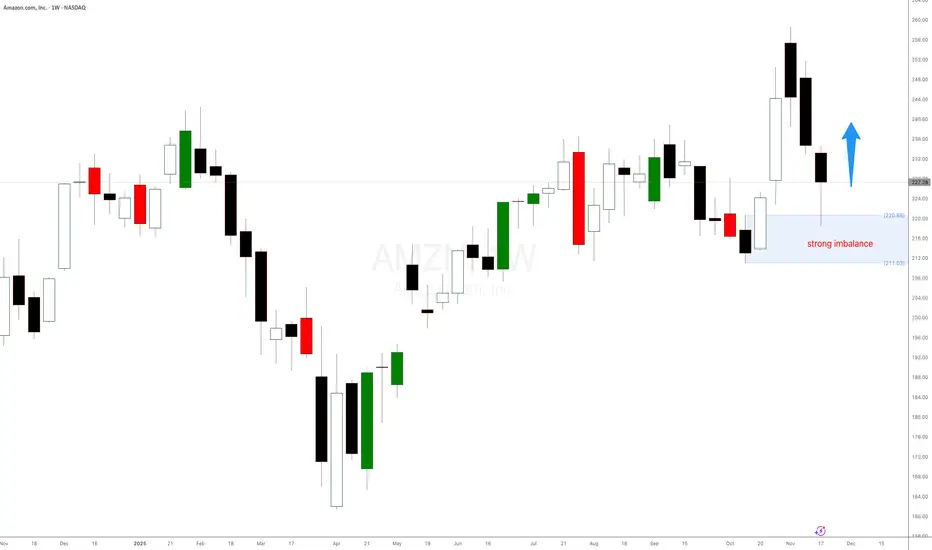
Amazon $AMZN weekly demand level at $221 is holdingAmazon weekly demand level at $221 is holding as expected. Amazon stock is trying to to print a new weekly high. Any long positions should be managed. Waiting for new imbalances and weekly highs.

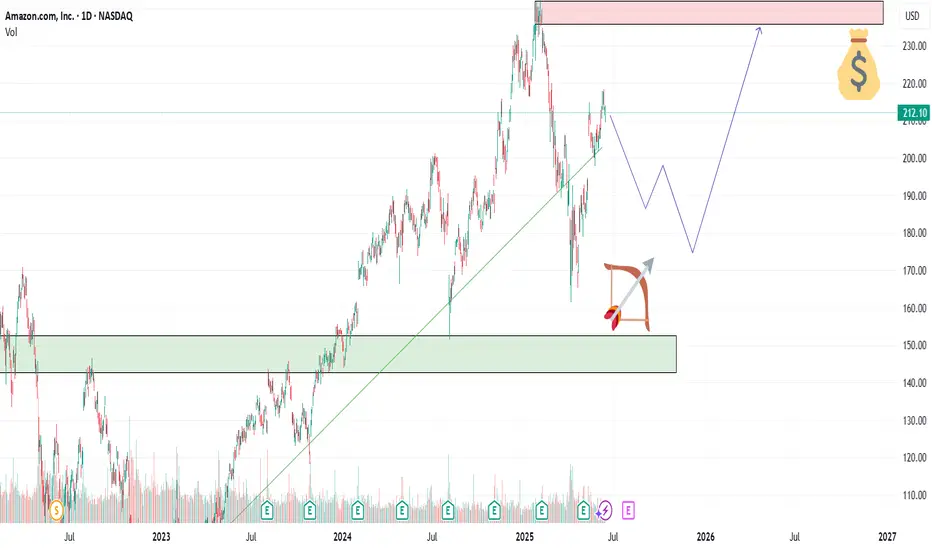
AMZN: Technical Outlook and New Year TargetsNASDAQ:AMZN : Technical Outlook and New Year Targets
Following its recent all-time high (ATH) near $260, Amazon (AMZN) has entered a corrective phase, currently trading around the $230 level.
This retracement raises two key questions for the coming months: how deep will this pullback go, and what are the primary targets for investors heading into 2026?
Technical Analysis and Key Levels.
The current price action suggests a healthy cooling-off period after a significant rally. From a technical perspective, there are two primary scenarios to monitor:
Scenario A:
Retest of the Ascending Trendline The stock may continue its gradual descent toward the primary ascending trendline. This support zone, located approximately between $220 and $223, represents a high-confluence area where long-term buying pressure has historically resumed.
Scenario B: Immediate Support Defense Alternatively, the bulls may defend the current $230 psychological level. If buyers show strength here, it would indicate a shallow correction before a move back toward previous highs.
Strategy and Risk Management.
For those looking to build or add to a position, the $220 – $223 zone offers a compelling risk-to-reward ratio.
Upside Targets:
The initial objective remains a retest of the $260 ATH. If momentum continues, the next major psychological extension sits at $300.
Risk Mitigation:
While this analysis focuses on a mid-to-long-term horizon, active traders might consider the $200 zone as a critical area for a stop-loss, as a break below this level could invalidate the current bullish structure.
Disclaimer
This analysis is for educational and informational purposes only and does not constitute financial or investment advice. Trading involves significant risk, and you should consult with a professional advisor before making any financial decisions.

Amazon stock weekly demand is still in controlAmazon stock weekly demand at $221 is still in control and is trying to play out as expected. Any long positions should be managed. Let's see if there any new bullish legs printed in the following days.

Is Amazon exploding again? New weekly demand in controlIs Amazon exploding again? New weekly demand in control at $224. Expecting a decent rally from here in the following days.
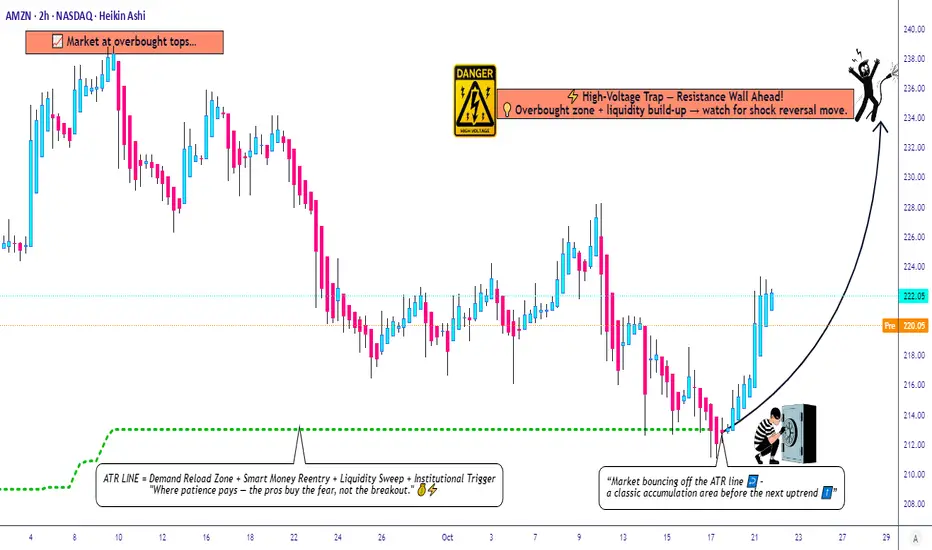
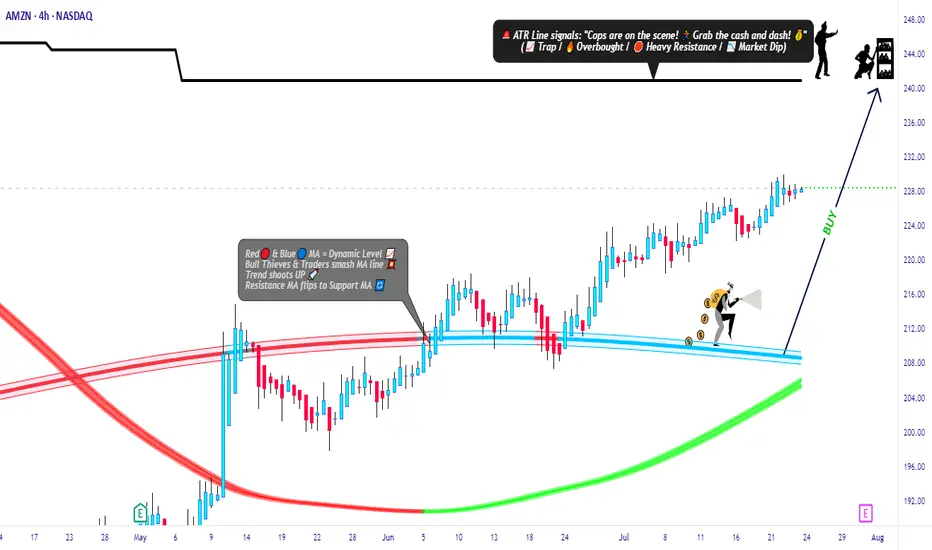
Amazon’s Hidden Pullback Opportunity – Smart Risk, Smart Entry🎯 AMZN: The "Thief's Playbook" — Stealing Profits Like a Wall Street Ninja
📊 Asset Overview
AMAZON.COM INC (NASDAQ: AMZN) — The E-Commerce Titan & Cloud King 👑
Strategy Type: Swing/Day Trade — Bullish Pullback Setup
Confirmation Tool: ATR (Average True Range) ✅
🎭 The "Thief Strategy" Explained
Listen up, Thief OG's! 🦹♂️ This ain't your grandma's single-entry trade. We're using layered limit orders — think of it like setting multiple traps to catch money at different price levels. Professional? Yes. Legal? Absolutely. Stylish? You bet! 😎
🔥 Entry Zones — The Multi-Layer Trap
The Thief's Ladder Entry Method:
You've got options, trader! Pick your poison:
Option 1: Aggressive Single Entry
Jump in at current market price (~$220-$225 zone)
Option 2: The Layered "Thief" Method 🎯
Set multiple buy limit orders to scale in:
Layer 1: $220
Layer 2: $218
Layer 3: $216
Layer 4: $214
Why layer? Because markets don't move in straight lines, baby! This lets you average down if price dips while maintaining a solid risk profile. Add more layers based on your risk appetite! 🍰
🛑 Stop Loss — Protecting Your Loot
Thief's Emergency Exit: $210 🚨
⚠️ IMPORTANT DISCLAIMER:
Dear Ladies & Gentlemen (my fellow Thief OG's), I'm NOT telling you to blindly follow my stop loss. This is MY risk management. YOU manage YOUR money. Trade at your own risk — this is entertainment with charts, not financial advice! 🎲
🎯 Target Zone — Where We Cash Out
⚡ High-Voltage Trap Alert — Resistance Wall Ahead! ⚡
Target Price: $235 🎯💵
Why this target?
💡 This zone shows classic signs of:
Strong resistance from previous price action 🧱
Overbought conditions brewing (RSI warming up) 📈
Liquidity build-up (big money sitting here) 💰
Potential "bull trap" zone → smart money escapes here! 🪤
My advice? When price hits $235, secure your profits! Don't get greedy.
⚠️ ANOTHER DISCLAIMER:
Dear Thief OG's, this is MY target based on MY analysis. You do YOU. Take profits when YOU feel comfortable. Your money, your rules, your risk! 💪
🔗 Related Assets to Watch
Keep an eye on these correlated movers — they can give you early signals for AMZN's direction:
📦 E-Commerce & Tech Giants:
NASDAQ:TSLA (Tesla) — Tech sentiment leader; when tech rallies, AMZN often follows 🚗⚡
NASDAQ:MSFT (Microsoft) — Cloud competitor (Azure vs AWS); inverse correlation sometimes kicks in ☁️
NASDAQ:GOOGL (Alphabet) — Ad spending indicator; strong Google ads = strong consumer spending = bullish for AMZN 🔍
NYSE:WMT (Walmart) — Retail competitor; if WMT struggles, AMZN often benefits 🛒
📊 Market Indices:
NASDAQ:QQQ (Nasdaq 100 ETF) — AMZN is heavily weighted here; QQQ direction = AMZN direction 📉📈
AMEX:SPY (S&P 500 ETF) — Overall market health check; risk-on = AMZN rallies 🇺🇸
💵 Market Sentiment Indicators:
TVC:VIX (Volatility Index) — Low VIX = calm markets = bullish for growth stocks like AMZN 😌
TVC:DXY (US Dollar Index) — Weak dollar = bullish for mega-cap tech stocks 💵📉
The Correlation Play: If you see NASDAQ:QQQ breaking higher + TVC:VIX dropping + tech stocks rallying → high probability AMZN follows the party! 🎉
🧠 Key Technical Points
✅ ATR Confirmation: Volatility is in the "sweet spot" — not too choppy, not too sleepy
✅ Pullback Structure: Classic bullish retracement setting up
✅ Risk-Reward: Solid 2:1+ ratio with layered entries
✅ Volume Profile: Watching for confirmation on breakout
⚠️ Legal Disclaimer — Read This Twice! 📢
THIS IS THE "THIEF STYLE" TRADING STRATEGY — JUST FOR FUN & EDUCATIONAL ENTERTAINMENT! 🎭
I am NOT a financial advisor. This is NOT financial advice. This is a trading idea based on technical analysis, shared for educational and entertainment purposes only.
❌ Do NOT risk money you can't afford to lose
❌ Do NOT trade based solely on this idea
❌ Do your own research (DYOR)
❌ Past performance ≠ future results
✅ Trade responsibly and manage your risk
You are 100% responsible for your own trading decisions. I'm just a chart nerd sharing ideas with the community! 🤓📊
💬 Final Thoughts from Your Friendly Neighborhood Chart Thief
Markets are a game of patience, discipline, and calculated risks. The "Thief Strategy" is about being strategic, not reckless. Set your traps, manage your risk, and let the market come to you! 🕸️💰
Stay sharp, stay profitable, and remember: the best trades are the ones you plan, not the ones you chase! 🏃♂️💨
✨ If you find value in my analysis, a 👍 and 🚀 boost is much appreciated — it helps me share more setups with the community!
#AMZN #Amazon #StockMarket #SwingTrading #DayTrading #TechnicalAnalysis #BullishSetup #LayeredEntry #ThiefStrategy #TradingIdeas #ATR #ResistanceZone #TakeProfit #RiskManagement #NASDAQ #TechStocks #PullbackTrading #PriceAction #SupportAndResistance #TradeSmart
Trade safe, trade smart, and let's get this bread! 🍞💸
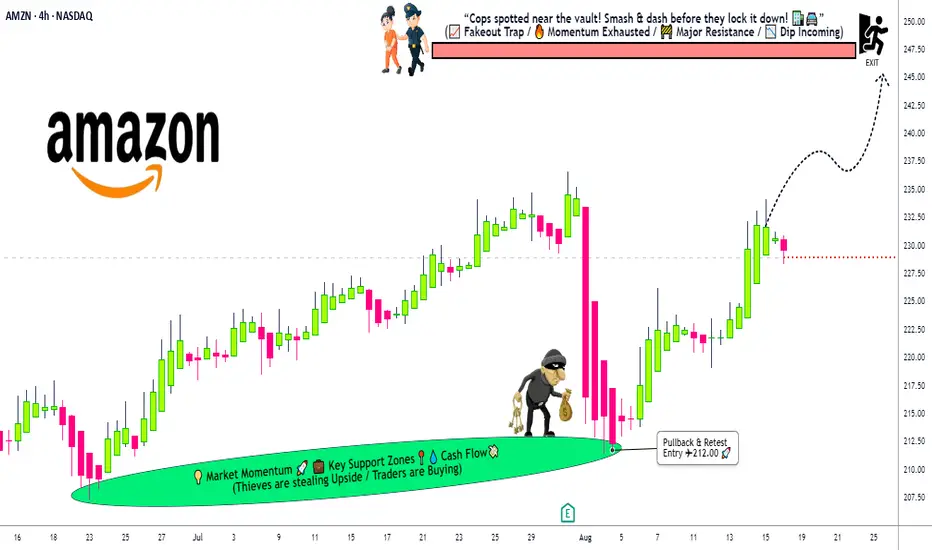
AMZN Bullish Breakout: Retest Above 238 Toward 255–265AMZN just cleared a four-month rectangle (214–238) with a decisive late-October surge, shifting the daily trend back to bullish. Price now rides above the 20/60/120-day MAs with expanded volatility—classic post-breakout behavior. The former lid at 238 flips to support, while the next clear shelf sits near the psychological 255.
Primary path: look for a constructive pullback into 238–242 to validate the breakout. A daily close above 242, a 1H close >248, or a continuation break through 250.50 can serve as triggers. If buyers defend 238 on the retest, the path of least resistance favors a push into 252–254, then the measured round-number objective at 255, with extension toward 265 if momentum persists and volume stays supportive.
If 238 fails on a decisive close, treat it as a false break and expect rotation back into the prior range, with 230 as the magnet. Invalidation for the bullish idea sits on a firm daily close back below 238; conservative risk placement can sit around 235–236 to protect against a failed retest.
This is a study, not financial advice. Manage risk and invalidations

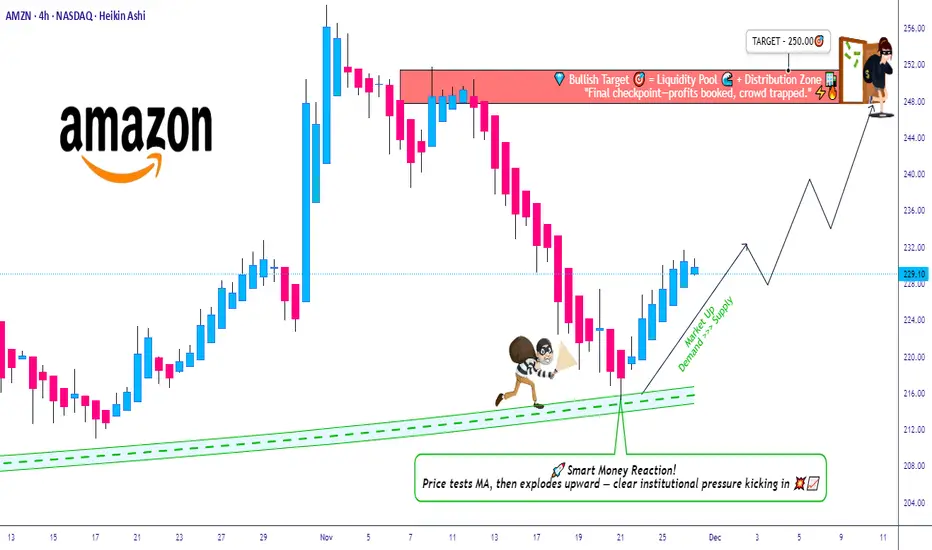
Amazon Stock Heist: Thieves Targeting 247 Escape Point🔐💰 AMAZON HEIST PLAN – STOCK MARKET ROBBERY STYLE 🚀📈
👋 Hey Thief OG’s, Money Grabbers & Market Shadows!
Today’s mission is inside the vault of Amazon.com Inc. (AMZN) – and we’re planning a Bullish Heist.
🎯 ENTRY – Layering the Break-In 💎
The vault doors are always open for the thief gang!
Place multiple Buy Limit Orders (layer entries) at 🏦:
230.00 / 227.00 / 225.00 / 222.00
You can add more layers to your heist plan based on your own risk appetite.
Thief strategy = stack the entries, wait for the pullback, strike big.
🛑 STOP LOSS – Thief Escape Route 🚔
This is the official Thief SL: @219.00.
But remember OG’s – adjust your SL based on your own strategy & bag size.
We don’t all run with the same loot.
🎯 TARGET – Police Barricade 🚨
Before the sirens ring, our escape bag is ready at @247.00.
That’s where we dump the loot and vanish into the shadows. 🏃💨💼
🕵️♂️ THIEF STYLE STRATEGY
✅ Layering entry method (multiple buy limits = thief stacking plan).
✅ Risk management = key to survival.
✅ Exit before the market police catches you.
💥 Remember OG’s: This is not financial advice – this is a robbery simulation in the stock market.
Support the gang 👉 Smash the Boost Button 💥 so our heist team gets stronger!
🤑💼💰 Every day, every chart, every loot = Thief Trader Style.
Stay sharp. Stay hidden. Stay profitable.
I am buying AMAZONI am buying AMAZON
Amazon's stock lost over 10% last week, marking a significant decline within just one week.
I will start buying using dollar cost averaging (DCA) with $240 as my long-term to mid-term target.
I will hold
Please like, share, comment and follow.
I look forward to connecting with you

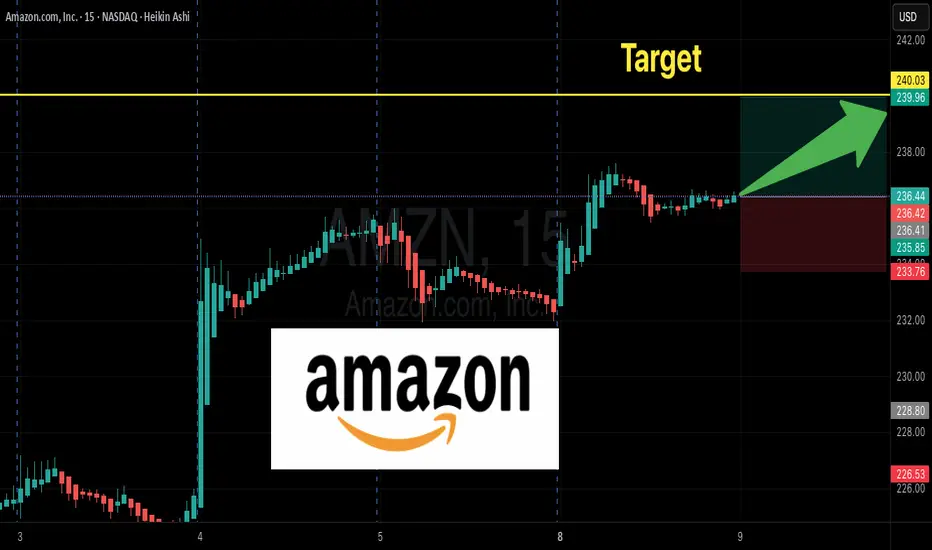
AMZN $240 Weekly Call — Tactical Play for Quick Gains
🚀 **AMZN Weekly Options Alert — \$240 Call Could Double in 4 Days!**
**Directional View:** **Strong-to-Moderate Bullish** 💹
**Confidence:** 75%
**Trade Setup:**
* **Instrument:** AMZN
* **Strategy:** BUY CALL (single-leg)
* **Strike:** \$240
* **Expiry:** 2025-09-12 (4 DTE)
* **Entry Price:** \$0.68 (ask at open)
* **Size:** 1 contract
**Targets & Risk:**
* **Profit Target:** \$1.36 (100% gain)
* **Partial Profit:** \$1.02 (50% gain)
* **Stop Loss:** \$0.34 (50% of premium)
* **Exit Rule:** Close everything by Thursday 15:30 ET to avoid gamma/theta risk
**Why This Trade?**
✅ Weekly RSI rising (71.5) + expanding weekly volume (1.3x) → bullish momentum
✅ Strong call skew (C/P 1.99) → institutional positioning
✅ Low VIX (\~15.2) → cheaper premiums, directional edge
✅ Strike \$240 slightly OTM with **high liquidity** (OI 24,202)
**Key Risks:**
⚠️ Falling daily RSI (59.9) → short-term consolidation possible
⚠️ 4-DTE weekly → high gamma/theta; strict stop mandatory
⚠️ Unexpected news or sector moves could spike IV or widen spreads
⚠️ High OI may create pinning behavior near \$240
**Quick Takeaway:**
* Tactical **short-term bullish weekly trade**
* Exploits **momentum + options flow + liquidity**
* Strict **risk management**: stop at 50% and exit by Thursday
* Partial profits at 50%, full target at 100% gain
---
📊 **TRADE DETAILS (JSON)**
```json
{
"instrument": "AMZN",
"direction": "call",
"strike": 240.0,
"expiry": "2025-09-12",
"confidence": 0.75,
"profit_target": 1.36,
"stop_loss": 0.34,
"size": 1,
"entry_price": 0.68,
"entry_timing": "open",
"signal_publish_time": "2025-09-08 10:11:13 UTC-04:00"
}
```
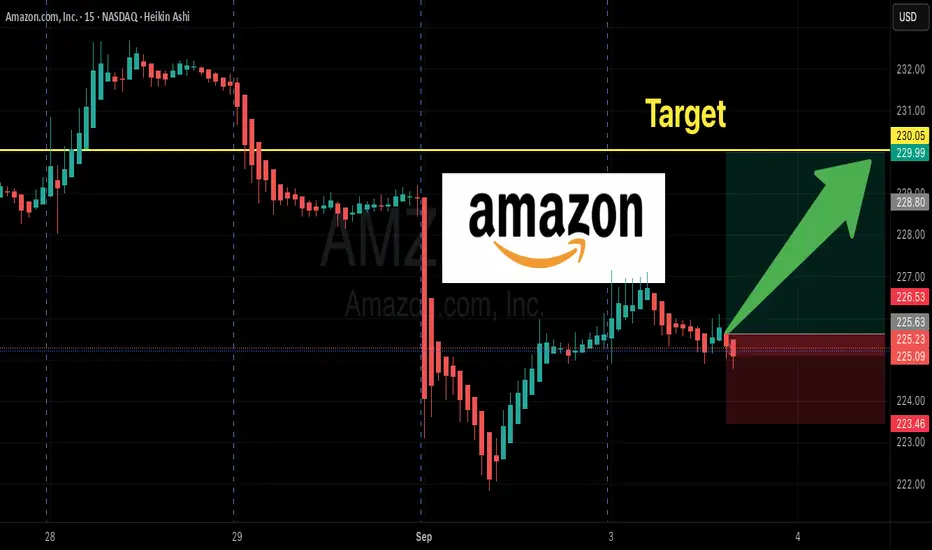
AMZN Options Flow Explodes! $230 Call Trade Idea”
# 🚀 AMZN Weekly Options Trade Idea (2025-09-03)
### 📊 Market Recap
* **Daily RSI**: 47.9 ⬇️ (bearish tilt)
* **Weekly RSI**: 57.1 ⬇️ (losing momentum)
* **Volume**: 0.9x 📉 (weak vs prior week)
* **Options Flow**: 💎 Strongly bullish (C/P = 3.30)
* **VIX**: ✅ Favorable (16–17)
👉 **Models Split:**
* 🐻 DeepSeek → \$225 PUT idea (bearish).
* 🐂 Grok + Llama → \$230 CALL (moderate bullish).
* ⚖️ Gemini + Claude → **NO TRADE** (risk > reward).
---
### ✅ Consensus Trade Setup (Flow-Weighted Lean)
```json
{
"instrument": "AMZN",
"direction": "call",
"strike": 230.0,
"expiry": "2025-09-05",
"entry_price": 0.43,
"profit_target": 0.86,
"stop_loss": 0.26,
"size": 1,
"confidence": 0.62,
"entry_timing": "open"
}
```
---
### 🎯 Trade Plan
* 📌 **Strike**: \$230 CALL (Sep 5)
* 💵 **Entry**: 0.43 (ask @ open)
* 🎯 **Target**: 0.86 (+100%)
* 🛑 **Stop**: 0.26 (–40%)
* ⏰ **Max Hold**: Exit by Thu EOD (avoid Fri gamma risk)
* ⚖️ **Size**: 1 contract (small, <2% equity)
* 📈 **Confidence**: 62% (flow-driven edge, weak technicals)
---
⚠️ **Risks**
* Daily + weekly RSI trending down = 🐻 momentum risk
* Weak institutional volume confirmation 📉
* Heavy call flow could be **retail noise / covered calls** 😬
* 2 DTE → **theta burn + gamma whip risk** ⚡
---
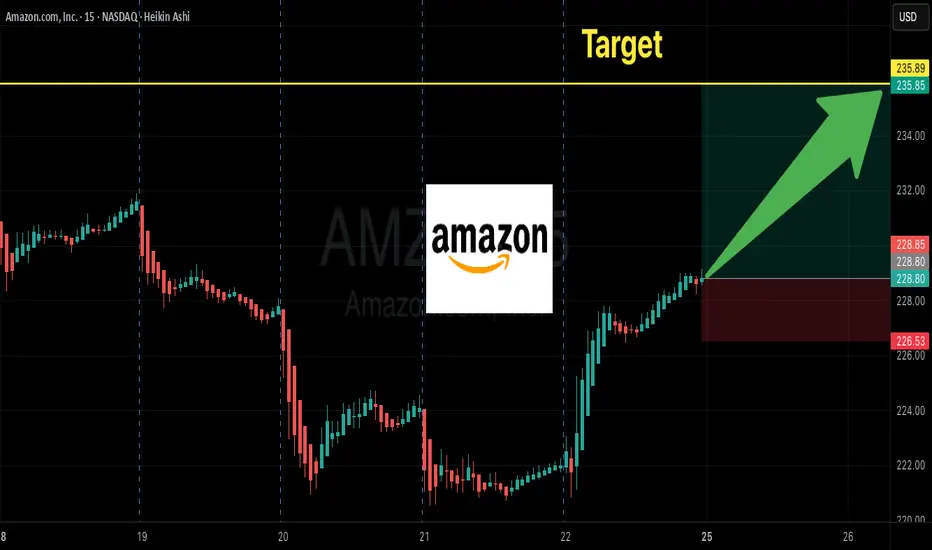
AMZN Swing Trade Setup | $235C Targeting 100%+ This Week# 🔥 AMZN Weekly Options Setup (Aug 29 Expiry) 🚀📈
📊 **Consensus from Multi-Model Analysis**
* ✅ Daily RSI rising (Bullish)
* ⚖️ Weekly RSI falling (Neutral)
* 🏦 Institutional Flow: **Strong Call Skew (C/P 3.61)**
* 📉 Volume: Contracting (risk flag)
* 📉 VIX: Low → Favors Call Buying
---
## 📌 Trade Setup
🎯 **Instrument**: AMZN Weekly Call
💵 **Strike**: \$235
📅 **Expiry**: 2025-08-29
💰 **Entry**: \$0.82 (open)
🛑 **Stop Loss**: \$0.41 (-50%)
🎯 **Target 1**: \$1.07 (+30%)
🎯 **Target 2**: \$1.64 (+100%)
📏 **Size**: 1 Contract (risk ≤3%)
⏰ **Hold Window**: Mon → Thu (Exit before Friday Gamma)
📈 **Confidence**: 66%
---
## 🚨 Key Risks
⚠️ Low weekly volume = weak follow-through risk
⚠️ Theta burn accelerates after Wed → exit by Thu
⚠️ VIX spike (>18) = invalidate setup
---
## 🧾 Quick Trade Card
* **Bias**: Moderate Weekly Bullish
* **Edge**: Institutional call flow + Daily RSI momentum
* **Caveat**: Weak weekly volume, fading RSI
---
### 🚀 Viral Hashtags
\#AMZN #OptionsTrading #SwingTrade #UnusualOptionsActivity #StocksToWatch #TradingSetup
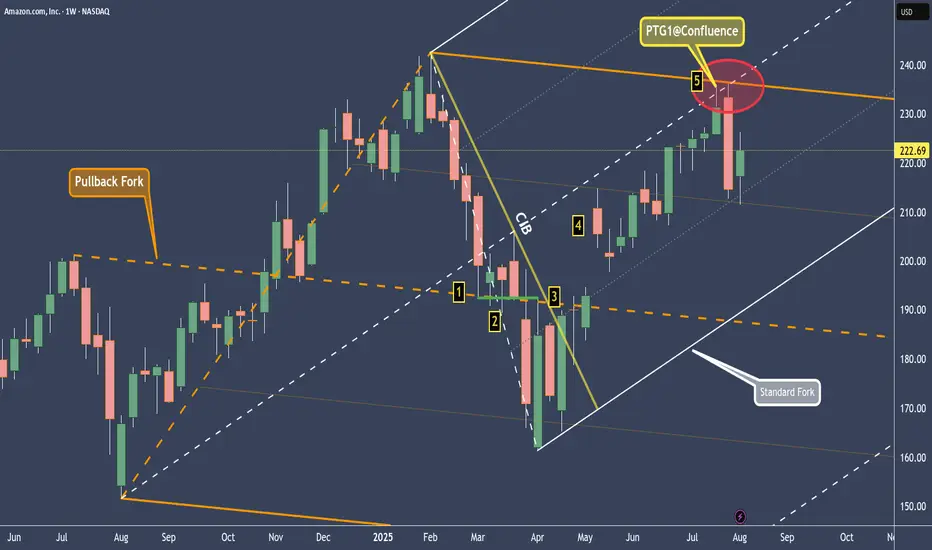
AMZN - Amazon Hit The 80% profit Target. Trend change ahead?On this chart we have 2 forks.
Orange: the pullback fork
It shows us where the equilibrium is — at the centerline, which the market respected to the tick (1).
After that, there were several bars that formed support (2).
When the CIB line was broken (3), the market gapped above the orange centerline and made its way up to the white centerline (5), the target that we can expect in around 80% of all cases.
Note the confluence point where the centerline of the white fork and the upper median line parallel (U-MLH) of the orange fork meet.
A day later, we saw a sharp sell-off within just one bar! Is this now another trend reversal?
No, clearly not.
For a trend reversal to occur, the market would have to break the white L-MLH (lower median line parallel). As long as the market is trading within the white fork, we remain long.
I’ll make a YT video soon, covering the details.
Wishing you all a successful new trading week.
Amazon Market Robbery Blueprint – Swing/Scalp Long Setup🟨💣 “AMZN Market Heist Blueprint – Bullish Robbery in Progress 🚨💼💸” 💣🟨
By Thief Trader – Rob the Market with Precision
🌍 Hello World! Hi, Hola, Ola, Bonjour, Hallo, Marhaba!
🤑💰 Calling all Money Makers & Market Robbers – get ready to execute the next bullish heist on AMAZON.COM, INC (NASDAQ: AMZN), powered by our signature Thief Trading Style™ – where technical precision meets psychological warfare.
🔥 Plan Summary:
Based on our fundamental & technical intel, we’re eyeing a long entry into AMZN. The target? 💥The High-Risk ATR Police Barricade Zone – a zone flooded with liquidity, overbought conditions, fakeouts, and bear traps. It's where most traders get caught – but we walk in with a blueprint.
🟩 Entry Zone – “The Vault Is Wide Open!” 💼📈
🕰 Entry timeframe: 15min / 30min (preferably after confirmation or rejection wick)
💵 Buy Limit Orders: Place multiple layered entries (DCA-style) near recent swing lows/highs. Wait for breakout confirmation; no blind orders before breakout!
Thief Note: This isn’t spray-and-pray – this is sniper-mode. Scope, place, execute.🎯
🛑 Stop Loss – “SL is the Escape Route!”
📍 SL below recent 4H candle wick swing low (around 219.00 – adjust based on your risk/margin size).
Important: Only place SL after breakout; not before. Risk per order must match your lot strategy.
🎯 Target – “Grab the Bag or Escape Before the Alarms!”
💸 Target Zone: 240.00
🧠 Smart robbers know when to bail early – use a trailing SL to lock gains. Exit before reversal or heavy volume shift.
👀 Scalper Alert – “Only One Way – LONG!”
If you’re a quick thief with a fat bag, hit-and-run with a Long scalp. If you’re running lean, swing with the crew. Watch the PA and news timing. Trailing SL = insurance policy.
📊 Why Bullish? Here’s the Background:
🔍 Macro Drivers
💼 COT Report
🌍 Geo-political Influences
🧠 Sentiment Score
📈 Index Correlation
🔮 Intermarket Signals
💹 Institutional Positioning
All lights flashing green for short-to-midterm bullishness, but keep checking real-time updates.
⚠️ Risk Alert – News Triggers Can Blow Your Cover 🚨
🗞 Avoid trading near major news releases – they cause volatility spikes.
🧲 Always protect gains with trailing stops and don’t over-leverage your ammo.
💖 Support the Robbery – Hit BOOST 🔥
Smash that 💥BOOST💥 button if you ride with the Thief Trading Crew!
Let’s build this into the #1 robbery squad on TradingView.
Make money. Protect profits. Trade like a bandit – with a plan. 💼📈🏆
🔔 Stay Tuned for the Next Robbery Mission 🔔
Another heist plan dropping soon. Until then, rob smart, rob safe, and rob rich.
– Thief Trader™ | Rob The Market. Not Your Wallet.
AMZN AMZN Bullish Setup --Don’t Miss Out🚀 AMZN Weekly Call Play — Riding the Bullish Flow**
Amazon (AMZN) shows strong institutional bullish flow with a **Call/Put ratio of 2.09**, backed by favorable RSI trends and low volatility conditions. While volume is weaker than last week, momentum and options flow point toward upside potential into next week.
**🛠 Trade Setup:**
* **Instrument:** AMZN
* **Direction:** CALL (LONG)
* **Strike:** \$230.00
* **Expiry:** 2025-08-15
* **Entry Price:** \$0.63
* **Profit Target:** \$1.26 (100% gain)
* **Stop Loss:** \$0.38
* **Size:** 1 contract
* **Entry Timing:** Market open
* **Confidence:** 65%
**📊 Key Factors:**
* Call/Put ratio: **2.09** — strong bullish options flow
* Daily RSI: 49.0, Weekly RSI: 58.3 — uptrend confirmation
* Low VIX (\~15.88) — supportive for directional plays
* Potential resistance at \$226–\$230
**⚠ Risks:**
* Weak weekly volume (0.8x prior week) may reduce conviction
* Broader market weakness could cap gains
---
**#AMZN #OptionsTrading #CallOptions #WeeklyOptions #BullishSetup #TechnicalAnalysis #TradingView #OptionsFlow #LowVIX #SwingTrade #MarketMomentum**

AMZN Earnings Play — July 30 (AMC)
## 🚀 AMZN Earnings Play — July 30 (AMC)
**💵 High Conviction Call Trade | 85% Confidence**
📈 **Amazon (AMZN)** — Cloud + Consumer Power Combo
🧠 Setup driven by earnings momentum, bullish flow, and macro strength.
---
### 🔍 FUNDAMENTALS SNAPSHOT
✅ **Revenue Growth**: +8.6% TTM
✅ **Margins**: Profit 10.1%, Op 11.8%, Gross 49.2%
🎯 **EPS Beat Streak**: 8/8 with avg. surprise of +34.7%
🔮 **Consensus Target**: \$252.03 (+9.4% upside)
📌 AWS + AI + Cost control = 🔥 upside setup
🟢 **Score: 9/10**
---
### 📊 OPTIONS FLOW SIGNAL
💰 **High OI**: \$232.50, \$240, \$247.50 calls
📈 **Call/Put Ratio**: Bullish Skew
🛡️ **Put Hedging** ≠ Bearishness
📉 Expected Move: \~5%
⚖️ **Gamma Bias**: Bullish above \$240
🟢 **Score: 8/10**
---
### 📉 TECHNICAL SETUP
📍 Price: \$231.01
📈 20D MA: \$226.21 (Support)
📉 RSI: 66.71 (momentum building)
🔒 Resistance: \$242.52 (watch for breakout)
🟢 **Score: 8/10**
---
### 🌐 MACRO TAILWINDS
🧠 AI & Cloud Momentum 🚀
💹 Consumer spending rebound
🔧 Regulatory risk mitigated via diversification
🟢 **Score: 8/10**
---
## 🎯 TRADE IDEA
🟩 **AMZN 08/01 \$247.50 Call**
💸 Entry: \$0.86
🎯 Target: \$2.58 (200%)
🛑 Stop: \$0.43 (50% loss)
⏰ Entry: **July 30 — Pre-close**
📏 Max Risk: \$86
💰 Max Reward: \$258
🧠 IV Crush Defense: Exit 2H post-ER
---
## ⚡️ WHY THIS WORKS
✅ 8-straight beat streak
✅ Fundamentals + Technicals = aligned
✅ Flow + Macro confirm direction
📈 Setup = asymmetrical upside
---
🎯 Tag your earnings sniper crew
📈 #AMZN #EarningsTrade #OptionsFlow #AmazonStock #CloudAI #OptionsStrategy #EarningsPlays #TradingView #SwingTrade #CallOptions #VolatilityTrade #EarningsMomentum

AmazonAmazon needs small correction and further push up towards 235 level.
Disclosure: We are part of Trade Nation's Influencer program and receive a monthly fee for using their TradingView charts in our analysis.
AMZN — Accumulation Zone or Just a Healthy Pullback?📦Amazon (AMZN) is offering an interesting opportunity after a healthy correction from its 2025 highs. With continued AWS expansion and aggressive investment in AI infrastructure, the fundamentals remain solid — but short-term volatility opens the door for strategic entries.
🎯 Entry Points
🔹 $194 – First key support, ideal for early buyers
🔹 $187 – Strong technical congestion zone
🔹 $169 – Deep value zone with higher risk/reward potential
💰 Profit Targets
✅ TP1: $210 – First resistance and psychological level
✅ TP2: $227 – Last swing high area
✅ TP3: $241+ – Full recovery path if momentum holds
🧠 Strategy Insight
This setup suits a swing trade horizon (30–60 days). Scaling into the position and adjusting stops under $160 offers a risk-managed approach. The upcoming earnings on July 31, 2025 could be the trigger for a major move — watch AWS growth numbers and forward guidance closely.
⚠️ Disclaimer: This analysis is for educational purposes only. It is not financial advice. Always do your own research and manage risk accordingly.
AMZN: A Power Move for the Smart Trader | The Rebound Play?🚀 AMZN 2025 Trade Plan
After an early 2025 rally to $240+, Amazon (AMZN) has pulled back sharply to around $167, opening the door to what could be one of the most attractive rebound setups of the year.
With AWS still growing strong and net income nearly doubling in 2024, the fundamentals are on Amazon’s side. Add to that bullish analyst outlooks pointing to $226–$253 this year, and we might just be looking at a golden entry zone.
📌 Entry Points:
Start building a position at $167
Add more if it dips toward $160 or $151 (52-week low)
🎯 Profit Targets for 2025:
First stop: $210
Next: $226
Final push? $240+
This setup blends technical recovery with strong financials and long-term bullish sentiment. Patience, discipline, and solid risk management are key as AMZN finds its footing.
⚠️ Disclaimer: This is not financial advice. All trading involves risk. Always do your own research and consult with a licensed financial advisor before investing.

AMAZONAmazon has a great potential to head up towards 230 level.
Disclosure: We are part of Trade Nation's Influencer program and receive a monthly fee for using their TradingView charts in our analysis.
