High Expectation for the #AdobeHigh Expectation for the Adobe if the price break the 348.2 will up to 355.19
Analisis

My Expectation For the #ZL1For ZL1! My Expectation is going up cuz the price respect the ORANGE level also if the price beak the 25.65 this will confirm this expectation

My Expectation For #EURUSD So sorry i don't share anything today im with my team work in new strategy and should be more then great to make sure its good and give wonderful result


AUD/USD 4H chart.my view on AUDUSD, if you are going to take the short,wait for solid confirmation ( see details on chart).
for longs i marked previous broken resistance acting now as important support
exit levels near major resistance area.

BTC sigue cayendoCon un monitor que tiene un valle en punto cero con tendencia bajista, el ADX indica algo de fuerza en el movimiento y las medias moviles cada vez más cercanas, aquí está el rebote a la baja.


GBPUSD (Compra si rompe estructura)Me encantaría que este precio rompiera la estructura bajista que actualmente tiene, si esto pasaría tendría la alta posibilidad de un fuerte movimiento a la alza.. de todas formas es recomendable hacer las entradas en una temporalidad menor basándose en su propio sentimiento de trading.

USDJPY (15min chart)Este par en 15min me esta haciendo un patrón que me gusta, y se repite siempre mas y mas, después de una fuerte caída en esta temporalidad y después de analizar la temporalidad mayor DIARIA, me encantaría un rompimiento de estructura para luego buscar mi entrada en largo, claramente me encantaría que hiciera este movimiento, pero otras cosas pueden pasar también.

USDJPY VENTA(D Chart)
Después de un fuerte rompimiento de estructura y del punto bajo mas alto del USDJPY es solo de esperar a una buena zona de entrada para después de nuestras confirmaciones entrar corto, es recomendable buscar la entrada en una temporalidad pequeña como en 15min-1hora..

EURUSD D Chart a Venta (Buscar Entrada en temporalidad pequeña)Después de una fuerte subida y una ganancia de 300+ Pips. En una temporalidad diaria el precio me ha llegado a una excelente punto de retroceso de Fibonacci, el cual confluye en diferentes puntos para entrar en corto,
claramente es una temporalidad grande, y seria inteligente buscar la entrada en una temporalidad pequeña después de un cambio de estructura en caso que seas swintrader..

Caida del USD contra el ZARAl parecer segun la subida que tuvo el USD ante el ZAR este puede estar recuperando por un alto importante que acaba de tocar , al parecer podemos esperar que agarre fuerza hacia la baja para seguir subiendo en una temporalidad mas macro.

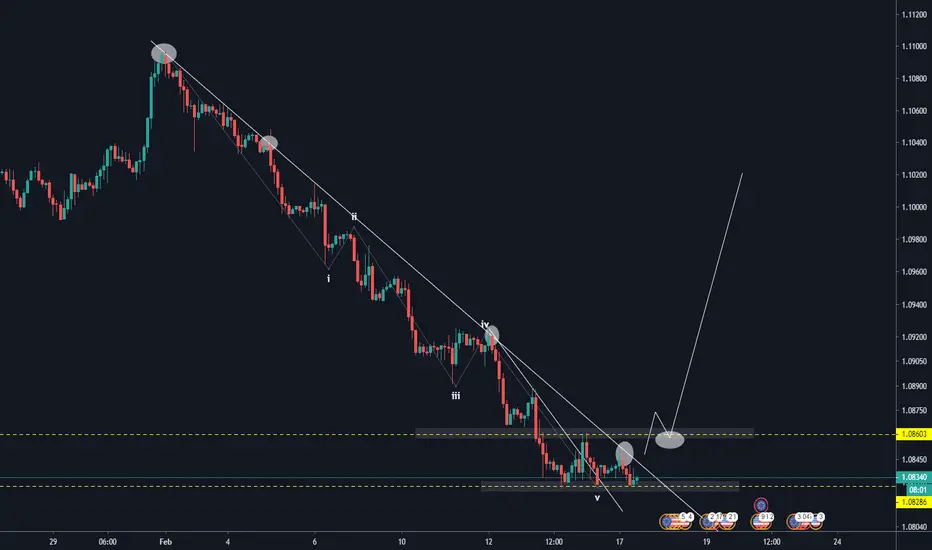
Preparados a Re-entrada a Compra!Después de una fuerte caída, completando así 5 ondas de Elliot, después de un rompimiento de estructura yo hice mi entrada a compra en una temporalidad de 15min para poder tomar la mayor parte del movimiento, y estoy atento a una re-entrada a compra en el área señalada en caso que tengas todas mis confirmaciones

EURUSDEste par me hizo un ligero rompimiento de linea de tendecia, para los arriesgados seria buena entrada, para los conservadores podrian esperar que salga bien de la consolidacion el cual se encuentra el precio actualmente y despues de un retroceso entrar largo, de todas formas siempre es buenos hacer sus propios analisis basado en su sistema de trading.
#Exitoforex2020

BTCUSDT. Correction or trend change?Good afternoon, dear traders! After yesterday's lateral movement with a slight increase, the bears showed strength and pushed the price to the next level of resistance. The situation at the moment is ambiguous. Most likely we will continue lateral movement in the corridor of $ 9500-9600. I advise you to refrain from trading at the moment. It is too early to talk about a trend change, however, if we break through the next support ($ 9100-9150), we can already think about it.

Esperando Retroceso A,B,C EURUSDEste Par ha tenido una fuerte caida completando asi desde mi punto de vista 5 ondas de Elliot, y retestear un fuerte piso, queriendo asi quizas no seguir bajando, a mi personalmente me encantaria un rompimiento de estructura, para luego despues de un retroceso, entrar largo, desde mni perpectiva no es recomendado entrar largo hasta que no rompa la estructura bajista.
BTCUSDAfter the previous correction, bitcoin dropped to the level of 9600, which confirmed its uptrend. Because last time, the fall was to the level of 9450. I am assuming that after a slight lateral movement with a possible correction, we will continue the uptrend.

EURCADActualmente, observando desde Monthly, podemos ver como el precio está cerca de nuestra weekly en 1.4500, aunque el precio puede estar entrando en un cuadrado, aunque de momento nos está haciendo un triple bottom con lo que, aún no lo confirmamos. Si avanzamos hasta Daily, encontramos un triángulo simétrico, al empezar a tirar fibo podemos ver como el punto A y B ya se han creado, actualmente se está creando el C, el cual podría hacerlo aún dentro de nuestro triángulo para posteriormente romper la estructura y caer, en Daily vemos aún más claro el triple bottom que hemos observado anteriormente.
En 4 horas, vemos como nos ha hecho un P3 en la tendéncia mensual y posteriormente ha caído sin un claro retesteo aún, con lo que podría volver para hacerlo, cosa que coincidiría con nuestro 61% en el fibo diario aunque rompería nuestro fibo de 4 horas. En caso de que volviera a hacer el retesteo para caer, después de la confirmación entraríamos en cortos esperando así una D1+ rompimiento del triángulo simétrico + rompimiento del rango.
Conclusión: tiene que subir un poco más para luego bajar.

btc great longIn this analysis, support and resistance lines as well as Rsi power forecasts are considered.

https://www.tradingview.com/chart/ee0NZBCP/ZONA EN D1 Y H4 MUY RESISTENTE PATRON DE VELAS EN H1 Y H4 PODEMOS VER UN DXY BAJISTA POR LO CUAL NOS CONFIRMARIA UNA VENTA EN EL PAR

BTC ANAlYSES Inability to close the week under 7300$ level tells about possible deep correction of BTC.
We still are inside the downtrend channel, but daily RSI is currently oversold and daily MACD is closing to 0 point from red zone, what give us a chance to try to enter the long position.
First and the most serious resistance zone is around 7800$. If the price is able to break through this level and close under, we considering the possibility of continuing of local upward trend till next resistance around 8800-9000$. Additionally, the behavior of price between 6500-7300 looks like H&S pattern, what proofs our suspicious as for the increasing of the price.
In case of failure to break the 7800$ level, most likely the price will go to test low at 6500$.
Lucky trading and don't forget about risk management!

Will Monero growth before the hard fork?Monero, both technically and fundamentally, looks like a good asset to consider buying it.
.
Fundamentally: A hard fork is expected at the end of November (November 30). Monero is going to activate an update in its blockchain aimed at increasing the privacy of RandomX users (the new Proof of Work algorithm). The transition to the new RandomX algorithm is aimed at solving one of the main problems of this cryptocurrency, namely hidden mining.
.
Technically: After the breakdown of the previously formed resistance level in the region of $ 58 / $ 60, we observe a nice price tightening, which in turn forms the figure of the technical analysis “Rising Triangle”. To all this, on the chart, sometimes increased volumes for purchases pop up. The RSI indicator cools slightly at the moment of preload, which gives freedom for further upward movement.
.
Bottom line: In the aggregate of the positive fundamental component, supported by technical analysis, which also speaks more for the continuation of the upward movement, it is worth taking a closer look at this asset now, but with a short stop order, or go into a true breakdown of the triangle with the first target in the region of $ 70, and the second in the area of $ 75, where the price is more likely to meet resistance from sellers, these levels coincide with the levels of 0.618 and 0.786 Fibonacci. Meanwhile the market depends upon the bitcoin`s movement: if bitcoin goes down sharply, then this triangle can be broken down.
