Bitcoin Bearish Setup Toward 100K TargetBitcoin is trading below a descending trend line, facing resistance near 102,000. Price is testing the support zone around 101,000, with a bearish target set at 100,000 if the support breaks.
Analyse

EUR/USD Bearish Reversal SetupEUR/USD 1-hour chart shows a potential bearish move after a break of structure (BOS). Price is expected to decline from the 1.1529 resistance zone toward the 1.1510 target level.

ElDoradoFx – GOLD ANALYSIS (06/11/2025, LONDON SESSION)
1️⃣ Market Overview
Gold extends its bullish move into the London session after breaking above $3,995–$4,000, confirming short-term momentum shift from consolidation to continuation.
The metal currently trades near $4,005, where sellers are reacting at a key H1 supply zone aligned with a descending trendline from previous highs.
Overall sentiment remains cautiously bullish, with potential pullbacks expected before continuation toward $4,026–$4,046.
⸻
2️⃣ Technical Breakdown
📆 D1 (Daily):
Price sustains above the 100EMA and remains in an ongoing bullish recovery phase.
RSI ≈ 52, showing neutral-to-bullish structure. A confirmed daily close above $4,012 would strengthen the path to $4,026–$4,046 next.
⏰ H1 (Hourly):
Strong breakout candle above $3,995 with MACD turning positive.
Current resistance seen around $4,010–$4,015. RSI near 68 signals slight overextension, hinting that a minor pullback could occur before another push upward.
🕒 15M–5M (Intraday):
Price broke through descending structure and is now forming rejections near $4,010.
Short-term support sits between $3,985–$3,975, coinciding with EMAs and structure demand.
Expect a possible retest of this area for continuation if buyers remain in control.
⸻
3️⃣ Fibonacci Analysis (Last swing $3,960 → $4,010)
• 38.2% = $3,990
• 50.0% = $3,985
• 61.8% = $3,979
🎯 Golden Zone: $3,990 – $3,979 → Potential bullish continuation area.
⸻
4️⃣ Fundamental Watch
• The US Dollar Index (DXY) is holding below 106, favoring gold’s strength.
• US Jobless Claims and Fed speeches later today may inject volatility during the NY session.
• London is likely to trade inside the $3,985–$4,010 band until new catalysts emerge.
⸻
5️⃣ Analyst Summary
Gold maintains an intraday bullish bias while trading above $3,975.
The ideal scenario is a pullback toward $3,990–$3,979 (Golden Zone) before the next impulsive move up.
A sustained break above $4,015 would confirm fresh momentum targeting $4,026 → $4,046, while failure to hold above $3,975 could shift bias back toward $3,960.
⸻
6️⃣ Final Bias Summary
📈 Primary Bias: Bullish continuation above $3,975
📉 Bearish Invalidity: Below $3,970
🎯 Upside Targets: $4,026 → $4,046 → $4,075
⚠️ Key Zone to Watch: $3,990 – $3,979 (Golden Zone retest area)
⸻
— ElDoradoFx PREMIUM 3.0 Team 🚀

EUR/USD Bullish Reversal Toward 1.1510 TargetEUR/USD is trading near 1.1483, holding above the 1.1468 support zone. A bullish move is expected if the pair stays above support, with potential targets at 1.1500 and 1.1510.

ElDoradoFx – XAUUSD (GOLD) (06/11/2025, ASIA SESSION)1️⃣ Market Overview
Gold begins the Asia session around $3,979, showing mild weakness after repeated rejections from the $3,985–$3,990 supply zone. The metal remains trapped within a descending channel formed from the $4,046 swing high, but buyers are still defending the ascending trendline from $3,928.
This setup suggests the market is coiling ahead of a potential breakout, likely during the Asia–London overlap.
⸻
2️⃣ Technical Breakdown
🔹 Daily (D1)
Gold maintains a neutral stance, holding above the 100 EMA ($3,870) but still below the 10 EMA ($3,995).
RSI sits near 49, showing equilibrium between buyers and sellers. A daily close above $3,990 could reignite bullish pressure toward $4,015–$4,046, while a drop under $3,955 would open downside continuation toward $3,930–$3,915.
🔹 1H Chart
The 1H structure remains bearish-to-neutral, with lower highs under the descending trendline. MACD momentum is flattening, while RSI near 46 signals loss of bullish drive.
Intraday support aligns at $3,973–$3,960, with resistance between $3,985–$3,990.
🔹 15M–5M
The short-term structure shows a minor BOS (Break of Structure) below trendline support. Repeated wicks around $3,978–$3,975 indicate growing selling pressure.
MACD turning red and RSI rolling over from 55 confirm the fading momentum before Asia volatility pickup.
⸻
3️⃣ Fibonacci Analysis (Last swing: 3,928 → 3,990)
• 38.2% = 3,966
• 50.0% = 3,959
• 61.8% = 3,952
🎯 Golden Zone: 3,966 – 3,952
This is a potential intraday demand zone for countertrend bounces if confirmed with volume.
⸻
4️⃣ High-Probability Trade Scenarios
📈 BUY SCENARIO (Countertrend Rebound)
• Entry Zone: 3,966 – 3,952 (Fibonacci Golden Zone)
• Targets: 3,975 → 3,985 → 3,990 → 4,010
• Stop Loss: Below 3,947
• Confirmation: Bullish CHoCH or engulfing pattern on 5M–15M within zone.
📉 SELL SCENARIO (Main Bias)
• Entry Zone: 3,985 – 3,990 (Supply + trendline resistance)
• Targets: 3,975 → 3,960 → 3,940
• Stop Loss: Above 4,000
• Confirmation: Rejection candle or RSI divergence >65.
💥 Breakout SELL Setup
• Trigger: Break & close below 3,970
• Retest Zone: 3,973–3,975
• Targets: 3,955 → 3,940 → 3,915
• Stop Loss: Above 3,985
⸻
5️⃣ Fundamental Watch
• Asian session: Low liquidity, but early positioning ahead of US Jobless Claims may start to build.
• DXY holding above 106 maintains short-term downside pressure on gold.
• Fed members’ comments later today could inject volatility into metals.
⸻
6️⃣ Key Technical Levels
• Resistance: 3,985 / 3,990 / 4,010 / 4,026
• Support: 3,973 / 3,960 / 3,952 / 3,940
• Golden Zone: 3,966 – 3,952
• Break Sell Trigger: < 3,970
• Break Buy Trigger: > 4,000
⸻
7️⃣ Analyst Summary
Gold is consolidating inside a tight compression wedge, with bears defending the 3,985–3,990 area.
As long as 3,970 holds, price remains in equilibrium. However, a confirmed breakdown below 3,970 could accelerate bearish continuation toward 3,955–3,940.
Conversely, only a clean break above 4,000 would confirm short-term bullish reversal.
⸻
8️⃣ Final Bias Summary
📉 Primary Bias: Bearish below 3,985 → targeting 3,960 – 3,940.
📈 Alternative Bias: Bullish breakout above 4,000 → targeting 4,015 – 4,046.
⸻
🥇 ElDoradoFx PREMIUM 3.0 – PERFORMANCE 05/11/2025 🥇
📊 Flawless precision | GOLD & BTC domination.
━━━━━━━━━━━━━━━
🪙 XAU/USD (GOLD)
🔻 SELL +40 PIPS
🟢 BUY LIMIT +20 PIPS
🟢 BUY LIMIT +60 PIPS
🔻 SELL +60 PIPS
🟢 BUY +40 PIPS
🟢 BUY +260 PIPS
🔻 SELL +80 PIPS
🟢 BUY +110 PIPS
💰 GOLD TOTAL: +670 PIPS
━━━━━━━━━━━━━━━
📱 BTC/USD TRADES
🚀 SELL +900 PIPS
💸 BTC TOTAL: +900 PIPS
━━━━━━━━━━━━━━━
📊 COMBINED DAILY PROFIT: +1,570 PIPS
✅ 9 Trades → 9 Wins | 0 SL | 0 BE
🎯 Accuracy: 100%
━━━━━━━━━━━━━━━
🔥 Both GOLD and BTC delivered textbook setups today — high accuracy, clear structure, and strong risk control.
👏 Congratulations if you profited! ✅✅✅🚀🚀🚀

Gold Price Targets 3990 After Support ReboundGold (XAU/USD) is trading around 3966, showing bullish momentum after rebounding from the support zone near 3928. The price is moving within an ascending channel, with a short-term target set at 3990. A breakout above this level could push prices toward the next resistance near 4006.

Bitcoin Rebounds Toward 103,500 Target ZoneBitcoin (BTC/USDT) on the 1-hour chart shows a rebound from the support zone around 99,900, forming a bullish move toward the target area at 103,500. A break above the mid-resistance zone could confirm further upside momentum.

xauusd ideaWe are waiting for our asset to reach our action zone, and based on the reaction, we’ll decide on our next moves.ALWAYS WAIT FOR A CONFIRMATION TO SEE IF THE PRICE VALIDATES THE ZONE.and you what is your vision of the EURUSD its interests me! i wait you in the commentar

ElDoradoFx – GOLD SESSIONS ANALYSIS (05/11/2025, ASIA SESSION)Gold closed the US session bearish at 3,932, extending its downside move under the descending trendline and rejecting from the key supply area at 3,953–3,960. The structure, momentum, and RSI alignment all confirm a continuation bias to the downside — the market remains in a controlled sell-off phase unless bulls reclaim 3,954 with volume.
⸻
📊 Technical Outlook
🔹 D1: Gold is in the second leg of a corrective pullback after peaking at 4,046. The RSI at 46 and fading MACD histogram show room for continuation toward the 100EMA near 3,870.
🔹 H1: Price has consistently printed lower highs and lower lows. All EMAs (20 < 50 < 200) slope downward. The most recent break below 3,940 confirms renewed seller strength.
🔹 15M–5M: Consolidation inside a tight bearish channel, forming minor liquidity traps above 3,940–3,946 before further declines. Momentum is stable to the downside, with no bullish divergence detected.
⸻
✨ Fibonacci Golden Zone (Swing 3,953 → 3,932)
• 38.2% = 3,940
• 50.0% = 3,943
• 61.8% = 3,946
🎯 Golden Zone: 3,940 – 3,946 (Rejection zone for re-entry shorts)
⸻
🎯 High Probability Trade Setup (Chosen Bias: SELL)
📉 SELL SCENARIO (High Probability)
✅ Sell Entry Zone: 3,940 – 3,946 (Golden Zone retest)
🎯 Targets:
1️⃣ 3,925
2️⃣ 3,915
3️⃣ 3,900
4️⃣ Extended target 3,880 (swing projection)
🛑 Stop Loss: Above 3,954
⚡ Confirmation:
– Price rejection at 3,946 or bearish engulfing candle
– RSI stays below 45
– MACD momentum bars remain red
💡 Rationale:
Structure, EMAs, and momentum fully aligned to downside; the 3,940–3,946 area is a low-risk, high-probability retest before the next leg down.
⸻
📈 BUY SCENARIO (Low Probability)
⚠️ Buy Zone: 3,910 – 3,900 (strong low zone / liquidity pool)
🎯 Targets: 3,932 → 3,940
🛑 Stop Loss: Below 3,890
⚡ Only if: Strong bullish divergence forms with RSI <30 and MACD crossover.
⸻
📰 Fundamental Watch
• Asia: Low volatility expected early session; traders waiting for European cash flow.
• DXY: Holding above 106 supports bearish gold momentum.
• No major news, but volatility could spike from dollar liquidity flows ahead of midweek positioning.
⸻
📌 Key Levels
Type Levels Notes
Resistance 3,940 / 3,946 / 3,954 Golden Zone / Rejection Area
Support 3,928 / 3,915 / 3,900 Short-term targets
Break Sell Trigger < 3,928 Confirms continuation
Break Buy Trigger > 3,954 Invalidates bearish setup
⸻
✅ Expert Summary (Final Bias)
Gold remains in bearish continuation mode, with clean confluence between structure, EMAs, and momentum.
🎯 Expect short opportunities from 3,940–3,946 aiming toward 3,915–3,900.
📉 Bias: Bearish continuation until proven otherwise.
⸻
🥇 ElDoradoFx PREMIUM 3.0 – PERFORMANCE 04/11/2025 🥇
📊 Live precision | Consistent gains.
━━━━━━━━━━━━━━━
💎 GOLD RESULTS
🔻 SELL +20 PIPS
🟢 BUY LIMIT +70 PIPS
🔻 SELL +30 PIPS
🟢 BUY +20 PIPS
🟢 BUY +20 PIPS
🔻 SELL +240 PIPS
---
▶ LIVE TRADING SESSION
🔻 SELL +20 PIPS
🔻 SELL +20 PIPS
🔻 SELL +170 PIPS
━━━━━━━━━━━━━━━
💰 TOTAL PIPS GAIN: +610 PIPS
📊 9 Trades → 9 Wins | 0 SL | 0 BE
🎯 Accuracy: 100% ✅
━━━━━━━━━━━━━━━
🔥 Clean, disciplined setups both pre-market and live. Another powerful session for our traders!
👏 Congratulations if you profited! ✅✅✅🚀🚀🚀

Bitcoin Support Zone Rebound SetupBitcoin (BTC/USDT) is approaching a key support zone around 103,000–104,000. A potential rebound from this area could trigger a bullish move toward the first target near 105,000 and the second target around 106,500.

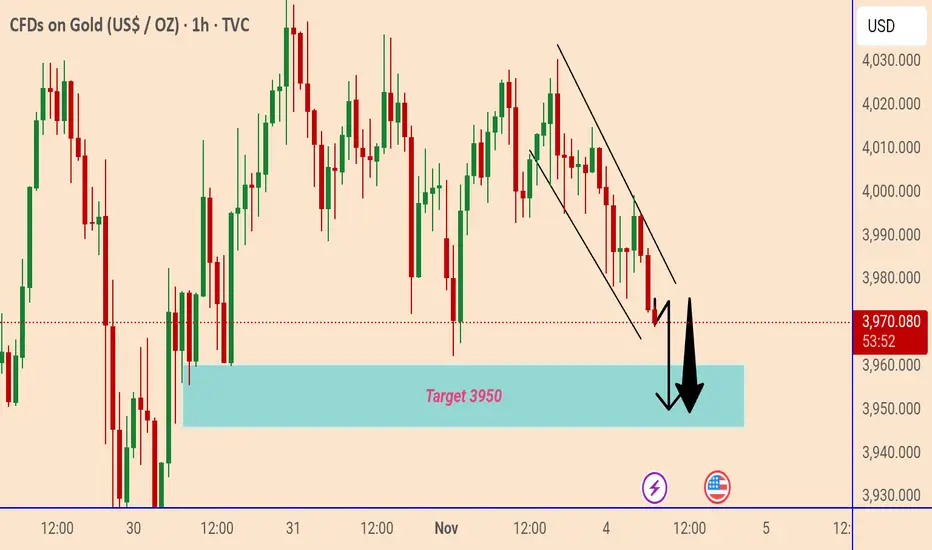
Gold Price Targets 3950 Support ZoneGold price is trading in a downward channel on the 1-hour chart, showing continued bearish momentum. The next key support and target area is around 3950 USD, where buyers may look for a potential reaction.
ElDoradoFx – GOLD (XAUUSD) ANALYSIS (04/11/2025, LONDON SESSION)1. Market Overview
Gold enters the London session trading just below the $4,000 handle, recovering after an early Asian dip to $3,970. The market remains in a range-to-accumulation phase, consolidating beneath descending structure resistance ($4,008–$4,016) and above key support ($3,985–$3,970). Momentum indicators suggest early bullish restoration, but price action remains capped under the 200EMA, awaiting a confirmed breakout to define London’s direction.
⸻
2. Technical Breakdown
🔹 Daily (D1)
Gold holds above the 100EMA, keeping the medium-term structure bullish. RSI at ~50.5 indicates neutrality after a corrective pullback from $4,046. As long as price stays above $3,985, the bullish structure remains intact.
🔹 H1
The pair trades within a descending channel, testing dynamic resistance at $4,004–$4,008. The 50EMA is flattening near the 200EMA, hinting at a potential cross for trend continuation. MACD is stabilizing with higher histogram lows, a bullish sign of momentum recovery.
🔹 15M–5M
Short-term structure shows a series of higher lows (3,970 → 3,982 → 3,993) but faces a clear supply ceiling at 4,004–4,010. RSI around 55–60; MACD positive, suggesting accumulation pressure and reduced selling volume.
⸻
3. Fibonacci Analysis (Swing 3,970 → 4,008)
• 38.2% = 3,993
• 50.0% = 3,989
• 61.8% = 3,985
🎯 Golden Zone: 3,993 – 3,985 → Active demand area for potential long entries.
⸻
4. High-Probability Trade Scenarios
📈 BUY SCENARIO (Primary Bias)
• Buy Zone: 3,993 – 3,985 (Golden Zone)
• Confirmation: Bullish CHoCH or engulfing candle in zone with RSI > 50
• Targets: 4,004 → 4,016 → 4,028 → 4,046
• Stop Loss: Below 3,970
📊 Justification: The Golden Zone aligns with previous liquidity sweep and ascending channel support — strong probability for continuation if defended during London volatility.
💥 Breakout BUY Setup
• Trigger: Break & close above 4,008
• Retest Entry: 4,004–4,006
• Targets: 4,016 → 4,028 → 4,046 → 4,060
• Stop Loss: Below 3,995
📉 SELL SCENARIO (Countertrend)
• Sell Zone: 4,004 – 4,016 (EMA confluence & descending structure)
• Confirmation: Bearish rejection or RSI divergence > 65
• Targets: 3,989 → 3,970 → 3,945
• Stop Loss: Above 4,020
📊 Justification: A rejection from this area would indicate failed breakout momentum, creating a high R:R short toward range support.
⚠️ Break & Retest SELL Setup
• Trigger: Break below 3,970
• Retest Entry: 3,978–3,974
• Targets: 3,965 → 3,945 → 3,920
• Stop Loss: Above 3,985
⸻
5. Fundamental Watch
• UK/EU Data: Light calendar — focus remains on USD strength and DXY (106.10).
• US Factors: Factory Orders and Fed speakers later today; could affect volatility mid-London to NY overlap.
• Sentiment: Gold remains technically bullish but constrained by short-term dollar resilience and yield stabilization.
⸻
6. Key Technical Levels
Type Levels Notes
Resistance 4,004 / 4,016 / 4,028 / 4,046 Supply + 200EMA zone
Support 3,993 / 3,985 / 3,970 / 3,965 Fibo + structural base
Golden Zone 3,993 – 3,985 Main liquidity pivot
Break Buy Trigger Above 4,008 Confirmed bullish continuation
Break Sell Trigger Below 3,970 Bearish momentum confirmation
⸻
7. Analyst Summary
Gold is building pressure within a compressed wedge, where the Golden Zone (3,993–3,985) represents the pivot of the day.
Momentum indicators lean bullish, but the 200EMA and trendline resistance near 4,004–4,008 remain the key barriers.
A clean breakout above 4,008 opens the path to 4,028–4,046, while failure to hold above 3,985 may trigger a retracement to 3,965–3,945.
⸻
8. Final Bias Summary
✅ Primary Bias: Bullish above 3,985
⚠️ Neutral Zone: 3,985–4,004 (wait for breakout confirmation)
❌ Bearish Only Below: 3,970
🎯 Expert Outlook: Focus on buying dips near the Golden Zone with confirmation; avoid premature entries before breakout validation.
⸻
🥇 ElDoradoFx PREMIUM 3.0 – PERFORMANCE 03/11/2025 💸
📊 Smart Entries | Clean Profits | No Drawdown
━━━━━━━━━━━━━━━
🪙 GOLD RESULTS
🟢 BUY +120 PIPS
🟢 BUY +30 PIPS
🔻 SELL +90 PIPS
🟢 BUY +40 PIPS
🟢 BUY LIMIT +200 PIPS
🔻 SELL +20 PIPS
🟢 BUY +40 PIPS
🟢 BUY +20 PIPS
🟢 BUY +40 PIPS
💰 GOLD TOTAL: +600 PIPS
━━━━━━━━━━━━━━━
📱 BTC/USD WEEKEND TRADES
🚀 BUY +900 PIPS
🚀 BUY +1,300 PIPS
📱 BTC TOTAL: +2,200 PIPS
━━━━━━━━━━━━━━━
📊 COMBINED GAIN: +2,800 PIPS
✅ 11 Trades → 11 Wins | 0 SL | 0 BE
🎯 Accuracy: 100%
━━━━━━━━━━━━━━━
🔥 Flawless start to November — precision entries, strong momentum, and clear profit execution across GOLD and BTC!
👏 Congratulations if you profited! ✅✅✅🚀🚀🚀


ElDoradoFx – GOLD SESSIONS ANALYSIS (03/11/2025, PRE-ASIA SESSIGold ends the NY session stabilizing near 4,009, after multiple rejections from 4,025–4,030, confirming that sellers are still defending the upper liquidity zone. Meanwhile, buyers continue holding 4,004–3,995, maintaining a short-term ascending structure. This compression phase between resistance and support signals an imminent breakout setup — with Asia likely to decide direction for the next leg.
⸻
📊 Technical Outlook
🔹 D1: Gold remains bullish above the 100EMA, sustaining higher lows from 3,962 → 3,985 → 3,995. RSI ~52 — neutral but holding mid-range momentum. Daily breakout above 4,025 could reopen the path toward 4,060–4,082.
🔹 H1: Structure compressing between 4,025 resistance and 3,995 support. EMAs converging; MACD neutral with low volatility — ideal for a pre-breakout scenario.
🔹 15M–5M: Price forming equal highs at 4,011–4,012 and higher lows near 4,004. RSI 54–58, indicating gradual bullish accumulation before volatility expansion.
⸻
✨ Fibonacci Golden Zone (Last Swing 3,995 → 4,030)
38.2% = 4,016
50.0% = 4,012
61.8% = 4,008
🎯 Golden Zone: 4,016 – 4,008 (acting as key liquidity zone and short-term pivot).
⸻
🎯 High Probability Zones
📈 BUY SCENARIO (Primary Bias)
✅ Buy Zone: 4,016 – 4,008 (Golden Zone)
🎯 Targets: 4,025 → 4,036 → 4,046 → 4,060
🛑 Stop Loss: Below 3,995
⚡ Confirmation: Bullish engulfing or CHoCH above 4,012–4,016 with MACD crossover upward.
📊 Bias Rationale: The market continues to respect higher lows and absorb liquidity dips — indicating smart money accumulation around the Golden Zone.
💥 Breakout BUY Setup
Trigger: Break & close above 4,025
Retest: 4,022–4,024
🎯 Targets: 4,036 → 4,046 → 4,060 → 4,082
🛑 Stop Loss: Below 4,010
📉 SELL SCENARIO (Contingency Setup)
⚠️ Sell Zone: 4,025 – 4,036 (liquidity pocket + supply zone)
🎯 Targets: 4,012 → 4,004 → 3,985 → 3,965
🛑 Stop Loss: Above 4,046
⚡ Confirmation: Sharp rejection or RSI divergence >65 from 4,025–4,030 area.
📉 Break & Retest SELL Setup
Trigger: Break below 3,995
Retest: 4,000–3,997
🎯 Targets: 3,982 → 3,965 → 3,945
🛑 Stop Loss: Above 4,008
⸻
📰 Fundamental Watch
• Asia session: Low-impact day; volatility expected from liquidity sweeps.
• US Dollar Index (DXY) holding above 106 — mild pressure on gold short-term.
• Global markets: Traders positioning ahead of Fed and NFP later this week, keeping gold in range mode for now.
⸻
📌 Key Levels
Resistance: 4,025 / 4,036 / 4,046 / 4,060
Support: 4,012 / 4,004 / 3,995 / 3,982
Golden Zone: 4,016 – 4,008
Break Buy Trigger: > 4,025
Break Sell Trigger: < 3,995
⸻
✅ Summary (Expert View)
Gold remains bullish-to-neutral, consolidating between 4,004–4,025.
The Fibonacci Golden Zone (4,016–4,008) continues to act as the core decision area — expect Asia to attempt a liquidity sweep before breakout.
⚡ Expert Bias: BUY setup favored above 4,008, targeting 4,036–4,046.
Bearish bias only if 3,995 breaks cleanly.

Bitcoin Rebound from Support Zone Targets 109,400Bitcoin (BTC/USD) is rebounding from the support zone near 106,000, showing signs of a potential upward move. The next resistance targets are around 108,000 and 109,400 levels.

GBP/JPY Bullish Breakout SetupGBP/JPY is forming a bullish structure above the trend line after a break of structure (BoS). Price is consolidating and showing potential for an upward move toward the marked target zones near 203.00.

Gold Price Breakout Toward 4,037 Target(XAU/USD) is forming a symmetrical triangle pattern on the 1-hour chart, suggesting potential breakout momentum. The price is currently trading near $4,014, with an upside target of $4,037 if bullish momentum continues. Key support zones are located at $3,960, $3,920, and $3,880.

Xauusd Price Bullish Continuation Toward Key Resistance Targets (XAU/USD) is showing bullish momentum above the support trend line. Price is expected to continue rising toward the targets at 4,020.081 and 4,037.929, as long as it holds above the trend line support.

Mapping the Next Possible Move | Key Breakout and Demand ZonesGold (XAUUSD) is currently consolidating between key structural zones, showing a balanced tug-of-war between buyers and sellers. The 4025 area remains the short-term resistance to watch — a clean break and close above this level could confirm bullish continuation toward 4075 and the major supply zone around 4150.
On the other hand, failure to sustain above 4025 may trigger a short-term pullback. The 3925–3960 zone has acted as a strong demand area where buyers have consistently stepped in, making it a crucial support for potential bullish rejections and trend continuation.
At this stage, the next possible move will likely depend on how price reacts around these two major zones:
Bullish scenario: Break and retest above 4025 → potential rally toward 4150.
Bearish scenario: Rejection at 4025 → possible correction toward 3925 demand.
Overall sentiment remains neutral-to-bullish as long as price holds above the demand area. Watching for a confirmed breakout or clear rejection structure before taking directional trades is key.

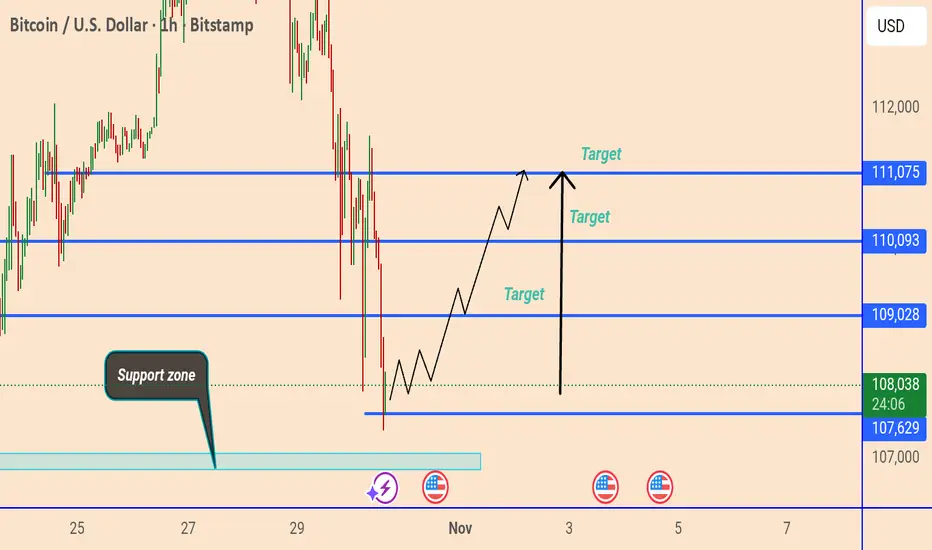
Bitcoin Price Analysis: Potential Rebound from Key Support Zone This chart shows the BTC/USD (1-hour) price action with key support and resistance levels. Bitcoin is currently trading near $107,904, slightly above a highlighted support zone around $107,629–$107,000. The analysis suggests a potential bullish reversal from this support, with projected upside targets at $109,028, $110,093, and $111,075.
ElDoradoFx PREMIUM – GOLD ANALYSIS (31/10/2025, LONDON SESSION)1️⃣ Market Overview
Gold enters the London session consolidating near 4,008–4,010, after defending support at 3,985 and rejecting from 4,046. The market remains in a short-term bullish channel, but momentum is slowing as buyers struggle to reclaim the intraday high.
Currently, price sits above key EMAs (50 & 200) but faces overhead resistance between 4,034–4,046, which coincides with yesterday’s rejection zone. Today’s London open is expected to bring higher volatility and potential direction for the next leg — either continuation toward 4,060+ or a pullback toward 3,985.
⸻
2️⃣ Technical Breakdown
🔸 Daily (D1):
Price is holding steady above the 100EMA, printing a second consecutive candle above 4,000. RSI ~51 confirms a balanced market, while MACD histogram shows flattening red bars — signaling possible transition toward bullish momentum.
🔸 H1:
The structure shows higher lows from 3,915 and a rejection at 4,046, forming a small range. Price remains supported at the 50EMA (around 4,000) and ascending trendline. RSI 54; momentum moderate but favoring bulls as long as 3,985 holds.
🔸 15M–5M:
Gold trades in a tight wedge pattern with clear BOS and CHoCH confirmations. RSI oscillating between 55–60; MACD crossing positive, suggesting renewed buying pressure. However, the 4,034–4,046 zone remains a short-term barrier until a clean breakout occurs.
⸻
3️⃣ Fibonacci Analysis (Last Swing: 3,985 → 4,046)
• 38.2% = 4,022
• 50.0% = 4,015
• 61.8% = 4,008
🎯 Golden Zone for Re-entry: 4,022 – 4,008
⸻
4️⃣ High-Probability Trade Scenarios
📈 BUY SCENARIO (Main Bias)
✅ Entry Zone: 4,022 – 4,008 (Golden Zone)
🎯 Targets: 4,034 → 4,046 → 4,060 → 4,082
🛑 Stop Loss: Below 3,995
⚡ Confirmation: Bullish engulfing or CHoCH confirmation from 5M/15M near the Golden Zone.
💥 Breakout BUY Setup
• Trigger: Clean breakout & close above 4,046
• Retest Entry: 4,040–4,043
🎯 Targets: 4,060 → 4,082 → 4,100
🛑 Stop Loss: Below 4,030
⸻
📉 SELL SCENARIO (Countertrend)
⚠️ Entry Zone: 4,046 – 4,060 (Resistance & previous swing high)
🎯 Targets: 4,022 → 4,008 → 3,985 → 3,965
🛑 Stop Loss: Above 4,070
⚡ Confirmation: 15M bearish rejection candle or RSI divergence above 65.
📉 Break & Retest SELL
• Trigger: Break below 3,985 → Retest rejection at 3,995
🎯 Targets: 3,965 → 3,945 → 3,920
🛑 Stop Loss: Above 4,005
⸻
5️⃣ Fundamental Watch
• London expected to bring stronger liquidity after quiet Asia session.
• DXY near 106.20 — any recovery could limit gold’s upside.
• US Core PCE data later today may influence dollar strength ahead of NY session.
• Market remains risk-sensitive due to month-end positioning.
⸻
6️⃣ Key Technical Levels
Resistance: 4,034 / 4,046 / 4,060 / 4,082
Support: 4,022 / 4,008 / 3,995 / 3,985 / 3,965
Golden Zone: 4,022 – 4,008
Break Buy Trigger: > 4,046
Break Sell Trigger: < 3,985
⸻
7️⃣ Analyst Summary
Gold remains bullish-to-neutral above 3,995, forming a tight intraday range before a breakout.
If 4,046 breaks with volume, expect continuation to 4,060–4,082.
However, failure to clear 4,046 may invite short-term retracement toward 4,022–4,008 (Golden Zone) for re-entry.
The trend remains bullish while above 3,985, with downside risk only below that level.
⸻
8️⃣ Final Bias Summary
Bias: 🔼 Bullish (while above 3,985)**
Short-term Objective: Buy pullbacks toward 4,022–4,008
Invalidation: Below 3,985 → turns short-term bearish.
⸻

ElDoradoFx PREMIUM – GOLD ANALYSIS (31/10/2025, ASIA SESSION)1️⃣ Market Overview
Gold closed the US session above $4,020, marking a strong recovery from the weekly low of $3,915. Price has reclaimed the short-term bullish structure, trading near $4,024–$4,027, just under a critical resistance zone. Bulls maintain control as long as $3,990 holds, but the market is approaching a key decision point where a breakout could define the next major move.
⸻
2️⃣ Technical Breakdown
🔸 Daily (D1):
Price has bounced sharply from the 100EMA and printed the first higher daily close after multiple bearish sessions. RSI at 52.5 supports the early phase of bullish recovery. MACD histogram turning lighter red signals momentum shift. The next key resistance sits at $4,100, while support remains solid around $3,850–$3,900.
🔸 H1:
Bullish structure with clear higher lows from $3,915 and BOS confirmations up to $4,020. Price currently retesting the intraday trendline with confluence from 50EMA and Fib levels. RSI 62+, momentum still strong but slightly extended.
🔸 15M–5M:
Micro structure shows tight compression under $4,027 (key rejection area). Multiple CHoCH and BOS confirm upward control, but short-term RSI divergence hints at possible minor pullback before further continuation.
⸻
3️⃣ Fibonacci Analysis (Last Swing: 3,985 → 4,027)
• 38.2% = 4,011
• 50.0% = 4,006
• 61.8% = 4,000
🎯 Golden Zone for Re-entry: 4,011 – 4,000
⸻
4️⃣ High-Probability Trade Scenarios
📈 BUY SCENARIO (Main Bias)
✅ Entry Zone: 4,011 – 4,000 (Golden Zone)
🎯 Targets: 4,027 → 4,040 → 4,055 → 4,070
🛑 Stop Loss: Below 3,990
⚡ Confirmation: Bullish engulfing or CHoCH on 5M after Fib retracement.
💥 Breakout BUY Setup
• Trigger: Clean break & close above 4,027 → Retest 4,024–4,027
• Targets: 4,040 → 4,055 → 4,082
• Stop Loss: Below 4,015
⸻
📉 SELL SCENARIO (Countertrend)
⚠️ Entry Zone: 4,027 – 4,035 (H1 supply & ascending resistance)
🎯 Targets: 4,011 → 4,000 → 3,985 → 3,965
🛑 Stop Loss: Above 4,040
⚡ Confirmation: 5M bearish engulfing or RSI >70 with MACD crossover.
📉 Break & Retest SELL
• Trigger: Close below 3,985 → Retest rejection
• Targets: 3,965 → 3,945 → 3,920
• Stop Loss: Above 3,995
⸻
5️⃣ Fundamental Watch
• Asian session expected to open quietly, but momentum from US close favors continuation.
• DXY pulling back under 106 supports gold near-term.
• Market eyes upcoming US Core PCE and inflation data tomorrow — possible volatility buildup.
• Watch for end-of-month position adjustments and liquidity traps during Asia open.
⸻
6️⃣ Key Technical Levels
Resistance: 4,027 / 4,035 / 4,055 / 4,070
Support: 4,011 / 4,000 / 3,985 / 3,965 / 3,945
Golden Zone: 4,011 – 4,000
Break Buy Trigger: > 4,027
Break Sell Trigger: < 3,985
⸻
7️⃣ Analyst Summary
Gold remains in a bullish continuation structure, with 4,000–3,985 acting as critical support.
• If 4,027 breaks and holds → bullish extension toward 4,055–4,070.
• If 4,027 rejects → expect healthy retracement back to 4,011–4,000 before continuation.
Short-term trend remains bullish above 3,990, but traders should watch for potential exhaustion around 4,035–4,050.
⸻
8️⃣ Final Bias Summary
Bias: 🔼 Bullish (while above 3,990)**
Short-term Objective: Reclaim & hold 4,027 for continuation to 4,055+
Invalidation: Break below 3,985 → bearish correction resumption.
⸻
🥇 ElDoradoFx PREMIUM 3.0 – PERFORMANCE 30/10/2025 🥇
📊 Steady momentum & sharp entries throughout the session.
━━━━━━━━━━━━━━━
🔻 SELL +40 PIPS
🟢 BUY +210 PIPS
🔻 SELL +20 PIPS
🟢 BUY +40 PIPS
🟢 BUY +110 PIPS
🔻 SELL +110 PIPS
🔻 SELL +20 PIPS
🟢 BUY +20 PIPS
⚪️ BUY – BE
🔻 SELL +40 PIPS
━━━━━━━━━━━━━━━
💰 GOLD TOTAL PROFIT: +610 PIPS
📊 10 Trades → 9 Wins | 1 BE
🎯 Accuracy: 90%
━━━━━━━━━━━━━━━
🔥 High precision and clean follow-through from GOLD — trend confirmation and disciplined entries led to another strong day!
👏 Congratulations if you profited! ✅✅✅🚀🚀🚀

ElDoradoFx PREMIUM – GOLD ANALYSIS (30/10/2025, LONDON SESSION)1️⃣ Market Overview
Gold continues to trade in a corrective recovery phase after the sharp sell-off from 4,025. Current price sits near 3,970–3,975, just below a descending H1 trendline and confluence of the 200 EMA (yellow) and 100 EMA (white).
Momentum is improving but overall structure remains bearish-to-neutral, pending a confirmed breakout above 3,990.
The 3,915–3,925 demand zone has held for 3 consecutive sessions, suggesting a possible base formation before a larger move.
⸻
2️⃣ Technical Breakdown
Daily (D1)
• Structure: Retracement phase within bullish macro trend.
• RSI recovering to 49, showing loss of bearish momentum.
• MACD histogram contracting — bearish momentum fading.
• Support: 3,850–3,900
• Resistance: 4,005–4,055
H1
• Market formed higher lows from 3,916; however, still capped under descending trendline.
• EMA confluence (200, 100, 50) between 3,975–3,990 acts as near-term resistance.
• RSI around 55, indicating moderate bullish correction.
• Key structure: BOS at 3,960 → now forming liquidity near 3,978–3,990.
15M–5M
• Compression pattern forming (triangle structure) under 3,975–3,982.
• Multiple sweeps below 3,940 confirming liquidity grabs.
• Short-term structure remains bullish while above 3,945; intraday momentum aligns with EMA direction.
⸻
3️⃣ Fibonacci Analysis (Last Swing: 3,916 → 3,978)
• 38.2% = 3,954
• 50.0% = 3,947
• 61.8% = 3,940
🎯 Golden Zone for Re-entry: 3,954 – 3,940
Additional confluence: H1 structure support + liquidity pool at 3,940 = optimal buy zone.
⸻
4️⃣ High-Probability Trade Scenarios
🟩 Scenario A – Buy Retracement (Primary Bias)
• Buy Zone: 3,954 – 3,940 (Golden Zone)
• Confirmation: 5M/15M bullish engulfing or CHoCH after retest
• SL: Below 3,933
• TPs: 3,975 → 3,990 → 4,005 → 4,025
• Rationale: Structure support, Fib alignment, EMA confluence, and fading bearish momentum.
⸻
🟨 Scenario B – Break & Retest Buy
• Trigger: Break and close above 3,990 on 15M/H1
• Retest Zone: 3,985–3,990
• SL: 3,972
• TPs: 4,005 → 4,025 → 4,055 → 4,062
• Rationale: Clean breakout from compression structure confirming bullish continuation.
⸻
🟥 Scenario C – Countertrend Sell (At Supply Zone)
• Sell Zone: 3,975–3,990 (EMA + descending TL confluence)
• Confirmation: Bearish engulfing or RSI rejection near 60–65
• SL: Above 4,003
• TPs: 3,958 → 3,947 → 3,940 → 3,930
• Rationale: Short-term exhaustion + supply reaction at major resistance cluster.
⸻
⚫ Scenario D – Momentum Sell (If Demand Fails)
• Trigger: 15M candle close below 3,939, retest rejection at 3,939–3,945
• SL: Above 3,952
• TPs: 3,925 → 3,916 → 3,898 → 3,886
• Rationale: Demand breakdown and bearish continuation confirmation.
⸻
5️⃣ Fundamental Watch
• Low volatility expected early London; attention shifts to US GDP & jobless claims later.
• DXY stable near 106, limiting gold’s upside unless USD weakens.
• Bond yields steady; risk sentiment slightly cautious.
• Key catalyst: Any breakout in DXY >106.5 or <105.8 could shift XAUUSD direction sharply.
⸻
6️⃣ Key Technical Levels
Type Levels
Resistance 3,975 / 3,990 / 4,005 / 4,025 / 4,055–4,062
Support 3,954 / 3,947 / 3,940 / 3,930 / 3,916 / 3,886
Golden Zone 3,954 – 3,940
Break Buy Trigger > 3,990
Break Sell Trigger < 3,939
⸻
7️⃣ Analyst Summary
• Market attempting recovery from 3,915 base; compression under 3,990 suggests a build-up before breakout.
• Momentum improving but confirmation needed via 3,990 breakout or Fib GZ retest.
• Bias remains short-term bullish while 3,940 holds; otherwise neutral-to-bearish below 3,939.
⸻
8️⃣ Final Bias Summary
• 🔹 Primary Bias: Bullish above 3,940; targets 4,005–4,025.
• 🔸 Secondary Bias: Bearish below 3,939; targets 3,916–3,886.
• ⚠️ Key Decision Zone: 3,975–3,990 (EMA and trendline confluence). Wait for breakout or rejection confirmation.
⸻
