Prices fell. Has a low been reached?The daily gold chart suggests a continued bullish trend. Consecutive breakouts confirm continued upward movement. The MACD indicator remains within overbought territory, indicating a modest rise and not signaling a lack of upward momentum.
In the short term, the 4-hour chart also suggests an upward bias for gold. Technical indicators are extending gains within positive territory, with prices retreating to the middle Bollinger Band and now overlapping the 20-day moving average. The MACD indicator has formed a golden cross and is trending downward. Gold remains above the 20-day moving average. While the longer-term moving average maintains an upward trend, it remains well below the 20-day moving average. Most indicators suggest a easing of bullish momentum.
Prices are currently retreating. For stable trading, it is recommended to remain cautious and wait for a price low before entering a long position.
Of course, if aggressive trading is desired, long positions around 3725-3730 are still an option.
Analyse

BTCUSD: Rally Back to 116000 ResistanceHello everyone, here is my breakdown of the current Bitcoin setup.
Market Analysis
The market for Bitcoin has seen a structural shift after breaking down from its prior Upward Channel. This event signaled a loss of bullish momentum and led to a sharp decline down to the major horizontal Support at the 112000 level.
Currently, the price has found significant support in the 111500 - 112000 Support zone and has initiated a bounce. The market is now in a potential reversal phase, but I believe the conviction of the buyers still needs to be confirmed with one final test.
My Scenario & Strategy
My scenario is built on the idea that the 112000 Support is a major area of demand that will ultimately hold. I'm looking for a strong and confirmed bounce from Support zone. This would be the key signal that the corrective low is in place and the market is ready to reverse its course and begin a new rally.
Therefore, the strategy is to watch for this successful retest. It would validate the long scenario, with the price then expected to rally back up to the point of the initial breakdown. The primary target for this move is the 116000 Resistance level, which also aligns with the Resistance Zone.
That's the setup I'm tracking. Thank you for your attention, and always manage your risk.

4 Possible Scenarios for USOIL (WTI Crude Oil, H1) I SEP/24/2025Scenario 1: Price Rejects Supply Zone (63.80 – 63.94)
The Supply Zone at 63.80–63.94 has acted as a strong resistance.
If price fails to break above this zone, a short-term pullback is likely.
Nearest target: POC zone at 63.05. If this level is broken, price could move further down to the Liquidity Zone at 62.36.
👉 This is a short-term bearish scenario.
Scenario 2: Price Breaks Supply Zone and Moves Higher
If price breaks out and closes an H1 candle above 63.94, the short-term bullish trend will be confirmed.
The Supply Zone will then flip into a support area.
Next potential target: 64.50 – 65.00.
👉 This is a strong bullish scenario, but confirmation is required.
Scenario 3: Price Pulls Back to POC Zone (63.05) and Bounces
The POC zone (Point of Control) at 63.05 is a key volume balance level.
If price retraces here and strong buying pressure appears, a bounce back toward the Supply Zone (63.80–63.94) is likely.
👉 This is a sideway-accumulation then bullish scenario.
Scenario 4: Price Drops Deep into Demand Zone (61.76)
If strong selling pressure breaks through the Liquidity Zone (62.36), price may fall deeper to the Demand Zone at 61.76.
This is a key demand level where a short-term bottom could form, followed by a strong rebound.
👉 This is a deep bearish then recovery scenario.
Disclaimer: This analysis is for informational and educational purposes only, not financial advice. Please manage your own risk before making any trading decisions.

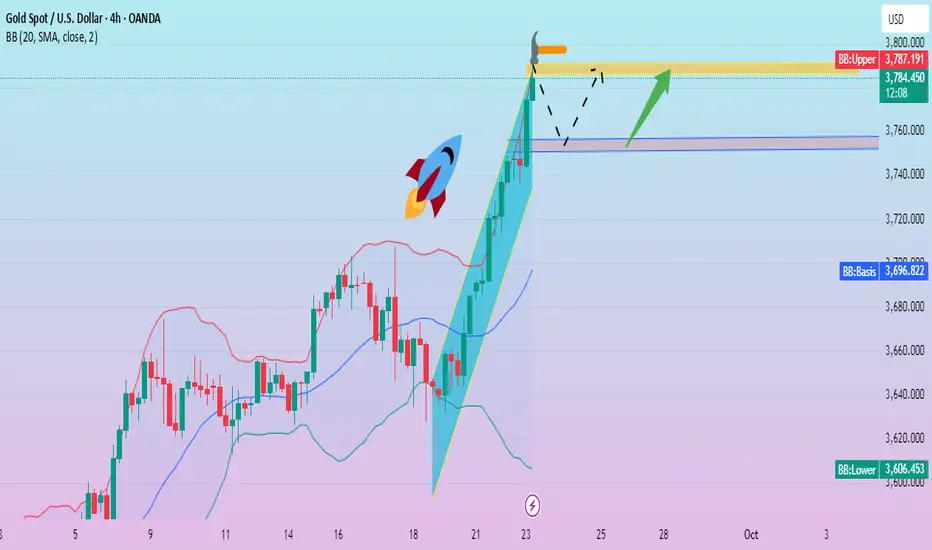
Gold remains strong. Latest analysis.Gold continued its upward trend, breaking all-time highs several times, reaching as high as 3790.97. It traded around 3780 in early US trading. Following the Federal Reserve's 25 basis point rate cut last week, market expectations of further easing this year, coupled with geopolitical uncertainty, have fueled demand for safe-haven and inflation hedging, pushing gold prices to explore a new equilibrium range.
The 1-hour chart shows that gold prices have recently been rallying around the middle Bollinger Band. Early in the Asian session on Tuesday, the price continued its upward trend, retreating slightly to touch the middle Bollinger Band before stabilizing and continuing its upward trend. It retreated in the European session, but remained stable near the middle Bollinger Band before rebounding to an Asian high of 3759.
Currently, the European session has broken through the highs strongly, and the US session is likely to continue its upward trend. A pullback near the 10-day moving average is expected, and above the middle band, the bullish trend remains. Considering the crossover points, the 3770-3760 area is a key focus. If it stabilizes, the bullish trend will continue, with the profit range focused on 3790-3800. A strong upward breakthrough could potentially reach the 3800 mark. Otherwise, a strong upward breakthrough will likely continue, and a volatile upward trend will likely persist.
Short-term trading strategy:
Go long around 3760-3770, stop loss at 3750, profit range 3790-3800.

Gold breaks through. Watch for key support levels.Gold continues to strengthen this week, hitting new all-time highs. So far, it has reached around 3791 and is currently fluctuating at a high level.
Looking at the 4-hour chart, the Bollinger Bands continue to open upward, and gold will continue to run on the upper track of the Bollinger Bands in the short term. After a slight pullback, gold continues to strengthen. There may be periods of short-term volatility and pullbacks. A pullback will focus on the strong support at 3755. A small long position is recommended when the price retreats to this area. The profit range is 3775-3790.
EUR/USD H1 Analysis: Key Supply & Demand Zones to Watch I SEP/231) Overview
Timeframe: H1 (short to mid-term trades).
Short-term trend: bullish (trendline up from Sept 22 low).
Current price: around 1.1798, overlapping with POC zone ~1.1799 (from volume profile).
Key zones:
Supply zone: 1.1814 – 1.1820 (strong resistance).
POC zone / balance area: ~1.1799.
H1 Support: 1.17606 (near-term support).
Demand zone: ~1.17236 (stronger support below).
2) Price Action & Market Logic
Price has been making higher highs / higher lows → bullish structure.
Volume profile shows POC ~1.1799 as the most traded price → if price holds above → likely continuation. If rejected → pullback to support.
H1 trendline acts as dynamic support → confluence buy zone if combined with H1 support.
3) Main Scenario: Buy with the trend (priority setup)
Idea: wait for pullback to H1 support/trendline, buy upon confirmation.
Entry zone: 1.1760 – 1.1770 (support + trendline confluence).
SL: below 1.1740 (to avoid stop hunts).
TP1 (partial): 1.1814 (supply zone).
TP2 (full): 1.1820 – 1.1830 (if breakout/momentum continues).
Example Risk:Reward:
Entry ~1.1765.
Stop: 25 pips (1.1765 → 1.1740).
Target TP1: 49 pips (1.1765 → 1.1814).
R:R ~ 1:2 (solid setup).
4) Alternative Scenario: Sell from Supply zone (counter-trend scalp)
Idea: short at supply if bearish rejection forms.
Entry: 1.1814 – 1.1820.
SL: above 1.1835.
TP1: 1.1790 (POC zone).
TP2: 1.1760 (H1 support).
Note: This is a counter-trend trade → smaller size, only with clear rejection (pin bar/engulfing).
5) Entry Confirmation Signals
Only enter if one of these shows up at key levels:
Pin bar or engulfing candle on H1.
Break & retest of supply/resistance with strong volume.
Volume acceptance above POC = bullish continuation; rejection below = bearish move.
6) Risk & Position Sizing (example)
Rule: max 1% risk per trade (can go 2% if aggressive).
Formula:
Risk $ = Account × %risk.
Loss per lot = Stop (pips) × $10 (for EUR/USD, 1 standard lot ≈ $10/pip)
Lot size = Risk $ / Loss per lot.
Example: Account $10,000, 1% risk → $100 risk.
Stop = 25 pips.
Loss/lot = 25 × $10 = $250.
Lot size = $100 / $250 = 0.4 lots.
7) Trade Management
Partial close 50% at TP1, move SL to breakeven for the rest.
Or scale out gradually, trail stop under swing lows/EMA.
Exit early if price consolidates weakly without momentum.
8) Invalidations / No-trade conditions
If H1 closes below 1.1740 (support + trendline broken) → cancel buy setup, wait for demand zone ~1.1723.
If price struggles at POC (no acceptance above) → avoid buying until structure clears.
Avoid new entries right before high-impact news (FOMC, NFP, CPI).
9) Quick Checklist before entry
Price at confluence zone (support + trendline or supply).
H1 candle confirmation (pin/engulfing/retest).
R:R ≥ 1.5 (preferably ≥ 2).
Position size matches risk %.
Economic calendar checked for news events.
Disclaimer: This analysis is provided for educational and informational purposes only and does not constitute financial advice. Trading involves risk, and you should only trade with money you can afford to lose. Always do your own research before making any investment decisions.

Gold remains strong. 3800?In Tuesday's Asian session, gold hit around 3758 before retreating and currently fluctuating around 3743. While gold continues to hit new highs, the bullish trend remains. Monday's analysis suggests that after breaking through the resistance level of 3745, the upward trend will reach 3760, a level it has successfully reached.
The current market environment is characterized by geopolitical instability, rising risk aversion for gold, and the impact of the Federal Reserve's interest rate cuts. Therefore, gold is unlikely to experience a significant decline in the short term. Therefore, based on the strength of the trend, it is expected to rise to a high of 3780 in the short term. Further upward movement will only reach the 3800 level.
From a technical perspective, the Bollinger Bands on both the daily and 4-hour charts show strong unilateral strength, with continued upward breakthroughs and minimal corrections. In short-term trading, observe the changes in small cycles. The support point below the hourly line is around 3735. If the adjustment is too strong, it can be seen around 3710 below. In the short term, it is recommended to go long when it falls back to the 3735-3710 range.

Bullish Trend? Pullbacks as Opportunities?From the daily chart, gold has successfully reversed its previous weakness and firmly established itself above all major moving averages, demonstrating a clear bullish trend. Although gold prices may experience short-term high volatility, any pullbacks are expected to be limited.
Strong support has shifted to around 3700. The market is likely to maintain its upward momentum from this level until it breaks below. The primary upside target is 3745, and a break above this level will target the strong resistance area of 3760.
Gold prices continued to rise in the US market, with no signs of a pullback from the 3734 high. The 1-hour moving average remains bullish. Quaid believes that the current trading strategy remains to follow the market. The primary strategy is to wait for a pullback to around the 3715 support area to look for long opportunities. However, caution is advised regarding the current significant resistance level, as this level could potentially form a top and trigger a technical pullback.
Trading Recommendations:
Short at 3740-3745, stop loss at 3755. Profit range: 3720-3710-3700.
Go long on a pullback to 3710-3715, stop loss at 3700. Profit range: 3730-3750.

USDJPY Ultimate Price Action Analysis:📊 USDJPY Forecast 🔮💹 (147.961) Closing 20th Sept 2025 | 12:50 AM UTC+4
🕵️♂️ Market Snapshot
USDJPY closed at 147.961, showing mixed signals as bulls attempt to hold ground near critical levels while sellers eye a potential reversal. ⚖️
🏦 Technical Framework
🔹 Chart Patterns
📈 Possible Elliott Wave 5th leg exhaustion near 148.5–149.2.
🌀 Harmonic PRZ forming around 149.0.
🏯 Ichimoku Cloud shows resistance overhead, baseline support at 147.3.
⚠️ Watch for bull trap if price fails 148.2.
🔹 Indicators
RSI 📊: 62 → mild overbought.
BB 🔔: Price hugging upper band = volatility spike.
MA Cross 🔀: Golden cross intact, but momentum flattening.
VWAP ⚡: Anchored VWAP = 147.6 → strong pivot.
🕐 Intraday Outlook
Buy Zone 💵: 147.40 – 147.60 (support + VWAP confluence).
Sell Zone 💸: 148.50 – 148.80 (resistance + harmonic).
Take Profit 🎯:
Longs → 148.20 / 148.50
Shorts → 147.10 / 146.80
Stop Loss 🛑:
Longs < 147.20
Shorts > 149.00
⏳ Swing Trading Outlook
Bullish Scenario 🐂: Break & close above 149.20 → next target 150.50 – 151.20.
Bearish Scenario 🐻: Close below 146.80 → correction toward 145.40 – 144.70.
📌 Key Levels
Resistance: 148.20 / 148.80 / 149.20
Support: 147.40 / 146.80 / 145.40
🎯 Strategy Summary
✅ Intraday: Buy dips near support, sell rallies near resistance.
✅ Swing: Watch 149.20 breakout or 146.80 breakdown for larger moves.
⚡ Volatility expected → trade with strict risk control.
🌍 Market Context
Fed & BoJ policy divergence remains key.
Geopolitical jitters in Asia could trigger safe-haven flows → boosting JPY demand.
🔥 Trade Smart | Manage Risk | Respect Levels 🔥
For individuals seeking to enhance their trading abilities based on the analyses provided, I recommend exploring the mentoring program offered by Shunya Trade. (Website: shunya dot trade)
I would appreciate your feedback on this analysis, as it will serve as a valuable resource for future endeavors.
Sincerely,
Shunya.Trade
Website: shunya dot trade
⚠️Disclaimer: This post is intended solely for educational purposes and does not constitute investment advice, financial advice, or trading recommendations. The views expressed herein are derived from technical analysis and are shared for informational purposes only. The stock market inherently carries risks, including the potential for capital loss. Therefore, readers are strongly advised to exercise prudent judgment before making any investment decisions. We assume no liability for any actions taken based on this content. For personalized guidance, it is recommended to consult a certified financial advisor.

XAUUSD Gold Trading Strategy September 15, 2025XAUUSD Gold Trading Strategy September 15, 2025: Weekly trend outlook, gold still has enough conditions for the possibility of continued price increases.
Basic news: After surpassing the 3670 USD/ounce mark, the highest level in history, the gold price has entered a correction phase, in the context of the market focusing on monitoring the policy moves of the US Federal Reserve (Fed). According to CME's FedWatch tool, investors are almost certain that the Fed will cut interest rates by 25 basis points, bringing the margin to 4 - 4.25%. However, the scenario of the Fed cutting 50 basis points is still considered, because this could cause the USD to plummet and push gold to skyrocket.
Technical analysis: The sideway range of 3600 - 3660 is still holding. Currently, we will wait for trading points at the 2 edges of the sideway range, but the priority is still mainly trading according to the trend.
Important price zones today: 3600 - 3605 and 3660 - 3665. Today's trading trend: Sideway.
Recommended orders:
Plan 1: BUY XAUUSD zone 3600 - 3602
SL 3597
TP 3605 - 3615 - 3635 - 3665 - OPEN.
Plan 2: BUY XAUUSD zone 3618 - 3620
SL 3615
TP 3623 - 3630 - 3650 - 3665.
Plan 3: SELL XAUUSD zone 3663 - 3665
SL 3668
TP 3660 - 3650 - 3640 - 3630 (small volume).
Wish you a new week of safe, effective and profitable trading.🥰🥰🥰🥰🥰

CURRENT MARKET CONTEXTCURRENT MARKET CONTEXT
- Price is currently around 3646, reacting right at the SWING PoC + VAH zone (3644–3651).
- This price area was previously a strong resistance — now it may be retested before continuing upward.
- The short-term down structure has been broken, and the market is back in an uptrend channel.
- H1 and H4 structure remain in Higher Low – Higher High, supporting the bullish trend.
VOLUME PROFILE highlights strong distribution around:
🟧VAL: 3632–3635
🔺POC – VAH: 3644–3651
🟩Supply zone: 3668–3672
💡 4 TRADING SCENARIOS
✅ SCENARIO 1 – BUY PULLBACK at POC zone
⚠️ Conditions:
Reversal candlestick forms around 3640–3644 (Pin Bar / Fakey / Engulfing M15–H1).
POC volume holds strongly.
❇️ Entry zone: 3640 – 3644 (retest VAH/POC)
🎯 Target: 3658 – 3668
🛑 SL: below 3634
📌 Reason: This is the nearest volume support zone; high probability of bouncing with trend.
✅ SCENARIO 2 – BUY on retest of SWING VAL zone
⚠️ Conditions:
Price shows rejection wick or fake break at 3632.
Uptrend line remains intact.
❇️ Entry zone: 3632 – 3635
🎯 Target: 3648 – 3668
🛑 SL: below 3628
📌 Reason: This is a strong support zone previously confirmed.
✅ SCENARIO 3 – SELL short-term reaction at Supply Zone
⚠️ Conditions:
Bearish Engulfing / Pin Bar H1 forms.
Weak breakout with no volume continuation.
❇️ Entry zone: 3668 – 3672
🎯 Target: 3650 – 3640
🛑 SL: above 3675
📌 Reason: Previous high + liquidity supply zone, potential to trap buyers.
✅ SCENARIO 4 – SELL if Demand Zone breaks
⚠️ Conditions:
Price breaks clearly below 3628 with strong breakout volume.
Retest fails.
❇️ Entry zone: below 3628 (upon confirmed breakout)
🎯 Target: 3610 – 3595
🛑 SL: above 3632
📌 Reason: If broken, this signals a shift from bullish structure to corrective move.
✅ STRATEGY SUMMARY
- Prioritize Buys with the trend: Focus on Buy setups at VAL or VAH zones.
- Be cautious at Supply zones: These are potential profit-taking areas.
- Respect Stop Loss: If the market breaks the Demand zone, the plan needs to be reversed

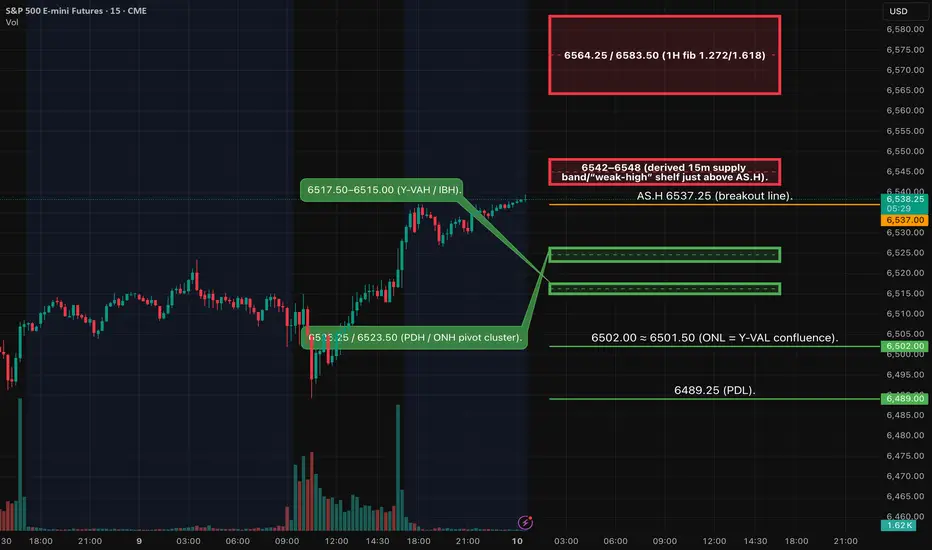
ES — Week Ahead (Sep 15–19) — Fundamentals & Key Risk WindowsMacro focus: FOMC (Wed 2:00/2:30 pm ET), plus Retail Sales, Industrial Production, Housing Starts, Jobless Claims, Philly Fed, and LEI.
Calendar (ET):
Tue 9/16
• Retail Sales (Aug) 8:30 — Census schedule confirms Sep 16, 8:30 am release.
• Industrial Production (Aug) 9:15 — G.17 release calendar shows Sep 16 at 9:15 am.
• NAHB Housing Market Index (Sep) 10:00 — NAHB schedule sets Sep 16, 10:00 am.
• FOMC (Day 1) begins — Fed calendar.
Wed 9/17
• Housing Starts/Permits (Aug) 8:30 — Census/HUD note next report Sep 17, 8:30 am.
• FOMC Statement 2:00 / Powell 2:30 — Fed event calendar.
Thu 9/18
• Initial Jobless Claims 8:30 — DOL weekly; last print 263k (spike tied to TX/fraud anomalies).
• Philly Fed (MBOS) 8:30 — 3rd Thu schedule.
• Conference Board LEI 10:00 — next release Sep 18, 10:00 am.
Fri 9/19
• State Employment (Aug) 10:00 — BLS schedule.
• (FYI for next week: Existing Home Sales (Aug) Tue Sep 23, 10:00 am.)
Context to watch:
• Markets widely expect a 25 bp cut at the Sep 16–17 FOMC; path/“dots” and Powell’s tone matter more than the cut size.
• Michigan sentiment (prelim) fell to 55.4 with inflation expectations elevated (1-yr 4.8%, 5-yr 3.9%).
Tomorrow (Mon 9/15) — Trade Plan
Kill-zones (ET): NY AM 09:30–11:00; NY PM 13:30–16:00.
News risk: NAHB 10:00 (size down or wait 2–3m around print)
Long from support 6586 → TP1 6600
• 15m trigger: Rejection at 6586 (close ≥ 6587 after testing ≤ 6585).
• 5m confirm: Higher-low + close ≥ 6588.
• 1m entry: First retest that closes back above 6587.
• Hard SL: 15m wick low − 0.25–0.50.
• TP1: 6600 (book 70%, runner 30% @ BE).
• TP2 (runner): 6606.25.
Short from resistance 6600 → TP1 6586
• 15m trigger: Rejection at 6600 (close < 6596.5 after probing ≥ 6598.5).
• 5m confirm: Lower-high + close < 6596.0.
• 1m entry: First retest that closes back below 6596.5.
• Hard SL: 15m wick high + 0.25–0.50.
• TP1: 6586 (book 70%, runner 30% @ BE).
• TP2 (runner): 6581.50.
Weekly plan—how fundamentals change our timing
• Tue AM (Retail Sales 8:30 / IP 9:15 / HMI 10:00): Expect a more directional NY AM; trade level→level but avoid first prints by ±3–5m.
• Wed (FOMC 2:00/2:30): Treat NY PM as the main event; no positions carried into 1:55–2:35 unless already at TP1 with runner @ BE.
• Thu (Claims/Philly/LEI): 8:30–10:00 stack can create a trend morning; trade acceptance if a 15m body prints through a level.
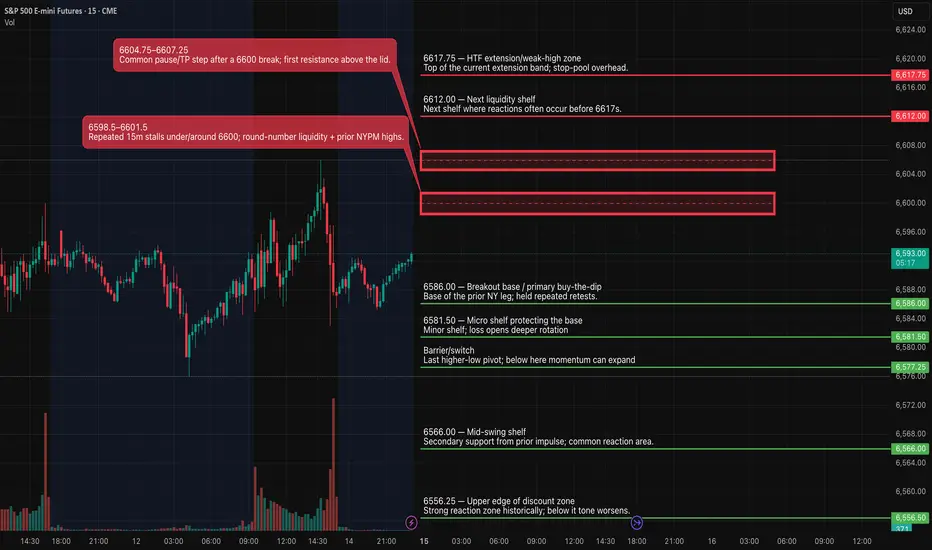
ES (SPX) Futures Analyses for tomorrow Sep 12Overnight
Expect balance 6586–6596 with a modest bullish tilt. If ON accepts >6596.5, drift toward 6603–6606 is likely before NY.
Tomorrow (NY session)
Base case: Early range, then acceptance >6596.5 (close + clean retest) → expansion to 6606 → 6612 → 6616–6619 (HTF extension band).
Failure path: Rejection at 6596–6600 and acceptance <6586 → rotate 6581 → 6577; deeper only if 6577 fails (then 6566/6556).
Fundamentals (times ET)
10:00 — Univ. of Michigan Consumer Sentiment (Prelim, Sep). This is the only major macro print on deck; expect a 2–5m whipsaw around the release, then directional follow-through after displacement.
Today’s context: CPI (Aug) came in +0.4% m/m, +2.9% y/y; Core +0.3% m/m, +3.1% y/y, and Initial Jobless Claims rose to 263k (week ending Sep 6). Together: inflation still sticky but labor softening—into tomorrow this supports “range→up unless 6586 breaks.”
Gold Trading Strategy XAUUSD 11/9/2025Gold Trading Strategy XAUUSD 11/9/2025: Gold is stable, traders prepare ahead of important US CPI data, conditions and technical positions to watch.
Fundamental news: Spot gold prices were generally stable in today's Asian trading session, currently around $3630/ounce. Gold prices are in a wait-and-see mode, closely watching the all-time high before the release of US CPI data for August. Weak US PPI inflation data, fueling speculation that the Federal Reserve will continue its easing cycle at its upcoming meeting in September.
Technical analysis: After making the latest ATH at 3675, gold prices are correcting and forming a short-term downtrend channel in the H1 frame, however, the 3620 - 3625 area is still a good support zone for gold prices. Currently, there will be 2 scenarios with the highest probability of occurrence: Case 1: Gold price will form an upward price pattern around the 3620 - 3625 area and increase sharply, we will wait for the reaction when the price meets resistance at 3660 - 3665. Case 2: Gold price continues to follow the downtrend channel to the lower support area of 3595 - 3600 and then increase again. We will trade based on these 2 scenarios and still prioritize trading according to the main trend.
Important price zones today: 3620 - 3625, 3595 - 3600 and 3660 - 3665.
Today's trading trend: BUY.
Recommended orders:
Plan 1: BUY XAUUSD zone 3620 - 3622
SL 3617
TP 3625 - 3635 - 3645 - 3665 - OPEN.
Plan 2: BUY XAUUSD zone 3598 - 3600
SL 3595
TP 3603 - 3610 - 3630 - 3660 - OPEN.
Plan 3: SELL XAUUSD zone 3663 - 3665
SL 3668
TP 3660 - 3650 - 3640 - 3630 (small volume).
Wish you a safe, effective and profitable trading day.🌟🌟🌟🌟🌟

Gold Price Analysis (XAU/USD): Key Levels and Market OutlookThe price of Gold (XAU/USD) has shown strong upward momentum in recent sessions, crossing above the $3,600 mark and briefly touching the $3,674 level, which represents a strong bullish push supported by significant trading volume (over 581K at that peak).
Current Market Overview
Current Price: $3,646.74 (as of the latest 4H candle)
Resistance Level: $3,674 (recent swing high)
Support Level: $3,640 (recent pullback low)
RSI Indicator: Around mid-range (60), showing neither overbought nor oversold conditions.
The Zig Zag indicator highlights the recent correction after reaching $3,674, where the price retraced slightly to $3,640 before consolidating. The market now trades sideways between these two levels, indicating a short-term indecision.
1. Resistance Zone:
Gold needs to break and sustain above $3,674 to confirm the continuation of the bullish trend. If this happens, the next target could be around $3,700 – $3,750.
2. Support Zone:
On the downside, if the price fails to hold the $3,640 level, a deeper correction towards $3,600 – $3,550 cannot be ruled out.
3. Momentum Indicators:
The RSI is currently neutral, suggesting room for both upside and downside moves. Traders should watch for RSI crossing above 70 (bullish continuation) or dropping below 50 (bearish pressure).
Trading Strategy
Bullish Bias: If Gold holds above $3,640 and breaks $3,674, traders may look for long positions targeting $3,700 and above.
Bearish Bias: A break below $3,640 could trigger short positions, with downside targets near $3,600 and $3,550.
Conclusion
Gold remains in a bullish structure but faces short-term resistance at $3,674. Traders should watch closely for a breakout or breakdown from this consolidation range to determine the next major move.

EURCHF buy setup loooooooooooooooooongHELLO SORRY, for interruption
We have minor downtrend which is broken and caused forming strong demand
this demand zone ,the price respected it and formed sweep then choch and engulfing candle
which indicate uptrend wave

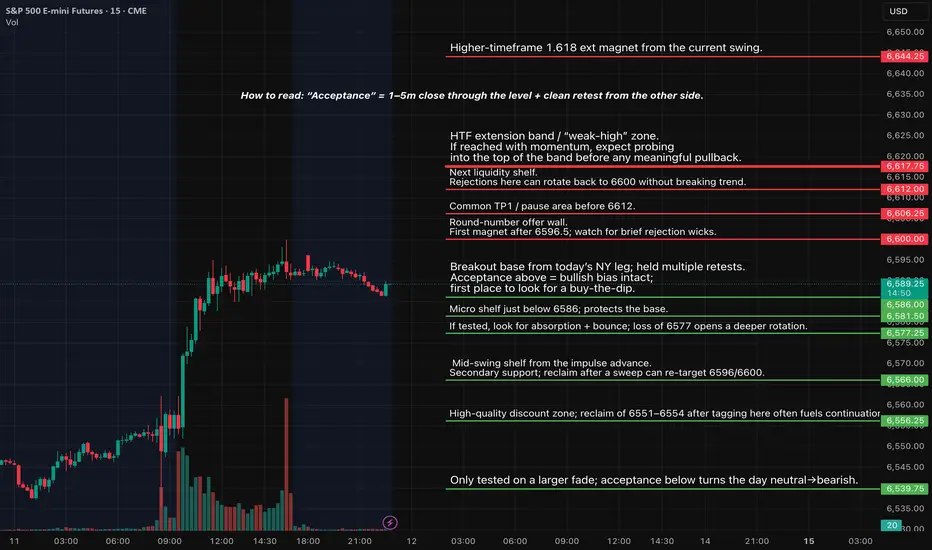
ES1! — Analyses (Sep 10) - Key Zones SeyupsHTF remains bullish into a labeled weak‑high cluster. Tomorrow’s path likely pivots around 6523–6527 (ONH/PDH cluster). Two A++ plays only after event‑led volatility prints structure:
Two possibilities:
Continuation LONG on acceptance > 6537 → 6564/6583.
Fade SHORT on sweep into 6542–6548 + 5m and 15m bearish confirmation → 6526/6510/6502.
SMT check with NQ is required.
Continuation LONG (A++) — “Acceptance > 6537”
Sweep → 5m MSS up → 5m close above 6537 → retest 6531–6533 (derived 5m OB/FVG at prior close shelf) for entry.
Entry: 6532 ±1.
SL: 6524 (structure; back inside PDH/ONH cluster).
• TP1: 6564.25 (1H 1.272) → ~+32.3 pts ≈ 4.0R.
• TP2: 6583.50 (1H 1.618) → ~+51.5 pts ≈ 6.4R.
• TP3: 6668+ (4H fib region) — runner; trail by 15m/30m closes.
Management: Scale ½ at TP1; move to BE only after a 5m close through TP1 or new structure; time‑stop 45–60 min if no progress in a kill zone.
Fade SHORT (A++) — “Sweep 6542–6548”
This is counter‑HTF; require 5m MSS down + 15m bearish close before entry (your rule).
Entry: 6545 ±2 after confirmations.
SL: 6552 (above sweep high/5m OB).
• TP1: 6526.25 (PDH/ONH) → ~19 pts ≈ 2.7R.
• TP2: 6510 (derived 15m demand near VWAP band) → ~35 pts ≈ 5.0R.
• TP3: 6502 (ONL=VAL) → ~43 pts ≈ 6.1R.
• TP4: 6489.25 (PDL) → ~56 pts ≈ 8.0R.
Management: Scale ½ at TP1; move to BE only after a 5m close < 6526 and fresh LTF structure; trail above last 5m swing/VWAP.
Fundamentals (tomorrow — Eastern Time)
• 08:30 — PPI (Aug). BLS schedule confirms Sep 10 @ 08:30.
• 10:30 — EIA Weekly Petroleum Status (energy vol shock risk). Standard release Wednesdays 10:30; PDF posts after 1:00 pm.
• 13:00 — UST 10‑yr (reopening). Treasury’s tentative auction schedule shows Wed Sep 10; competitive close customarily 1:00 pm ET.
• Heads‑up (Thu): 08:30 — CPI (Aug) next day.
• FOMC next week: Sep 16–17.
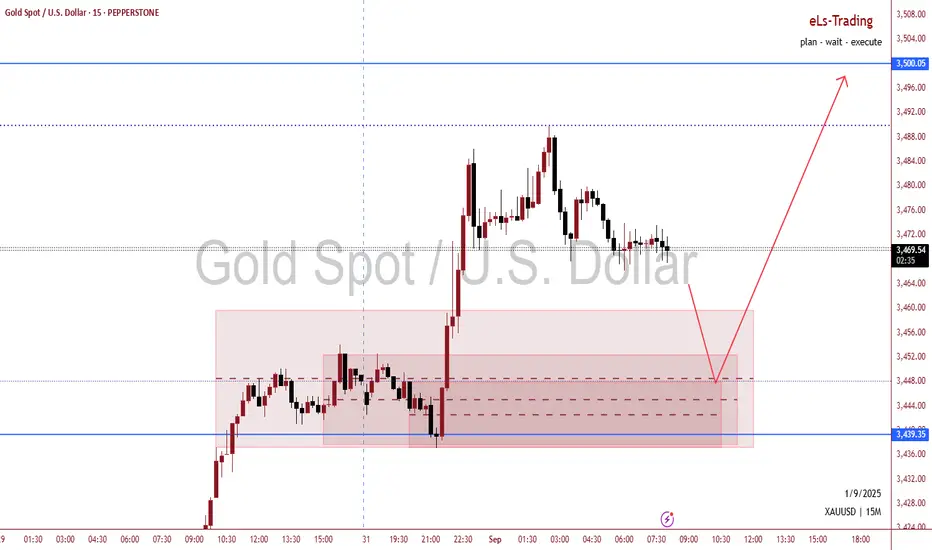
GOLD UPDATE After hitting the target for the buy position , I will sell from the price of 3478 to target the price of 3448, which is a sell position with the presence of a pin bar on the hour, which is a RRR 1:1 because it is against the market trend .
Good Luck

XAUUSD ideaWe are waiting for our asset to reach our action zone, and based on the reaction, we’ll decide on our next moves.ALWAYS WAIT FOR A CONFIRMATION TO SEE IF THE PRICE VALIDATES THE ZONE.and you what is your vision of the EURUSD its interests me! i wait you in the commentar
EURGBP Possible Buy Zone The price action has exhibited sustained bullish momentum over an extended period, with no significant indicators suggesting a potential reversal at this time. As such, we will maintain our bullish bias, identifying key zones for potential buy continuity following recent corrective movements.
Currently, it's prudent to observe the market's reaction in these zones. Alternatively, for those with a higher risk tolerance, entering at these levels could be viable, with stops placed at the extreme swing low of the preceding bullish leg.
Let’s monitor how this scenario unfolds.

Excellent profits delivered XAUUSD As I mentioned in Today’s commentary session:
•i took buy trades at 3375-3376 and I'm expecting market will test 3400 benchmark
if H4-H1 candles flips above 3385-3390 then 3410 then 3420 will be my milestone for intraday.
My strategy was buy the dips from 3375–3378
Very happy with the profits so far I bought GOLD 3375 -3378 –
Always follow your setup & your path with patience and discipline.
My 1st targets 3400 is achieved alhumdulillah.
All I say thanks to those who followed & trust me and made profits.

"Gold 08/27/2025: Will It Correct Deeply or Continue to Surge?"Market Overview
Gold surged on August 26, 2025: Spot gold up 0.5% to $3,382.19/oz (highest since August 11), futures up 0.5% to $3,433/oz.
Driver: President Trump's firing of Fed Governor Lisa Cook over mortgage fraud allegations creates uncertainty, boosting gold as a safe-haven. Bob Haberkorn (RJO Futures): “The Fed is the main driver of gold's price action.”
Fundamental Factors
Fed: Chair Powell signals 0.25% rate cut in September 2025 (87% probability, CME FedWatch).
Economic Data: US durable goods orders down 2.8% (July), better than forecast. Await GDP (Aug 28) & PCE (Aug 29).
Gold Appeal: Attractive in low rates and economic uncertainty.
Technical Analysis
Gold hit Order Block (OB) at 339x, retraced to 337x. Bullish above 337x; break below with bad news triggers Bearish.
Key Levels:
Support: 337x, 3353-3357
Resistance: 339x, 3400-3402
Trading Plan (ICT)
BUY Setups
Scalp Buy:
Entry: 3370-3368
SL: 3365
TP: 3378 / 3388 / 3394
Zone Buy:
Entry: 3357-3353
SL: 3346
TP: 3364 / 3373 / 3381 / 3394 / 3402
SELL Setups
Scalp Sell:
Entry: 3387-3389
SL: 3393
TP: 3379 / 3369
Zone Sell:
Entry: 3400-3402
SL: 3410
TP: 3394 / 3384 / 3371 / 3362 / 3350

Excellent profits delivered by XAUUSD As I mentioned in Today’s early commentary session:
My strategy was buy the dips from 3322-3325
Very happy with the profits so far, Yesterday I captured only 1 trade on buy but gold failed to break above 3350.
I bought GOLD 3322 – 260 PIPS straight TP HIT
•
Always follow your setup & your path with patience and discipline.
My targets is achieved alhumdulillah.
All I say thanks to those who followed us and made profits.
