Fundamental Market Analysis for December 1, 2025 GBPUSDEvent to watch today:
01.12 17:00 EET. USD - ISM Manufacturing PMI
GBPUSD:
Sterling holds above 1.32 amid a softer dollar and a neutral-to-supportive UK backdrop: the impact of the Autumn budget and the OBR’s assessments is largely priced, while the Bank of England appears less inclined to ease early than the Fed. That divergence in policy expectations works against the dollar and underpins demand for GBP.
Additional support comes from moderately positive signals in UK labor and consumer activity, alongside steady gilt yields. A measured risk appetite and the dollar’s softness after benign U.S. data strengthen the short-term momentum in favor of the pound.
Risks relate to potential surprises in U.S. and UK statistics and any shifts in central-bank messaging. Nevertheless, the present configuration of fundamental factors is favorable for further GBP gains if the external backdrop remains neutral.
Trade recommendation: BUY 1.32300, SL 1.32000, TP 1.33200
Analysis

EURUSD Retracement Before Bullish ContinuationQuick Summary
Although the overall outlook remains bullish, the EURUSD may go down first to collect liquidity below the Tokyo Low. This zone aligns with equal lows and a clean order block after, making 1.15855 a strong area for a continuation buy if a clear rejection or choch forms.
Full Analysis
The bullish structure on the EURUSD is still intact, but before continuing upward, the pair may need to sweep the liquidity sitting beneath the Tokyo Low, The area below the Tokyo Low also aligns with equal lows, which naturally attract liquidity and making this zone even more likely to be tested
The level around 1.15855 stands out as a probable point for bullish continuation once liquidity has been taken. However, entering directly at the level is not ideal. It is safer and more effective to wait for a clear sign of reaction such as a strong rejection or a confirmed choch on a lower timeframe. These signals help validate that the market is ready to shift from sweep to expansion upward.

Gold market {Trend Analysis}Last week we saw gold buy up to 4200's after a delayed bullish momentum until the close of last week's candle. Gold extended its bullish strength up till the 4220's where we closed off for last week. This week we saw gold continue on its bullish sentiment up till the 4250's before the ongoing bearish retracement.
fOLLOWING THE ANALYSIS, we see that gold mitigated its 50% trend channel on the 4hour time-frame before the bearish turnaround back to the 4220's. A break below this zone insinuates more lower liquidity grab back to the 4100's.
Further updates would be given as the market gains momentum

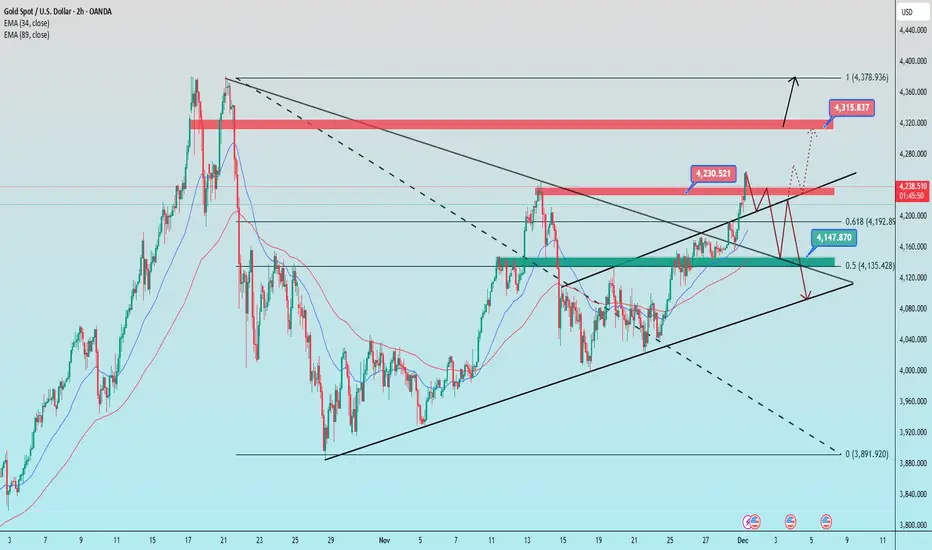
How did gold move in the first week of December? CONCISE & COMPREHENSIVE TECHNICAL ANALYSIS
1. Trend Lines
Ascending trend line (lower black line)
This is the main dynamic support of the current uptrend structure.
The price has bounced off this trend line several times → the short-term trend remains bullish as long as this line is not broken.
Major descending trend line (upper black line)
This is strong dynamic resistance on larger time frames, and the price recently touched this area.
This is an area where selling pressure frequently arises.
2. Support – Resistance
Resistance
4,243–4,245 (red zone):
This is the confluence of the previous peak and the descending trend line → selling pressure appears right in this area.
4,315–4,320 (next major resistance):
If this area is broken, the price will likely head towards 4,375–4,380.
Support
4.147–4.150 (green zone confluence):
Confluence of moving averages, the nearest swing low, and Fibonacci levels → important support that maintains the bullish structure.
4.105–4.120 (lower trendline):
If the price breaks through this area → the short-term trend has the potential to turn bearish.
3. Fibonacci
Fibonacci 0.618 = 4.194
→ Area with a high probability of a rebound if the price corrects.
Fibonacci 0.5 = 4.135
→ Confluence with strong support + trendline → potential buy zone if a deeper pullback occurs.
4. Price Scenarios
Scenario 1 – Continue Upward (Priority)
If the price remains above 4,200–4,215, there is potential for a retest:
➡️ 4,230 → 4,315 → 4,375
Scenario 2 – Downward Correction
If the price breaks through 4,190 and breaks through the green zone of 4,144–4,150, then:
➡️ Risk of a downward movement towards the 4,105–4,120 trend line
📌 Trading Plan
BUY GOLD: 4,148 – 4,250
Stop Loss: 4,138
Take Profit: 100–300–500 pips
SELL GOLD: 4,313 – 4,315
Stop Loss: 4,325
Take Profit: 100–300–500 pip
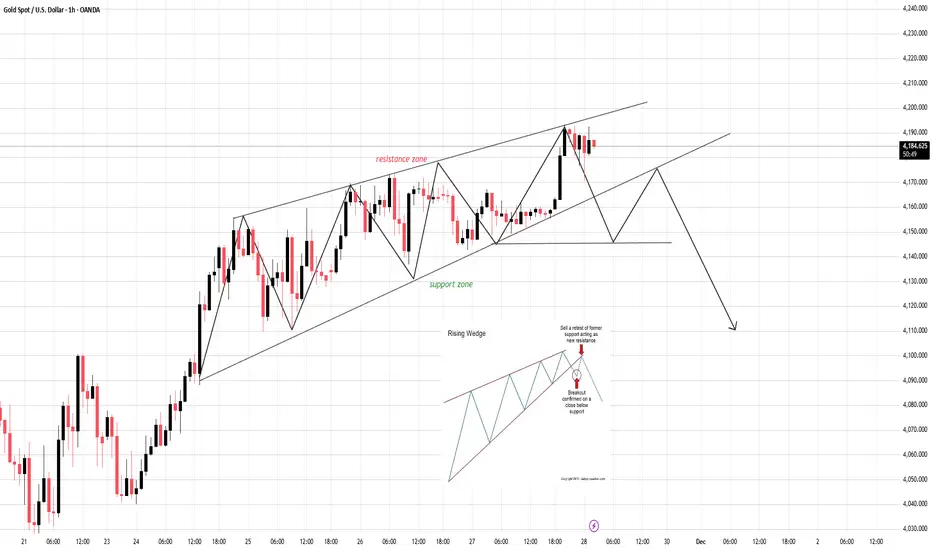
Rising Wedge on the Edge — The Breakdown Is Only One Candle AwayCURRENT MARKET ANALYSIS & TODAY’S EXPECTED MOVE
1. Current Market Structure
The market is currently respecting the structure of a Rising Wedge — a pattern where price continues rising but momentum weakens, volatility compresses, and the probability of a bearish breakdown increases.
Key observations:
- Price is moving near the upper boundary of the wedge.
- Newly formed highs lack strength → buying pressure is fading.
- Recent candles show long upper wicks, indicating strong sell pressure at resistance.
- The lower support line has been tested multiple times, increasing the likelihood of a breakdown.
- Buyers are losing control while sellers are beginning to step in.
2. Primary Scenarios for Today
✓ Scenario 1 – Breakdown of the Rising Wedge (High-probability scenario)
If a candle closes decisively below the lower support, the market is likely to:
- Drop quickly toward the next support levels.
- Trigger strong seller participation on the retest of the broken trendline (support → resistance).
- Confirm a high-quality SELL entry.
Downside Targets:
- Target 1: Nearest support zone
- Target 2: Previous low of the wedge
- Target 3: Major support below (depending on your timeframe)
✓ Scenario 2 – Price holds but remains weak
If price bounces from the lower edge but fails to break the upper boundary:
- The structure remains weakly bullish but vulnerable.
- Any upward move is fragile and easy to reverse.
- Not suitable for chasing BUY positions.
- Bulls need a strong breakout above the upper trendline to reverse the bias — which currently has a lower probability.
3. Intraday Trend Bias
Today’s intraday bias remains: DOWN (or at least corrective to the downside).
Confirmation signs:
- Support becomes easier to break the more it is tested.
- Volume is weak on bullish moves.
- Price action is tightening → preparing for a breakout.
- Sellers will wait for a clean retest, as shown in your reference chart.
4. Conclusion
The market is approaching the end-phase of a Rising Wedge, a classic bearish reversal pattern.
Priority today: Wait for breakdown → retest → SELL.
Avoid chasing BUY setups due to high reversal risk.
Expected development:
Break support → Retest → Continue dropping
“Your edge is built from discipline — not every setup must be traded, but every trade must follow your plan.”
Drop your market bias in the comments — do you expect the breakdown or a surprise breakout?
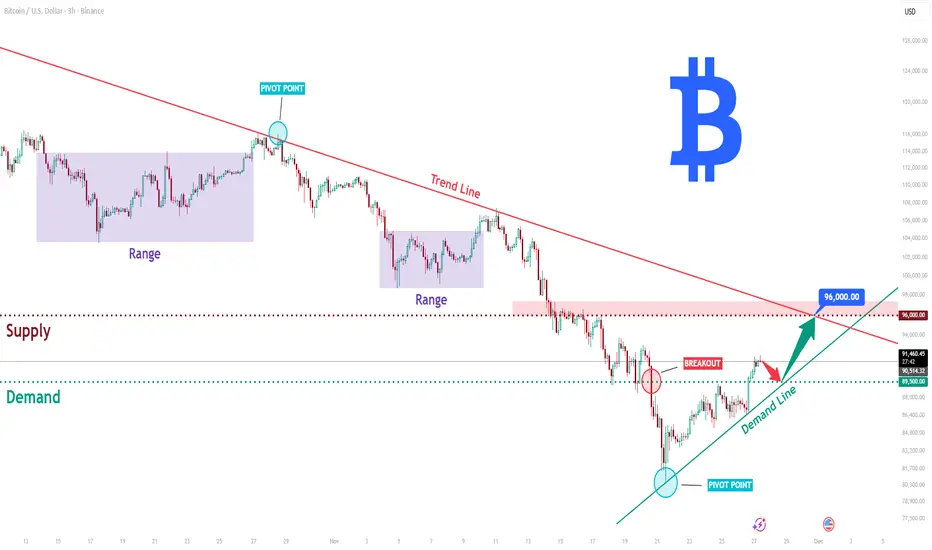
BTCUSD Long: Compression Near Trend Line, Possible Move to $96KHello, traders! BTCUSD continues to move within a broader descending structure, where the price has consistently respected the major downward trend line. Each approach to this trend line has resulted in a new lower high, confirming seller control in the medium-term outlook.
Currently, after the decline, Bitcoin tested the Demand Zone around $89,500, where buyers formed an important pivot point, triggering a noticeable upward impulse. This reaction confirmed strong demand and pushed the price toward the key compression area between the Demand Line and the main descending Trend Line.
My scenario, if buyers maintain pressure and break above the descending trend line, BTCUSD may extend its bullish correction toward the $96,000 supply zone. However, if the demand level fails to hold, this scenario becomes invalid, opening the path toward deeper support levels. Manage your risk!
XAUUSD: Channel Push Points to $4,220 as Next TargetHello everyone, here is my breakdown of the current Gold setup.
Market Analysis
Gold remains in a broader bullish structure, but the recent price action is developing inside a well-defined ascending channel, where price is currently moving from the lower boundary toward the upper one. After a sharp correction, XAUUSD found strong support at the $4,040 level, which aligns with the bottom of the channel and produced a fake breakout, signaling lack of bearish continuation.
Currently, price has started a new upward swing, respecting both the channel structure and the mid-line trend dynamics. However, despite the recovery, XAUUSD is still trading below the major $4,220 resistance, which previously acted as a strong reaction zone and remains the key obstacle for buyers.
My Scenario & Strategy
My scenario is bullish, as long as price stays above the support zone around $4,040 and maintains structure inside the ascending channel. I expect Gold to continue climbing toward the $4,220 resistance, where the upper channel boundary also converges, forming a strong confluence area.
Therefore, a clean breakout above $4,220 would open the way for higher targets and continuation of the broader trend. However, if price reaches this zone and shows strong rejection or weakness, we may see a pullback into the channel — but the bullish structure remains intact as long as the lower boundary holds. For now, the market supports a long bias, with the key objective being a retest of the $4,220 resistance zone, which is the next major level buyers are aiming for.
That's the setup I'm tracking. Thank you for your attention, and always manage your risk.

EURUSD Downside Outlook: Price Eyes Retest of 1.1540 Buyer ZoneHello traders! Here’s my technical outlook on EUR/USD based on the current market structure. After testing the Seller Zone near 1.16000–1.16200, the price once again faced rejection, forming a fake breakout around the descending Resistance Line. This confirms that sellers are still defending this area and keeping the pair inside a broader bearish structure. From there, EUR/USD pulled back toward the Buyer Zone, located between 1.15400–1.15000, which has acted as a reliable support area multiple times. The market is now moving inside a corrective pattern, showing weakening bullish momentum as it approaches support. As long as the pair trades below the Seller Zone and the descending trendline, bearish pressure remains dominant. The chart suggests a likely continuation toward the TP1 target at 1.15400, where buyers previously stepped in and produced notable recoveries. A clean bounce from this zone may trigger another short-term bullish correction — but without a breakout above 1.16000, any upside is likely to remain limited. A breakdown below 1.15400 could open the way for deeper declines toward lower support levels, while a confirmed breakout above the Seller Zone would shift short-term sentiment. Please share this idea with your friends and click Boost 🚀

EURUSD Bullish Setup After Corrective Drop Toward 1.15364Quick Summary
EURUSD may retrace lower toward 1.15364 on the H4 chart. This zone is expected to act as a potential demand area and could offer a buying opportunity, but only if the price shows a clear rejection signal or the price left a liquidity void behind that supports a bullish reaction
Full Analysis
On the H4 timeframe, EURUSD appears to be setting up for a corrective move to the downside before potentially resuming its upward structure. The level around 1.15364 stands out as an important zone where buyers may step back in, as it aligns with previous demand
However, the entry from this area isn’t confirmed yet
If price reaches the zone gradually and forms a strong rejection candle or any clear reaction that shows buyers absorbing liquidity, this could offer a clean long setup
On the other hand, if the market drops sharply into the level... and left a liquidity void behind that type of move can often produce a stronger bullish bounce, making it a valid buying point as well, provided there is a visible reaction

EURUSD Bullish Continuation Toward Key Sell ZoneQuick Summary
EURUSD is showing strong bullish momentum and is expected to continue rising toward 1.15715, where a potential sell setup may form pending a clear rejection trigger.
A secondary confirmation for selling comes from GBPUSD, which must break the 1.31559.
Full Analysis
Continuing the broader outlook on EURUSD, the recent upward movement is developing in a healthy and structurally consistent manner. The bullish progression indicates strong buy program, and as long as price maintains its higher-low structure, the market remains poised to reach the next significant level at 1.15715.
This area represents a notable reaction point where sellers may step in, making it a potential short opportunity. However, the sell setup should only be taken with a clear trigger, such as a sharp wick rejection, or a shift in short-term market structure. Without confirmation, price may simply sweep liquidity and continue higher.
An additional layer of confluence comes from GBPUSD.
If GBPUSD breaks 1.31559, this would signal of weakness.this will create a much stronger environment for EURUSD to form a valid sell reaction from 1.15715.

Will gold prices rise again in the new week?1️⃣ Trendline
Long-term descending trendline (upper black line)
Price has strongly broken above the long-standing descending trendline.
→ This signals a transition from a bearish phase to a medium-term bullish trend.
Short-term ascending trendline (small channel)
Price is moving inside a short-term ascending channel, consistently forming higher lows.
The recent breakout came with strong momentum → bullish strength is currently dominant.
2️⃣ Support – Resistance
Key Support Levels
4,111 – 4,108:
A confluence zone of the ascending channel’s bottom, EMA, and the 0.618 Fibonacci level → strong support if price pulls back.
4,145 – 4,150:
This is the breakout zone and will act as a retest support if price revisits it.
Key Resistance Levels
4,238 – 4,245 (Fibo 1.618 + previous structure high)
→ First major resistance zone. Price may consolidate or shake before breaking through.
4,375 – 4,380 (Fibo 2.618 + major upper zone, ATH area)
→ Large upside target if price breaks and holds above 4,245.
3️⃣ Fibonacci
The current upward swing is targeting the 1.618 Fibonacci extension at 4,238 – 4,245.
If this zone is broken and price closes above:
→ Next extension target is 2.618 Fibonacci near 4,375 – 4,380.
4️⃣ Trend Outlook
Trend: Short-term bullish → shifting to medium-term bullish after breaking the major descending trendline.
Key level to hold:
Above 4,145–4,150 = bullish continuation.
Upside targets:
4,238 – 4,245
4,372 – 4,380 (if bullish momentum continues)
Trading Plan
BUY GOLD: 4111 – 4108
Stop Loss: 4098
Take Profit: 200 – 400 – 700 pips
SELL GOLD: 4278 – 4281
Stop Loss: 4291
Take Profit: 200 – 400 – 700 pips

ETH/USDT (4H Timeframe)The chart shows Ethereum’s price action on the 4-hour timeframe with key supply–demand zones, structure levels, and an active long setup.
1. Market Structure
ETH has been in a downtrend, forming lower highs and lower lows, but recently it created a short-term bullish reversal from the demand zone near $2,880–$2,950.
Price broke a small internal structure high (marked “XX-Liquidity”), indicating potential short-term bullish strength.
2. Key Zones
Major Supply Zone (Upper Blue Box):
Around $3,360–$3,414 — a strong resistance area where price previously dropped heavily.
Major Demand Zone (Lower Blue Box):
Around $2,888–$2,949 — where price had a strong bullish reaction.
3. Order Block (OB+)
A bullish order block is marked just below the current price (~$3,000).
Price is pulling back into this OB, suggesting possible bullish continuation if it holds.
4. Current Position Setup
There is a highlighted long trade zone from the OB, targeting the $3,257–$3,257+ region.
Entry appears near $3,000, SL below the OB, and TP at the previous major structure high.
5. Price Reaction
ETH is hovering around $3,003, testing the order block for liquidity.
If OB holds, price may push toward the target zone. If broken, price may revisit the demand zone at $2,880–$2,940.

GOOGL Stock Forming a BIG Pattern — Key Levels You MUST Watch!In this video, I break down a clear chart pattern forming on GOOGL (Alphabet) stock, using detailed technical analysis.
You’ll see exactly how the pattern developed, what levels matter right now, and where the stock could move next.
🔍 What’s Covered in This Analysis:
GOOGL’s current chart structure
Clear pattern formation (triangle / channel / flag / wedge — based on your chart)
Key support & resistance zones
Breakout / breakdown levels
Trend strength and momentum
Short-term price targets
Medium-term technical outlook
Risk levels & invalidation points
📈 Why This Matters
Alphabet (GOOGL) is showing a highly tradable technical setup, and understanding this chart pattern can help you spot the next big move before it happens.
Perfect for:
Day traders
Swing traders
Long-term technical investors
Anyone following large-cap tech stocks

Bank holiday what will gold price be on 28 november 2025?1️⃣ Trendline
Ascending Trendline (red channel)
Price is moving inside a short-term ascending channel, forming higher highs and higher lows.
Recently touched the upper boundary → a technical pullback toward the lower boundary is likely.
Descending Trendline (red dotted)
This is a dynamic resistance from the higher timeframe.
Price has just broken above it; a retest is normal → creating a strong confluence area.
2️⃣ Key Support & Resistance
Resistance
4,240 – 4,245 (Fibo 1.618 + major supply zone)
→ This is the upside target if price continues to hold within the ascending channel.
Support 1 (nearest)
4,165 – 4,170 (trendline + MA + previous consolidation zone)
→ This zone is crucial for maintaining the bullish structure.
Support 2 (stronger)
4,095 – 4,112 (Fibo 0.5 – 0.618 + broad demand zone)
→ If Support 1 breaks, price may retrace deeply into this area.
3️⃣ Fibonacci Levels
Fibo 1.0 at 4,162 → currently the main retest point.
Fibo 0.618 at 4,111 → strong confluence with the major demand zone.
Fibo 1.618 at 4,245–4,255 → matches the top resistance → primary bullish target if the trendline holds.
4️⃣ Scenarios
Bullish Scenario (preferred)
If price holds above 4,165 – 4,170
→ it continues following the ascending channel → target 4,240 – 4,245.
Bearish Scenario
Break of the trendline + candle close below 4,165
→ confirms a correction phase → price likely moves down to 4,109 – 4,105.
Trade Ideas
BUY GOLD:
4165 – 4162
Stoploss: 4152
Take Profit: 100 – 300 – 500 pips
SELL GOLD:
4240 – 4243
Stoploss: 4250
Take Profit: 100 – 300 – 500 pips

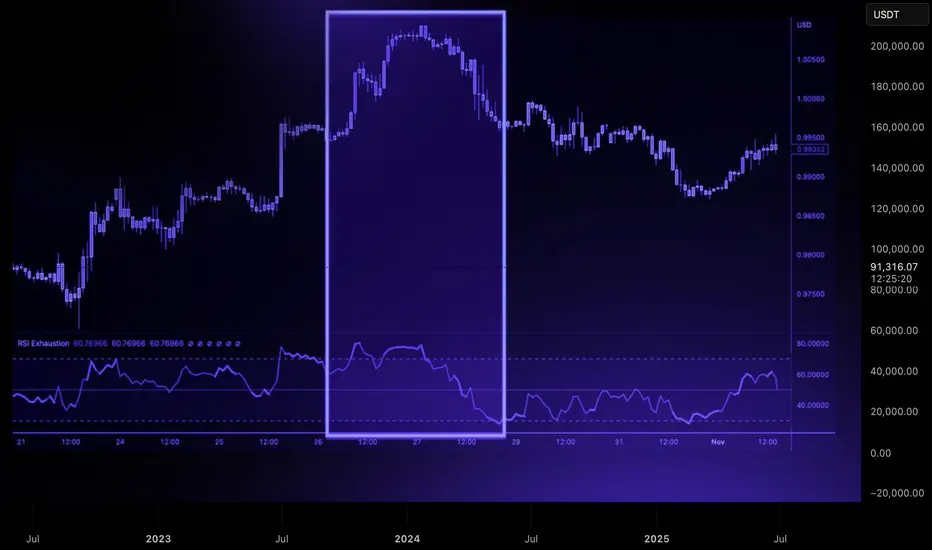
Trend Exhaustion: How to Spot a Reversal Before It HappensReversals rarely start with dramatic candles. They begin quietly, through subtle shifts in momentum and structure that most traders overlook.
A strong trend doesn’t collapse all at once. It loses strength in stages, and those stages are visible long before price turns in the opposite direction.
The first sign of exhaustion is weakening impulse strength. In a healthy trend, impulsive moves are clean and decisive, and retracements are controlled. When each new push produces smaller higher highs or lower lows, it signals reduced participation.
Buyers or sellers are still present, but the force driving the trend is fading.
The second clue lies in how price interacts with liquidity. Strong trends break key levels with conviction. Exhausted trends start reaching above highs or below lows only to reject immediately.
These sweeps show that the market is clearing liquidity without gaining follow-through, often trapping late entries and signaling that larger players are offloading positions.
A third indication appears when structure begins to fracture. An uptrend losing its higher-low sequence or a downtrend failing to maintain lower highs is a shift in narrative. A single break is not confirmation, but when it aligns with slowing impulses and liquidity failures, momentum is clearly changing.
Volatility then begins to compress. Candle ranges shrink, movement becomes less directional, and price enters a tightening pattern.
This compression often precedes expansion in the opposite direction. When a decisive candle breaks out of this cluster, the reversal typically accelerates.
Trend exhaustion is about recognizing when the conditions that supported continuation no longer exist.
By reading momentum, liquidity, and structure together, you can anticipate shifts earlier, manage risk more effectively, and position yourself on the right side of the next move.
Gold Buyers Regain Momentum — Aiming for 4,240 RetestHello traders! Let’s break down the current XAUUSD structure. Gold is trading within a broad ascending structure after forming a strong local bottom around the Support Line, where buyers entered the market and started to push the price higher. This upward movement follows a long corrective phase, during which the price respected the diagonal Support Line multiple times — confirming the presence of a stable bullish trend. Earlier, XAUUSD broke out of the Buyer Zone (4,110–4,120), retested it, and successfully held above it. This zone now acts as a key demand area and the primary level where buyers continue defending the trend. A previous bearish attempt failed here, forming a fake breakout and leading to a new bullish impulse. The price is now approaching the descending Resistance Line, which has repeatedly pushed gold lower during the recent correction. A clean breakout above this trendline may open the way for the price to move toward the major Resistance Level at 4,240.00, which also aligns with the first take-profit area (TP1). This Resistance Level has acted as a strong reaction zone multiple times, causing sharp pullbacks and marking the boundaries of the Seller Zone. Buyers will likely face significant opposition here once again. If gold respects the Buyer Zone and maintains trading above 4,110, the bullish scenario remains intact, and the price may push toward TP1 → 4,240. A confirmed breakout above this level would signal continuation toward higher targets within the broader bullish structure. However, if XAUUSD fails to hold the Buyer Zone and breaks below 4,110, the bullish outlook becomes invalid. In this case, the price may revisit the lower trendline or enter a deeper correction toward previous support areas. For now, the structure remains moderately bullish, with buyers dominating as long as the price stays above demand and respects the ascending Support Line. Please share this idea with your friends and click "Boost" 🚀

EURUSD Approaching a Key Buy ZoneQuick Summary
EURUSD is approaching a potential buy zone near 1.15370 where the pair is expected to take liquidity below the low at 1.15474 before showing a bullish reaction The likely target after the rebound is the break of the descending trendline on the H4 timeframe with the demand zone aligning with the 61 Fibonacci level
Full Analysis
The pair is gradually moving toward an important area around 1.15370 This zone represents a potential point where strong buying pressure may appear The current movement seems focused on collecting liquidity below the low at 1.15474 and once this liquidity is taken the probability of a bullish reaction becomes higher
If the price reacts from this level the next objective will be a move toward breaking the descending trendline on the H4 timeframe This scenario aligns with a previously formed demand zone and converges with the 61 Fibonacci level which adds more strength to the bullish continuation outlook
The main focus now is to wait for a clear reaction from the 1.15370 zone Whether it appears as a strong bounce or a shift in control toward buyers this area is likely to play a key role in guiding the next move of the pair

Fundamental Market Analysis for November 28, 2025 EURUSDThe euro is fluctuating near 1.16 after a series of mixed signals: in the euro area, focus is on flash inflation readings in Germany and a broader data block, while the ECB maintains a cautious tone ahead of the December meeting. Comments from Governing Council members indicate it is premature to discuss further easing while core price pressure remains above target, and short-term liquidity is reflected in €STR without signs of a sharp loosening in conditions. Against a modest uptick in U.S. Treasury yields, interest in the dollar is supported, which caps the euro’s upside.
In the U.S., after the short holiday week, the policy path is being reassessed: markets are reluctant to bring forward expectations of rapid Fed easing as some recent macro indicators point to resilient consumption and labor demand. That keeps the dollar from weakening further and pushes participants to cautiously take profits on long-euro positions. An additional factor is cross-asset rotation into dollar assets amid ongoing fiscal risks in several EU countries.
The current setup favors a tactical pullback in EURUSD: neutral ECB communication alongside steady U.S. data supports the dollar around 1.16. Against this backdrop, we prefer selling from 1.15950 with a stop at 1.16250 and a target at 1.14950—the idea rests on the balance of fundamental drivers and the likelihood of flows into defensive assets if sentiment deteriorates.
Trade idea: SELL 1.15950, SL 1.16250, TP 1.14950

EURUSD Long: Upside Pressure Targets Retest of 1.1610 LevelHello traders! EURUSD is forming a clear technical structure after reacting precisely to both the Supply and Demand levels, creating a clean sequence of trend shifts and breakout points. Earlier, the pair moved inside a strong Descending Channel, where each retest of the upper boundary produced sharp bearish impulses. This confirmed that sellers were fully in control during that phase. A breakout from the channel led to a short consolidation Range, showing temporary buyer accumulation before a trend reversal. Following this accumulation, EURUSD entered an Ascending Channel, where price consistently made higher highs and higher lows. Multiple breakouts occurred along the way, showing how buyers gained strength while defending each pullback. However, an important Fake Breakout near 1.1570 revealed that bullish momentum was still fragile, and price slipped back into the channel before resuming the upward movement.
Currently,, the market formed a clear Inverse Head and Shoulders reversal pattern at the bottom, located directly inside the 1.1500–1.1520 Demand Zone. This zone acted as a major support cluster, generating strong bullish reactions. After confirming the neckline breakout, EURUSD rallied aggressively toward the current structure. At the moment, price is pushing higher and approaching the 1.16100 Supply Zone, which has repeatedly acted as resistance in previous market swings. This level is now the main obstacle for bulls and the next key reaction zone.
My scenario as long as EURUSD remains above the 1.15700 Demand Zone, the bullish trend structure remains intact. A continuation toward the 1.16100 Supply Zone (TP1) is the most likely scenario. This level is expected to create the next significant reaction, as it aligns with previous selling pressure. A clean breakout above 1.16100 would reinforce the bullish momentum and open the path toward the next upside levels. However, if EURUSD rejects the supply area, a pullback toward 1.15700–1.15500 may occur before buyers attempt another upward move. Only a breakdown below the demand zone would weaken the bullish outlook and shift momentum back toward sellers. For now, the market favors buying pullbacks into demand while monitoring reactions closely at the 1.16100 resistance. Manage your risk!

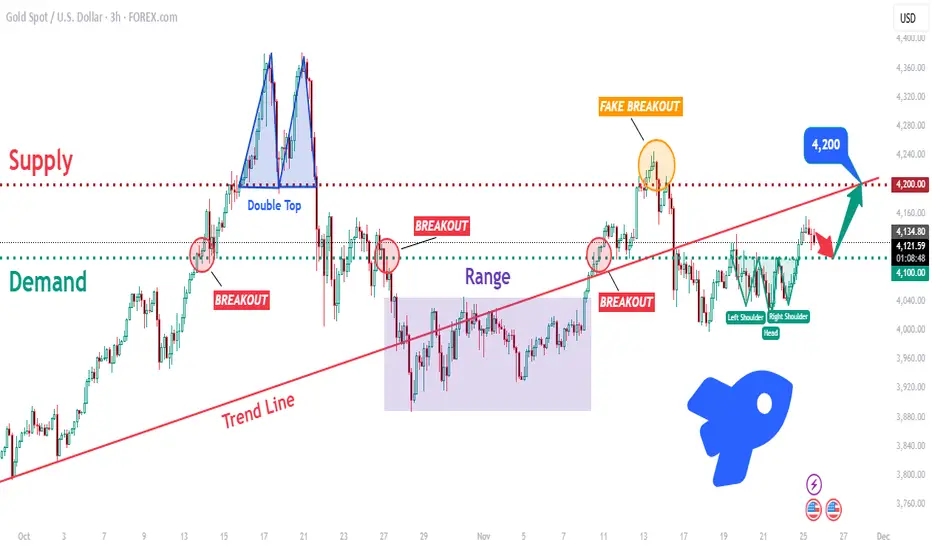
XAUUSD: Bulls Defend 4100! Is a Breakout to 4220 Imminent?Hello traders! XAUUSD continues to trade within a broader bullish structure, but with repeated volatility around key zones. The chart highlights how Gold has reacted multiple times to the major Demand Zone near 4,100, which has consistently acted as a strong support area. Each dip into this zone triggered a bullish response, confirming active buyers. Earlier in the structure, price formed a clear Double Top inside the Supply Zone around 4,220–4,230, which led to a strong bearish reversal and a breakdown below the trend line. After that, Gold entered a prolonged Range Phase, where the market consolidated sideways before breaking out to the upside. Recently, XAUUSD attempted a bullish continuation, but the move resulted in a Fake Breakout above the supply zone, signaling that buyers lacked the strength to maintain momentum above 4,220. This rejection pushed price downward and back below the main Trend Line, which now acts as dynamic resistance.
Currently, Gold is trading above the 4,100 Demand Zone, forming a potential Inverse Head and Shoulders pattern — an early sign that buyers may be preparing for another upward push. As long as price holds above 4,100 and stays above local structure, the bullish scenario remains valid.
My scenario, if XAUUSD holds above the 4,100 Demand Zone, buyers may gain momentum and attempt another breakout toward the 4,200–4,220 Supply Zone, which is the next major resistance and the primary upside target. A sustained break above 4,220 would confirm bullish strength and could open the path toward higher continuation targets. However, if buyers fail to hold the 4,100 level, Gold may drop back into the previous range or retest lower support areas before attempting another reversal. For now, the bias is moderately bullish, supported by demand reactions and reversal patterns — but a confirmed breakout above 4,200 is needed for stronger trend continuation. Manage your risk!
BTCUSD: Buyers Preparing for a Move Toward $90,000Hello everyone, here is my breakdown of the current Bitcoin setup.
Market Analysis
BTCUSD continues to recover after a prolonged downtrend, where the market consistently respected the descending Trend Line and formed a series of Range structures. Each range acted as a consolidation phase inside the broader bearish movement, with multiple breakdowns continuing the trend to the downside. Despite occasional bullish breakouts, none of them were strong enough to reverse the bearish structure, leading to further declines. Eventually, price reached the Support Zone around $84,000–$85,000, where the market produced a fake breakdown, signaling initial buyer activity. This fake breakout formed a local bottom that became the base for a reversal attempt. Following this reaction, BTCUSD began forming an Upward Channel, marking a shift in market structure from bearish to early-stage bullish. Inside this channel, price has started to create higher highs and higher lows—an essential signal of growing bullish momentum. The structure remains clean and technical: every pullback respects the lower boundary of the channel, while short impulses are reaching toward the midline of the structure. Buyers are gradually gaining control.
Currently, BTCUSD is stabilizing above the Support Zone while trading near the lower half of the ascending channel. As long as price respects this channel structure, sentiment remains bullish. The key area ahead is the Resistance Zone around $90,000, which previously acted as a pivot point and rejected bullish attempts multiple times. A clean breakout above this zone would confirm broader bullish strength.
Scenario & Strategy
I expect BTCUSD to continue moving inside the Upward Channel, gradually approaching the $90,000 Resistance Zone. A retest of this area is the most probable outcome if buyers maintain control. Short-term corrections may occur as the price approaches resistance, but overall structure favors a bullish continuation. A confirmed breakout above $90,000 could trigger a stronger move toward higher targets, opening the way for a larger trend reversal. This level remains the key barrier for buyers in the short and medium term.
However, if BTCUSD breaks down from the Upward Channel and falls below the $84,000 Support Zone, the bullish scenario becomes invalid. Such a move would likely signal a deeper correction or a return to bearish conditions. For now, buying the dips within the channel remains the more favorable approach as long as the structure stays intact and buyers continue defending support.
That's the setup I'm tracking. Thank you for your attention, and always manage your risk.

BTC Rebounds From 85K Support — Rally Toward 93K ResistanceHello traders! Let’s take a look at BTCUSD (Bitcoin). BTCUSD continues to trade within a broader corrective structure after a long bearish decline. Earlier, the market formed a large descending wedge, where price consistently respected both the Resistance Line and the Support Line. After the breakout from this wedge pattern, Bitcoin briefly turned bullish but soon entered a sideways Range, showing indecision and weakening momentum. The Range eventually broke to the downside, sending BTCUSD directly into the Seller Zone around $93,000, a key area that triggered several strong rejections in the past. A clean retest of this zone confirmed bearish pressure, leading to another impulsive drop. During the decline, price briefly pushed below the Support Zone near $85,000, creating a fake breakout, which trapped sellers and sparked a strong bullish reaction. From this point, buyers gained control and pushed price into a new ascending structure, supported by a rising Support Line shown on the chart. This indicates a shift in short-term momentum, with BTCUSD now forming higher highs and higher lows. Currently, Bitcoin is approaching the $93,000 Resistance Level, which aligns with the upper boundary of the previous Seller Zone. This is the key barrier for buyers. If price manages a clean breakout above this level, bullish continuation toward higher resistance zones becomes likely. As long as BTCUSD holds above the ascending Support Line and the $85,000 Support Area, the outlook remains bullish in the short term. From my perspective, BTCUSD is showing a short-term bullish continuation setup, supported by the ascending Support Line and the strong rejection from the $85,000 demand zone. If BTCUSD breaks back below $85,000, the bullish scenario becomes invalid, and a deeper correction could follow. For now, market structure supports a bullish recovery as long as buyers defend support and maintain the ascending trend. Please share this idea with your friends and click Boost 🚀

AUDJPYHello Traders,
We are waiting for a confirmation from CPI news! Any big surprise means we should not trade against it!
This is out Daily Chart!
A bullish chart it really is!
We are searching for middle of the channel to react!
The trend-line could be used as Liquidity hunt!
