XAUUSD Long: Demand Zone Holds, $4,540 in SightHello traders! Here’s a clear technical breakdown of XAUUSD based on the current chart structure. Gold previously completed a corrective phase after breaking above a descending resistance line, which marked a shift in market control from sellers to buyers. Following this breakout, price entered a consolidation Range, where the market absorbed supply and built a base before the next impulsive move higher. After leaving the range, XAUUSD accelerated into a strong bullish leg and formed an ascending channel, confirming sustained buying pressure. The breakout above the channel base was decisive, and price continued to print higher highs and higher lows. Recently, gold reached the Supply Zone around 4,500, where selling pressure appeared and caused a short-term rejection. This reaction pushed price back toward the Demand Zone near 4,430, which aligns with the channel support and previous breakout structure.
Currently, price is pulling back in a controlled manner within the bullish channel. The rejection from supply looks corrective rather than impulsive, suggesting profit-taking instead of trend reversal. Buyers are expected to defend the demand area as long as the channel structure remains intact.
My scenario: as long as XAUUSD holds above the 4,430 Demand Zone, the bullish structure stays valid. A strong reaction from this area could lead to another push toward the 4,500 Supply Zone, with a potential continuation toward 4,540 if a clean breakout occurs. A decisive breakdown below demand would invalidate the bullish setup and signal a deeper correction. For now, the bias remains bullish while price respects the ascending channel. Manage your risk!
Analysis

EURUSD: Bullish Structure Holds Inside Upward ChannelHello everyone, here is my breakdown of the current EURUSD setup.
Market Analysis
EURUSD has confirmed a bullish structure after breaking out of the previous Downward Channel. This breakout shifted market control to buyers and initiated a steady move higher. Price is now trading within a well-defined Upward Channel, forming higher highs and higher lows, which supports the bullish trend.
Recently, EURUSD pulled back from the Resistance Zone near 1.1800 and found support around the 1.1750–1.1760 area. This zone aligns with the channel support and previous breakout structure, showing strong buyer interest. Current consolidation above support suggests continuation rather than reversal.
My Scenario & Strategy
My primary scenario remains bullish as long as EURUSD holds above the Support Zone around 1.1750. The recent pullback looks corrective within the broader uptrend. I expect price to resume its upward move and push toward the upper boundary of the Upward Channel, 1.1840 - 1.1850 as the next key target.
A clean breakout and acceptance above 1.1800 would confirm trend continuation and open the door for further upside expansion. However, a sustained breakdown below 1.1750 would weaken the bullish setup and could lead to a deeper correction. For now, the structure favors buyers, with support holding and momentum aligned with the prevailing uptrend.
That's the setup I'm tracking. Thank you for your attention, and always manage your risk.

BTCUSDT Holds Support - Retest of 88,900 Resistance LikelyHello traders! Here’s my technical outlook on BTCUSDT (2H) based on the current chart structure. Bitcoin is trading within a broader recovery phase after a prolonged corrective move. Earlier, price formed a base and broke out of a consolidation range, signaling that selling pressure was weakening and buyers were regaining control. Following the breakout, BTC pushed higher but faced resistance near 88,900, where selling pressure emerged and caused a pullback. Price then retraced toward the 87,300 Support Zone, which aligns with the previous breakout area and acts as a key demand level. The reaction from this zone remains constructive, suggesting the pullback is corrective rather than impulsive. Structurally, price continues to respect a rising support line, while attempts to break above resistance are ongoing. My scenario: as long as BTC holds above the 87,300 Support Zone, the bullish recovery remains intact. A strong reaction from support could lead to another push toward the 88,900 Resistance (TP1). A confirmed breakout above this level would open the door for further upside. A breakdown below support would signal a deeper correction. For now, the focus remains on the 87,300 support. Please share this idea with your friends and click Boost 🚀

EURUSD Bearish Continuation After Liquidity SweepQuick Summary
EURUSD swept liquidity at 1.18022 and reacted immediately to the downside This move is known as turtle soup and supports further bearish continuation The next downside objective is 1.17438 after that price reaction will be reassessed
Full Analysis
EURUSD recently performed a clear sweep of liquidity at the high around 1.18022 Price reacted immediately after taking this liquidity which confirms the turtle soup concept and strengthens the bearish bias
The impulsive rejection from this high shows that buyers were trapped above the level and sellers quickly took control This behavior increases the probability of continuation to the downside rather than a simple pause or consolidation
Based on current structure the market is expected to continue pushing lower toward 1.17438 This level represents the next logical area where price may react or slow down
Once price reaches this zone the next move will depend on market reaction and structure development At that point it will be important to evaluate whether the move remains corrective or develops into a deeper bearish continuation

Nebius Group N.V. (NBIS) when growth stops being randomI am looking at the weekly chart of NBIS and this is no longer about emotions, it is about structure. Price has formed a stable bullish cycle, broke out from a wide base and is now holding above key moving averages. On the weekly timeframe most indicators have already shifted into buy mode, while the market does not look overheated. RSI remains in a neutral bullish zone, momentum is intact, and pullbacks are being absorbed without aggressive selling pressure.
The 50, 100 and 200 week moving averages are starting to align into a bullish configuration, which often signals a transition into a medium term trend. Volume confirms the move. This is not an empty or purely speculative rally, but one supported by growing participation from longer term capital. Technically, this structure suggests trend continuation with potential for new highs as long as the current range is held.
From a fundamental perspective, Nebius has gone through a major transformation over recent years. Company revenue has increased multiple times compared to prior periods, while the income structure has become more diversified. The core contribution now comes from cloud solutions, infrastructure services and technology driven segments that continue to grow even in a challenging macro environment. EBITDA has returned to a positive trend in recent reporting periods, and operational metrics are improving due to cost optimization and a stronger focus on higher margin business lines.
Yes, the company is still in an investment phase and this is not a classic profit here and now story. However, revenue growth rates, business scaling and expansion of core segments provide a clear long term value setup. This is not hype. It is a bet on a technology platform that is only entering its value realization phase.
Tactically, I view NBIS as a growth stock where the market can continue higher without a deep correction as long as the current structure holds. While price remains above key weekly levels and moving averages, the bullish scenario stays valid. This is not a one day idea. It is a trend that is just beginning to form.
Sometimes the market already knows where the money is going, and in those moments it is better to listen to the chart rather than the headlines.

BTCUSDT | Intraday Short from Local Supply Context
Looking for an intraday short from a local supply zone. Setup is valid within the current daily range.
Trade Plan
Short: 88,000 – 88,250
Invalidation: clear break and acceptance above 89,000
Target: 86,600 – 86,000
Expectation
Planned move ≈ 2.15% on BTC/USD
Risk
Risk is controlled. Trade only with confirmation.

BTCUSDT Long: Demand at 88K Could Fuel a Move to $92,700Hello traders! Here’s a clear technical breakdown of BTCUSDT based on the current chart structure. Bitcoin recently completed a prolonged move lower within a well-defined descending channel, confirming strong bearish pressure during that phase. This bearish structure remained intact until price reached a key pivot low, where selling momentum clearly weakened. After the initial impulsive move higher, BTC tested the 92,700 Supply Zone, where temporary rejection occurred. This reaction resulted in several pullbacks toward the 88,000 Demand Zone, which aligns with previous resistance turned support and the lower boundary of the ascending channel. Each pullback into this demand area was met with buying interest, indicating absorption rather than distribution.
Currently, price is stabilizing above the 88,000 Demand Zone, and the pullbacks remain corrective in nature. Multiple minor breakouts along the channel support further confirm that buyers continue to defend structure. The market is consolidating while maintaining bullish alignment.
My scenario: as long as BTCUSDT holds above the 88,000 Demand Zone, the bullish structure remains intact. A strong reaction from this area could lead to another attempt toward the 92,700 Supply / Resistance Zone. A confirmed breakout and acceptance above 92,700 would open the door for further upside continuation within the ascending channel. Only a decisive breakdown below demand would invalidate the bullish scenario. For now, the bias remains bullish, with buyers in control while price respects the ascending channel. Manage your risk!

XAUUSD: Rejection from 4,420 Resistance - Pullback Toward 4,350Hello everyone, here is my breakdown of the current XAUUSD setup.
Market Analysis
XAUUSD continues to trade within a broader bullish structure, but the current price action signals a short-term corrective phase. After forming a strong upward impulse, gold established a well-defined upward channel, confirming buyer control. Price then broke above the previous consolidation range, which marked a continuation of bullish momentum.
Currently, XAUUSD pushed higher and reached the Resistance Zone around 4,410–4,420, a level that has historically acted as a strong supply area. At this zone, price showed clear rejection, with sellers stepping in aggressively and limiting further upside. This reaction suggests that supply is currently outweighing demand at these highs. As a result, price is now pulling back from resistance and moving toward the Support Zone around 4,350, which aligns with the previous breakout area and the lower boundary of the upward channel. This zone represents a key demand area where buyers have previously defended the trend. The recent breakout above this level followed by a retest further strengthens its importance.
My Scenario & Strategy
My scenario remains short-term bearish as long as XAUUSD stays below the 4,410–4,420 Resistance Zone and continues to show rejection from this area. I expect price to retrace toward the 4,350 Support Zone, where the next reaction will be crucial for determining continuation or deeper correction.
Therefore, A clean breakdown below the 4,350 Support Zone would confirm a deeper corrective move within the structure and could open the path toward lower demand levels along the channel support. However, if price reaches support and shows a strong bullish reaction, the broader bullish structure remains intact, and buyers may attempt another push toward the resistance highs. For now, the focus is on the corrective pullback, with 4,350 acting as the key level to watch.
That's the setup I'm tracking. Thank you for your attention, and always manage your risk.

EURUSD Fake Breakout Signals Pullback to 1.1700 SupportHello traders! Here’s my technical outlook on EURUSD (4H) based on the current chart structure. EURUSD is trading within a broader bullish recovery after completing a prolonged corrective phase. Earlier, price broke above a descending resistance line, which marked a clear shift in market structure and signaled that sellers were losing control. This breakout initiated a steady bullish move, supported by a rising support line, confirming higher lows and improving momentum. After the breakout, EURUSD continued to push higher and reached the resistance level around 1.1750, where selling pressure emerged. Price briefly spiked above this level, forming a fake breakout, which indicates weak acceptance at higher prices and potential buyer exhaustion. Following this rejection, the market pulled back toward the previous buyer zone, which now acts as a key support level around 1.1700. This zone aligns with the former breakout area and represents an important demand level. Currently, price is consolidating above support, showing hesitation near the buyer zone, and the reaction here will determine the next short-term direction. A corrective pullback into the support zone remains healthy within the broader bullish structure as long as buyers continue to defend this level. My primary scenario is a short-term correction toward the 1.1700 support level (TP1), followed by a potential bullish reaction from this zone. As long as EURUSD holds above this support, the overall structure remains constructive, and buyers may attempt another move toward the 1.1750 resistance and potentially higher. However, a clear breakdown and acceptance below the buyer zone would weaken the bullish setup and open the door for a deeper retracement toward lower support levels. For now, the focus remains on the 1.1700 area, as this level will define whether the market resumes its upward move or extends the correction. Please share this idea with your friends and click Boost 🚀

EURUSD Potential Pullback After High SweepQuick Summary
EURUSD swept the high near 1.18023 and is expected to move lower, The move down is not confirmed as a full bearish trend so selling should be managed carefully A pullback into the orderblock around 1.18043 is preferred with a downside target near 1.17638
Full Analysis
After EURUSD swept the high at 1.18023 the market showed signs of potential weakness This sweep suggests that buy side liquidity has been taken and opens the door for a move lower However at this stage it is still unclear whether this move will develop into a full bearish trend or remain a corrective pullback within a larger structure
Because of this uncertainty selling immediately is not the best approach The safer scenario is to wait for a retracement back into the orderblock near 1.18043 This area would offer a more controlled entry with clearer risk management
The expected downside target for this move is around 1.17638 This level aligns with the idea of a corrective move rather than a full trend reversal For this reason sell positions should not be held for a long duration until stronger bearish confirmation appears
At the moment the focus remains on reaction and structure after the liquidity sweep If price respects the orderblock and shows rejection the short idea remains valid Otherwise the move down should be treated only as a temporary correction

Fundamental Market Analysis for December 24, 2025 EURUSDOn 24 December 2025, EUR/USD is holding near 1.18000, while the US dollar remains under pressure: the market is pricing in continued Fed rate cuts in 2026, even after strong US GDP growth in the third quarter. A weaker tone in consumer surveys adds to the picture, and the pre-holiday week with reduced liquidity increases the pair’s sensitivity to any headlines.
On the euro side, support comes from the European Central Bank’s steadier stance after the 18 December decision to keep rates unchanged and revise growth and inflation projections higher. This reduces the likelihood of near-term easing in the euro area and helps maintain interest in European assets against the backdrop of the euro’s notable strengthening through 2025.
Today’s focus is US initial jobless claims and any signals about the 2026 rate path. If expectations of easing in the US persist and there are no new reasons for rate cuts in the euro area, the balance remains in favour of the euro, so the base scenario is to buy the pair.
Trading recommendation: BUY 1.18000, SL 1.17700, TP 1.18900

Bitcoin Is Not Trending — This Is a Liquidity RangeBTC/USD (H1) — MARKET STRUCTURE ANALYSIS
1. Market State: Range-Bound, Not Trending
Bitcoin is currently trading inside a well-defined sideways range, bounded by a clear resistance zone above and a support base below. Price action confirms range rotation, not a directional trend.
Repeated rejections from the upper resistance zone
Multiple bounces from the same support area
No sustained impulsive follow-through beyond the range
This behavior signals liquidity accumulation, not trend continuation.
2. Moving Averages & Structure
EMA34 and EMA89 are flat and intertwined, confirming a non-trending environment.
Price oscillates around the MA cluster → classic consolidation signature.
The latest pullback returned price to range support, where buyers are reacting.
As long as price remains trapped between these boundaries, mean-reversion dominates.
3. Price Action Behavior
High wicks near resistance → aggressive sell-side defense
Strong reactions at support → demand absorption
Expansion attempts are repeatedly faded
This is textbook institutional range control, where liquidity is built on both sides before a decisive move.
4. Scenarios Ahead
Primary Scenario (High Probability):
Continued oscillation between support and resistance
False breaks to collect liquidity
Compression builds toward a future expansion
Breakout Scenario (Confirmation Required):
A clean H1 close above the resistance zone, followed by acceptance
Only then does upside continuation toward the next major liquidity zone become valid
Bearish Breakdown Scenario:
A decisive breakdown below support with strong volume
This would open a deeper corrective leg toward lower demand zones
5. Trading Logic
Avoid trend-chasing inside the range
Favor reaction-based trades at extremes
Patience is key until the market reveals direction
Conclusion
Bitcoin is not weak and not strong either. It is controlled, balanced, and preparing.
This range is a decision zone, and the real opportunity will come after price commits outside of it.
Until then, discipline and structural awareness outperform prediction.

How will gold prices fluctuate after the GDP report?1️⃣ Trendline
The short–to–medium term ascending channel remains intact; price is moving within the channel → the primary trend is bullish.
Upper trendline (dynamic resistance): price is approaching this area → high probability of consolidation / profit-taking.
Lower trendline (dynamic support): acts as the main demand zone for pullbacks.
2️⃣ Support
4,470 – 4,468: Near-term support, overlapping with the consolidation zone & short-term MA.
4,447 – 4,445: Stronger support, structural low within the ascending channel.
4,360: Deep support; a break below this level would signal risk of channel breakdown.
3️⃣ Resistance
4,500: Psychological resistance & short-term high.
4,548 – 4,550: Major resistance, confluence of upper trendline + supply zone → primary profit-taking target.
4️⃣ Scenarios
Holding above 4,470 → favor buy-on-dips following the trend, targets 4,500 → 4,550.
Rejection at 4,500–4,550 → potential pullback toward 4,450 before the next directional decision.
Clear break and hold above 4,560 → bullish continuation / trend expansion.
📈 Trade Setup
BUY GOLD: 4,447 – 4,445
Stop Loss: 4,437
Take Profit: 100 – 300 – 500 pips
SELL GOLD: 4,548 – 4,550
Stop Loss: 4,560
Take Profit: 100 – 300 – 500 pips

USD/JPY(20251224)Today's AnalysisMarket News:
The US economy expanded at a rate of 4.3% in the third quarter, the fastest growth in two years, but the US consumer confidence index declined for the fifth consecutive month.
ADP Weekly Employment Report: In the four weeks ending December 6, 2025, private sector employers added an average of 11,500 jobs per week.
Trump: Those who disagree with him will never become Fed Chair. Next Fed candidate Hassett: Predicts monthly job growth may return to 100,000+, and the Fed is far behind the times on interest rate cuts.
Technical Analysis:
Today's Buy/Sell Threshold:
156.30
Support and Resistance Levels:
157.71
157.18
156.84
155.76
155.42
154.90
Trading Strategy:
If it breaks above 156.30, consider buying, with a first target price of 156.84.
If it breaks below 155.76, consider selling, with a first target price of 155.42.

Mastering MACDTurning a Popular Indicator Into a Structured Decision Tool
Many traders use MACD as a simple signal generator. They see a crossover, enter a trade, and later realise the result does not match the expectation. MACD becomes useful only when it is applied inside a clear framework built on trend, momentum, and timing. Its real value lies in reading shifts in participation rather than delivering standalone entry signals.
Understanding what the indicator represents is the first step. MACD measures the relationship between two moving averages and reveals how fast price is accelerating or slowing down. The histogram shows the rate of change. When used with intent, MACD helps you read the strength behind a move instead of trying to predict direction. Momentum confirms structure and brings clarity to the decision process.
Define the market environment before looking at MACD. Trending markets and ranging markets produce different behaviours. In a trend, a rising histogram often supports continuation and helps you judge whether a pullback is healthy or the start of a deeper rotation. In a range, the histogram moves around the zero line and highlights areas where momentum is fading. Without this context, MACD signals tend to mislead more than they help.
The next step is aligning MACD with the locations your system already relies on. Use it as part of the confluence, not as a trigger. When price reaches a higher-timeframe level, a liquidity area, or a clear structural pivot, the histogram can show whether momentum is shifting in your favour. You are not asking MACD to discover the trade. You are using it to confirm the logic you have prepared.
With structure and location in place, create specific decision rules for MACD behaviour. Examples include shrinking momentum when price approaches a level, expansion that supports a breakout, crossovers that match the higher-timeframe direction, or divergences that signal exhaustion at important zones. Every rule needs to serve a practical purpose. Reacting to every crossover removes discipline and weakens the system. Well-defined conditions make MACD a reliable filter.
Risk management remains outside the indicator. MACD does not define stops, invalidation, or how much to risk. Those rules come from structure. Stops should respect swing highs or lows, well-defined invalidation areas, or volatility-based distances. Combining this approach with MACD’s momentum read protects you from chasing trades that lack strength and reduces over-engagement during slow conditions.
Validation closes the loop. Backtest the exact behaviours you rely on, not the indicator as a whole. Study how histogram shifts behave at your chosen levels. Compare momentum against structure. Track how timing improves when MACD is used to refine execution instead of generate entries. When the data confirms the rules across different market conditions, the system gains stability.
MACD becomes a valuable asset when integrated into a disciplined process. On its own, it produces too much noise. Inside a structured system, it sharpens momentum reading, filters out weak trades, and builds cleaner execution. Traders who use MACD to support their framework instead of driving it achieve far greater consistency over time.

Gold prices continue to reach record highs, and the upward trend1️⃣ Trendline
The medium-term ascending channel remains intact; price is trading near the upper boundary → the primary trend remains bullish.
The short-term rising trendline (below) acts as dynamic support; pullbacks continue to be well absorbed.
Price is approaching the upper trendline → an area prone to short-term volatility and profit-taking.
2️⃣ Support
4,441 – 4,443: key support zone (demand area + trendline confluence).
Holding above this zone → prioritize buy setups in line with the trend.
A break below → increased risk of a deeper correction toward 4,395 – 4,400 (Fibonacci 1.618).
3️⃣ Resistance
4,506 – 4,508: near-term resistance (Fibonacci 3.618) → a technical pullback may occur.
4,538 – 4,540: major resistance ahead (Fibonacci 4.236) → primary target on a confirmed breakout.
4️⃣ Preferred Scenarios
Primary trend: BULLISH.
Look for buy opportunities on pullbacks to the 4,44x zone, with confirmation from trendline + EMA support.
Break and hold above 4,510 → bullish momentum extends toward 4,54x.
Failure near 4,50x → technical correction, while the bullish structure remains intact.
📈 Trade Setup
BUY GOLD: 4,441 – 4,443
Stop Loss: 4,431
Take Profit: 100 – 300 – 500 pips
SELL GOLD: 4,538 – 4,540
Stop Loss: 4,550
Take Profit: 100 – 300 – 500 pips

Disney's Possible Swing SetupHi Traders!
As I analyze Disney, I am seeing it's in a counter trend on the 24HR with a resistance at $120. I'm staying patient watching to see how far price will retrace with a 24HR CHOCH sitting at around $102.50. That seems far away, but that would help fill in some of the gap, and give a nice set up for a reversal. In addition, there are 4 days left in the current Monthly candle, and they've been closing small. IMO that could indicate that price could eventually make it to $130.
For now, I have alerts set and I'm planning to take a long swing.
Let me know what you guys think in the comments! Good luck!
*DISCLAIMER: I am not a financial advisor. The ideas and trades I take on my page are for educational and entertainment purposes only. I'm just showing you guys how I trade. Remember, trading of any kind involves risk. Your investments are solely your responsibility and not mine.*

EURUSD Short: Head & Shoulders at Resistance - Target 1.1670Hello, traders! EURUSD previously traded within a well-defined Descending Channel, confirming sustained bearish pressure and controlled sell-side momentum. Price consistently respected the channel boundaries, forming a sequence of lower highs and lower lows. Multiple breakout attempts occurred within the channel, but each upside move was capped by the descending resistance, reinforcing the bearish structure. The market eventually reached a clear Pivot Point near the lower channel boundary, where selling pressure weakened and buyers briefly stepped in, producing a corrective rebound rather than a full trend reversal. Following this rebound, EURUSD pushed higher and managed to break above local resistance levels, leading to a short-term bullish expansion. However, this move lacked strong follow-through and transitioned into a distribution phase near the Supply Zone around 1.1760. At this area, price formed a clear Head and Shoulders pattern, signaling exhaustion of bullish momentum and a return of sellers. The left shoulder, head, and right shoulder developed directly under resistance, confirming strong supply presence and rejection from higher prices.
Currently, price has broken below short-term structure and is pulling back from the supply zone, signaling the start of a corrective-to-bearish continuation move. The market is now rotating lower toward the Demand Zone around 1.1670, which aligns with a previous breakout level and acts as the nearest downside objective. This zone represents a key area where buyers may attempt a reaction, but overall structure still favors sellers.
My primary scenario is bearish as long as EURUSD remains below the 1.1760 Supply Zone and continues to show rejection from this area. The current pullback appears impulsive rather than corrective, favoring continuation toward the 1.1670 Demand Zone. A clean breakdown and acceptance below demand would confirm further downside continuation. Until then, this level remains the key decision point. Manage your risk!

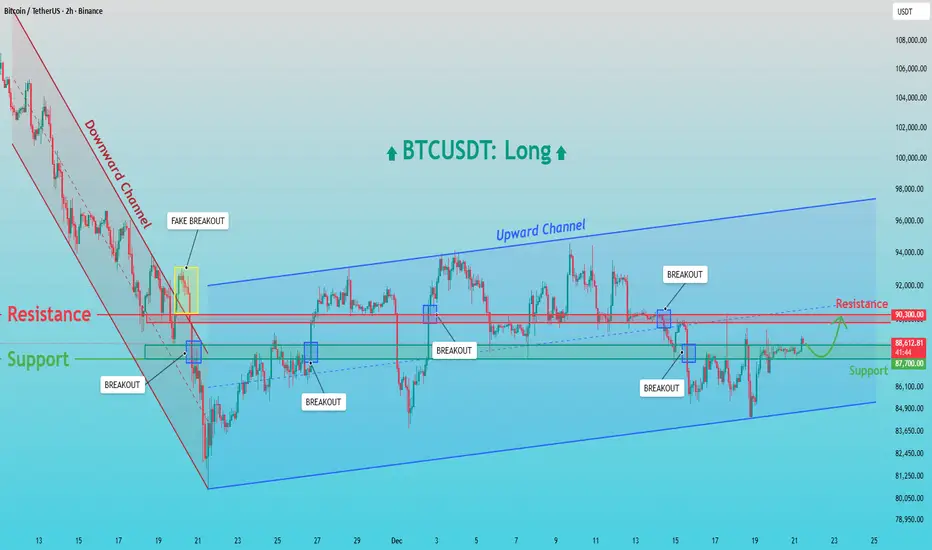
BTCUSDT: Holds Demand - Retest of 90,300 Resistance LikelyHello everyone, here is my breakdown of the current BTCUSDT setup.
Market Analysis
BTCUSDT recently transitioned from a strong downward channel into a broader bullish recovery phase. After a prolonged bearish move, price formed a base near the channel low, where selling pressure weakened. This led to a breakout from the downward channel; however, the first move above resistance resulted in a fake breakout, indicating that sellers were still active at that level. Following this, Bitcoin found strong demand around the 87,000 Support Zone, where buyers stepped in aggressively. From this area, price began to form higher lows and successfully established an ascending (upward) channel, signaling a shift in short-term market structure toward bullish control. Within this upward channel, BTC experienced several clean breakouts above intermediate resistance levels, confirming improving momentum. The key horizontal level around 90,300 acted as a major resistance, where price was rejected multiple times. Despite these rejections, the market did not break down sharply, suggesting absorption of selling pressure rather than distribution.
Currently, BTCUSDT is pulling back toward the 87,000 Support Zone, which aligns with previous resistance turned support and the lower boundary of the upward channel. Price action here remains constructive, with consolidation rather than impulsive selling, indicating that the move lower is corrective.
My Scenario & Strategy
My primary scenario remains bullish as long as BTC holds above the 87,000 support. This zone is a key demand area, and a strong reaction from here could lead to another attempt toward the 90,300 Resistance and a continuation within the upward channel. A confirmed breakout and acceptance above the 90,300 level would open the door for further upside toward higher channel targets.
However, a failure to hold the 87,000 Support Zone would signal weakness and could trigger a deeper correction toward the lower channel boundary. For now, the market structure favors long positions, with support holding and resistance as the next upside objective.
That's the setup I'm tracking. Thank you for your attention, and always manage your risk.
NIFTY Moved EXACTLY As Analyzed | Live Entries, SL & Target Hit
Today’s video has been recorded live during market hours —> no hindsight, no edited stories.
I tracked the price action candle-by-candle, explained the structure as it was forming, and shared the exact trades I took.
You will see:
• My stop-loss getting hit (full transparency)
• My targets getting hit
• Why the analysis played out perfectly
• How to adjust your plan when the market shifts
• How I manage trades in real time
This is pure live price action + real psychology.
If you follow the whole breakdown, you’ll understand exactly why the market moved the way it did and how I planned the next setups.
Let me know if you want more live breakdowns like this.

Fundamental Market Analysis for December 23, 2025 USDJPYOn December 23, USDJPY is pulling back toward 156.300 amid a weaker dollar and heightened attention to actions by Japanese authorities. Toward year-end, volatility rises as liquidity thins, so officials’ comments can quickly shift the balance. Expectations of potential measures against excessive yen moves are limiting dollar buying.
The yen is supported by the Bank of Japan’s recent rate hike to 0.75% — the highest level in roughly three decades — although further steps are expected to be gradual. Higher funding costs in Japan reduce the attractiveness of betting on a weaker yen, especially against the backdrop of expectations for U.S. rate cuts in 2026. U.S. GDP and inflation readings could support the dollar in the short term, but the broader tone for the dollar remains soft.
A rise in U.S. yields and improved risk sentiment could restrain USDJPY’s decline, as demand for the dollar typically increases in such conditions. Nevertheless, the combination of warnings about potential intervention, higher borrowing costs in Japan, and a softer dollar increases the likelihood that the pair will continue to fall. The base case is for selling USDJPY with risk control.
Trading recommendation: SELL 156.300, SL 156.500, TP 155.500

BTC Isn’t Breaking Out — It’s Hunting LiquidityBTC/USD – 1H Quick Read
Bitcoin remains trapped inside a defined range between support and resistance. Price is holding near the range mid, showing balance, not momentum.
Repeated wicks at both extremes confirm liquidity sweeps, not trend acceptance. Buyers defend support aggressively, but upside attempts still lack follow-through.
Key Points
Range market = rotation, not trend
Breakouts are faded, pullbacks are absorbed
Liquidity is prioritized over direction
Outlook
Expect continued chop and false moves until BTC clearly accepts above resistance or loses support.
Bottom Line
No breakout yet.
Trade the range wait for confirmation for direction.

Weekly Outlook: XAUUSD, #SP500, #BRENT | 26 December 2025XAUUSD: BUY 4397.16, SL 4387.16, TP 4427.16
Gold starts the week near record highs: as of December 22, XAUUSD is hovering around 4397.16. Support comes from expectations of lower U.S. interest rates in 2026 and safe-haven demand amid geopolitical uncertainty and a softer U.S. dollar.
This week, interest in gold may strengthen if U.S. data on growth and inflation come in softer, and if headlines point to continued central-bank buying. On the other hand, year-end profit-taking and thin holiday liquidity may limit the upside.
Trading recommendation: BUY 4397.16, SL 4387.16, TP 4427.16
#SP500: BUY 6835, SL 6815, TP 6895
#SP500 enters the week near 6835 points as investors reassess the Fed’s 2026 rate path and aim for a calm year-end finish. Sentiment is also supported by renewed demand for large-cap stocks, which carry the biggest weight in the index.
With a shortened week, market reactions to U.S. releases can be sharper—especially GDP updates, corporate orders, and consumer confidence. Strong figures would support revenue expectations, while softer data could reinforce bets on policy easing, which often also supports equities.
Trading recommendation: BUY 6835, SL 6815, TP 6895
#BRENT: SELL 60.93, SL 61.43, TP 59.43
#BRENT starts the week around 60.93 per barrel. In the short term, supply-risk headlines may provide support, but the market is still focused on the possibility of oversupply in 2026 and rising output from producers outside coordinated agreements.
Pressure may increase if new assessments confirm softer demand and elevated inventories. At the same time, any fresh geopolitical developments can trigger sharp but brief spikes, so the key driver remains the broader supply-demand balance.
Trading recommendation: SELL 60.93, SL 61.43, TP 59.43
