BTCUSD Tests Buyer Zone — Eyes Break Below $100KHello traders, here’s my current outlook on Bitcoin (BTCUSD). The market continues to trade within a broader bearish structure after breaking down from the previous rising channel. The price failed to hold above the $110,000–$111,000 Seller Zone, where multiple fake breakouts occurred, indicating strong bearish pressure and aggressive selling activity in that region. After the rejection from the Seller Zone, BTC shifted into a descending trend structure, forming lower highs along a clearly defined Resistance Trendline. Each corrective move to the upside has been capped by this trendline, confirming that sellers are maintaining control. Meanwhile, the Support Level around $100,200–$101,000 has acted as a key Buyer Zone, where price has repeatedly paused and reacted, suggesting that buyers are attempting to absorb selling pressure here. Currently, BTC is consolidating just above this Support Zone, but the overall momentum remains bearish. If the price fails to break above the descending Resistance Line, we could see a continuation of the downtrend, likely pushing toward a retest of the $100,200 Support Level. A confirmed breakdown below this level would expose the next downside support levels and reinforce the sellers’ dominance. However, if buyers manage to hold the price above $100,200 and force a breakout above the descending Resistance Line, a short-term corrective recovery could unfold toward the $103,000–$105,000 region. This area remains critical and is likely where sellers may look to re-enter the market based on previous reaction structure. For now, the market structure favors a bearish bias, with the trend down and sellers maintaining stronger control. I am watching for a reaction at the current support — if the level breaks, continuation lower becomes the primary expectation. Please share this idea with your friends and click Boost 🚀
Analysis

S&P 500 INDEX Tech-heavy index bias acknowledged# 📊 US500 (S&P 500 INDEX) COMPREHENSIVE TECHNICAL ANALYSIS 🎯
## Week of November 10-14, 2025 | Intraday & Swing Trade Mastery
Current Price: 6,742.5 Points | Entry Point: November 8, 2025, 12:54 AM UTC+4 📈
## 🔍 EXECUTIVE SUMMARY - MULTI-TIMEFRAME PERSPECTIVE
The S&P 500 (US500) is positioned at a critical technical inflection point with exceptional multi-timeframe alignment signaling imminent directional breakout. Elliott Wave analysis reveals completion of corrective cycles, positioning for next impulse leg targeting 6,900-7,100 extension zone with powerful momentum. Bollinger Bands display classic compression squeeze pattern —volatility compression preceding directional expansion. RSI across all timeframes maintains optimal neutral-bullish bias (54-68 range)—perfect momentum positioning without extreme overbought conditions. Volume clustering at 6,680-6,800 represents significant institutional accumulation foundation. Wyckoff spring tests near 6,600-6,650 provide aggressive entry triggers for brave traders. Harmonic pattern convergence at 6,850-6,950 resistance signals breakout confirmation with measured move targets extending to 7,050+. Mega-cap tech concentration supports rally continuation probability.
## 📊 TIMEFRAME-BY-TIMEFRAME ANALYSIS
### 5-MINUTE (Scalping Precision) ⚡
Candlestick Formation: Japanese candles reveal micro-consolidation with breakout attempts across support zones. Evening Star rejection formations detected at 6,850-6,900 intraday resistance creating potential short triggers.
Elliott Wave 5M: Sub-wave completion indicates Wave 4 micro-consolidation finalizing. Wave 5 breakout anticipated above 6,780-6,820 with targets 6,920-7,000 (measured move).
Bollinger Bands: Upper compression mode—middle band at 6,740 acts as pivot point. Lower band rejection (6,650-6,680) creates scalp-long setups with excellent risk/reward ratios.
RSI (14) Analysis: RSI oscillating 46-64 range—neutral territory with minor divergences forming. Bullish divergence at 6,680 support signals buyer engagement; caution on 70+ resistance approach.
Micro Support/Resistance: 6,650 (micro-support) | 6,720 (POC cluster) | 6,800 (pivot) | 6,880 (intraday resistance) | 6,950 (scalp target)
Volume Signature: Volume concentrated 6,720-6,800 zone—institutional marker established. Breakout volume >55% above average required above 6,880 for sustained move above 6,950.
VWAP Alignment: Price oscillating around session VWAP at 6,735—each touch generates scalp opportunity. Upper VWAP band at 6,920; lower support at 6,650.
### 15-MINUTE (Quick Swing Gateway) 🎢
Candlestick Patterns: Engulfing bars forming at support zones—bullish engulfing at 6,680 zone confirms reversal attempts. Three-candle patterns (flag continuation) with 60-100 point breakout potential.
Harmonic Pattern Recognition: Gartley Pattern potential completion near 6,680-6,750 PRZ (Potential Reversal Zone). Exceptional risk-reward at 1:3.8 for harmonic traders. Butterfly variant also forming clearly.
Wyckoff Accumulation Phase: Classic accumulation evident—small barometer move (SBM) nearing completion. Spring test anticipated 6,580-6,620 zone; markup phase targets 6,950-7,100.
Bollinger Bands (15M): Band squeeze intensifying—historical volatility expansion suggests 80-150 point moves follow. Upper band resistance at 6,920; lower band support at 6,580.
Volume Profile (15M): Point of Control (POC) at 6,740—prime concentration zone confirmed. Volume surge >65% required confirming breakout above 6,880. Imbalances favor upside significantly.
Ichimoku Cloud (15M): Price consolidating below cloud edge—Tenkan-sen at 6,900 = resistance pivot. Kijun-sen (6,820) = critical secondary support. Cloud support 6,650-6,750.
EMA Structure: EMA 9 (6,780) above EMA 21 (6,720)—bullish alignment confirmed perfectly. Price above both = intraday strength maintained.
### 30-MINUTE (Intraday Swing Axis) 🔄
Pattern Formation: Symmetrical Triangle pattern consolidating with apex near 6,900. Ascending triangle variant shows bullish bias—breakout above 6,850 targets 6,980-7,100 extension.
Dow Theory Application: Confirming higher highs/higher lows structure perfectly. Secondary trend bullish; pullbacks to EMA 20 (6,770) = optimal swing entry zones.
RSI Divergence Setup: Positive RSI divergence confirmed—price making lower lows (6,650) while RSI forms higher lows (40 level). Classic reversal setup targeting 6,900 minimum.
Exponential Moving Average: EMA 9 (6,800) = core support pivot. EMA 21 (6,740) = secondary support reliable. EMA 50 (6,600) = structural hold level. Bullish ribbon alignment intact.
Support Architecture: 6,600 (EMA 50/structural) | 6,680 (demand zone) | 6,740 (volume cluster) | 6,800 (EMA 9 dynamic)
Resistance Architecture: 6,850 (triangle formation) | 6,920 (measured move target) | 7,000 (weekly resistance) | 7,100 (extension)
Volume Analysis (30M): Increasing volume on recent bars—accumulation signature strong. Buy volume exceeding sell volume confirms institutional interest significantly.
### 1-HOUR (Core Swing Trade Engine) 🎯
Elliott Wave Structure: Major wave analysis suggests Wave 3 completion near 7,000. Current Wave 4 correction targets 6,750-6,850 support zone. Wave 5 impulse anticipated—target: 7,100-7,250.
Pennant Formation: Classic Bullish Pennant pattern forming—breakout confirmation above 6,880 validates pattern. Pole height measured move = 7,150+ target.
Bollinger Bands (1H): Upper band at 7,000 = squeeze breakout target zone. Middle band (6,900) = bullish support zone. Lower band rejection (6,600) creates swing longs with excellent R/R.
VWAP Daily: S&P trading above daily VWAP at 6,720—bullish gradient confirmed clearly. Each hourly candle close above VWAP strengthens continuation probability.
Volume Profile Hotspot: Heavily traded at 6,720-6,800 (accumulation zone) and 6,880-6,950 (resistance cluster). Imbalances above 7,000 suggest vacuum-fill potential to 7,150+.
Ichimoku Cloud Alignment: Price above Senkou Span A (6,880) & Span B (6,820)—cloud thickness indicates strong support. Chikou Span above candles = bullish confirmation. Cloud color: BULLISH GREEN.
Gann Theory Application: 45-degree angle from swing low (6,500) establishes rally trajectory perfectly. Resistance at 38.2% Fibonacci extension (6,920) precedes aggressive breakout phase.
Support Tiers 1H: 6,600 (structural hold) | 6,700 (EMA support) | 6,750 (Kijun-sen) | 6,800 (accumulation zone)
Resistance Tiers 1H: 6,880 (breakout trigger) | 6,950 (extension) | 7,000 (major level) | 7,100 (impulse target)
### 4-HOUR (Swing Trade Thesis Foundation) 💼
Inverse Head & Shoulders Pattern: Potential IH&S formation completing—left shoulder (6,550), head (6,480), right shoulder completing (6,600-6,680). Neckline breakout at 6,880 targets 7,050-7,200 extension.
Wyckoff Accumulation Deep Dive: Institutional buying signature evident—SBM (small barometer move) completion imminent. Spring test to 6,600-6,650 anticipated; subsequent markup phase targets 7,100-7,250.
RSI 4H Analysis: RSI at 58-70 range—bullish bias maintained firmly. Room for upside extension without extreme overbought. RSI above 76 targets 7,150+; below 32 = defensive posture required.
Cup & Handle Formation: Potential bullish Cup pattern visible on 4H—handle stabilization near 6,780-6,850. Breakout above handle (6,920) targets cup depth extension = 7,100-7,200.
EMA Ribbon Structure: EMA 8 (6,820), EMA 13 (6,800), EMA 21 (6,740), EMA 50 (6,600), EMA 200 (6,100)—BULLISH ALIGNMENT PERFECT. Compression/expansion cycles identify momentum phases.
Support Tiers 4H: 6,580 (structural support) | 6,650 (accumulation) | 6,740 (pivot) | 6,800 (demand cluster)
Resistance Tiers 4H: 6,880 (key breakout) | 6,950 (extension) | 7,000 (major target) | 7,150 (weekly projection)
Volume Signature 4H: Accumulation volume bars > distribution bars—bullish bias maintained. Volume nodes clustering at 6,720-6,800 indicate strong institutional support zone.
### DAILY CHART (Macro Swing Thesis) 📅
Elliott Wave Macro: We're potentially in Wave 3 of larger cycle—aggressive expansion still possible. Wave structure supports break of 7,000 targeting 7,200-7,400 daily close objectives.
Double Bottom Recognition: Historical Double Bottom pattern near 6,350-6,500 support—confirmed breakthrough above 6,880 neckline triggered. Second target near 7,100-7,200.
Bollinger Bands Daily: Upper band at 7,200 = realistic daily target zone. Mean (6,950) = healthy pullback support reliable. Band slope indicates volatility expansion—expect 200-400 point daily ranges.
Volume Profile Daily: Strong buying volume bar at 6,600-6,750 zone—institutional accumulation marker established. Selling volume decreasing—demand controls trend absolutely.
Ichimoku Cloud Daily: Cloud thickness growing—bullish trend strengthening substantially. Cloud support around 6,750-6,850 zone. Kumo breakout anticipated—targets cloud top at 6,950-7,050.
Harmonic Analysis Deep: Butterfly Pattern potential completion—PRZ at 6,880-6,950 suggests reversal zone OR breakout confirmation. Confluence amplifies probability of extension.
Gann Angles & Fibonacci: 50% retracement (6,650) + 61.8% extension (7,050) = key reversal zones. Gann fan angles suggest 6,950-7,100 as structural resistance before continuation.
Key Daily Support: 6,480 (psychological/structural) | 6,600 (accumulation zone) | 6,700 (demand level) | 6,800 (midpoint)
Key Daily Resistance: 6,880 (breakout trigger) | 6,950 (extension) | 7,050 (measured move) | 7,200 (weekly target)
Trend Confirmation: Higher highs & higher lows maintained—uptrend intact. Daily close above 7,000 = strong continuation signal targeting 7,300+ next level.
## 🎪 TRADING SETUP PLAYBOOK - NOV 10-14
### BULLISH SCENARIO (Probability: 82%) ✅
Trigger: 4H candle close above 6,920 + volume surge (>60% above average) + RSI above 66
Entry Zone: 6,820-6,880 (with breakout confirmation signal)
Target 1: 6,950 (TP1) | Target 2: 7,000 (TP2) | Target 3: 7,100 (TP3) | Target 4: 7,200 (TP4)
Stop Loss: 6,700 (below EMA/structural support)
Risk/Reward: 1:3.6 (exceptional asymmetric setup)
Trade Duration: 18-72 hours (prime swing window)
### BEARISH SCENARIO (Probability: 18%) ⚠️
Trigger: Daily close below 6,800 + volume increase + RSI divergence failure
Entry Zone: 6,920-7,050 (short setup)
Target 1: 6,880 (TP1) | Target 2: 6,800 (TP2) | Target 3: 6,700 (TP3)
Stop Loss: 7,150 (above resistance)
Risk/Reward: 1:1.5 (acceptable but lower probability)
Trade Duration: Watch for trend reversal confirmation first
## ⚠️ VOLATILITY & OVERBOUGHT/OVERSOLD CONDITIONS
Current Volatility Status: Moderate compression → Expect significant expansion imminent
5M/15M RSI: 46-64 range (neutral)—room for 30-60 point movements | Scalp target zones
30M/1H RSI: 54-70 range (bullish bias, optimal zone)—sweet spot for swing entries
4H RSI: 58-72 range—approaching caution zone but room to extend | Safe for core swings
Daily RSI: 62-76 range (approaching extremes)—be defensive if daily RSI>78 | Take profits aggressively
Overbought Recognition Points:
RSI daily >77 combined with upper Bollinger Band rejection = immediate profit-taking
Ichimoku cloud top penetration fails (bearish candle rejection) = trend exhaustion signal
Volume declining on breakout attempt = false breakout warning signal
Harmonic pattern PRZ exact hit without follow-through = reversal likely imminent
Oversold Bounce Setups:
RSI 1H <32 on support touch = high-probability bounce back to 6,880-6,950
Price below EMA 50 (6,600) + RSI <28 = aggressive accumulation zone
Spring test below 6,650 with volume surge = Wyckoff spring reversal trigger
Harmonic pattern PRZ support bounce = measured move extension targets activated
## 🎯 ENTRY & EXIT OPTIMIZATION STRATEGY
### OPTIMAL ENTRY TIMING
For Scalpers (5M): RSI bounce from 42-50 zone after Band lower touch = 20-35 point scalp (1-3 min holds)
For Quick Swings (15M-30M): 15M candle close above 6,880 with 4H alignment = 100-150 point swing (30 min-2 hour holds)
For Core Swings (1H-4H): 4H pennant breakout above 6,920 on volume = 300-450+ point target (hold 12-48 hours)
For Position Swings (Daily): Daily close above 7,000 = continuation play targeting 7,200-7,350 (hold 5-7 days)
Best Entry Windows: US pre-market (12:30 ET), Market open (14:30 ET), London close (16:00 ET)
### EXIT STRATEGIES & PROFIT TAKING
Take Profit Levels: TP1: Fibonacci 38.2% (6,920) | TP2: Harmonic PRZ (7,000) | TP3: Daily Band upper (7,100) | TP4: Weekly target (7,200)
Stop Loss Placement: Always below most recent swing low + 25 points (strict risk management priority)
Trailing Stops: Activate at TP2—trail with 45-55 point buffer for 4H+ trades (lock in profits)
Breakeven Exit: Move stops to entry after 1:1 risk/reward achieved—eliminate emotional trading
Partial Profit Strategy: Close 25% at TP1 | 25% at TP2 | 25% at TP3 | Let 25% run to TP4 (maximize winners)
## 🔔 REVERSAL & BREAKOUT RECOGNITION CHECKLIST
### REVERSAL SIGNALS TO MONITOR:
RSI positive divergence (lower price lows, higher RSI lows) = bullish reversal setup high probability
Candlestick engulfing patterns at support/resistance zones = trend reversal confirmation strong signal
Volume profile breakdowns (declining volume on breakout attempts) = false move warning immediate
Ichimoku Cloud rejection (price fails to penetrate cloud layer) = structural resistance confirmed
Harmonic pattern completion at exact PRZ = reversal zone probability increases significantly
Elliott Wave 5th wave failure (truncation) = impulse completion = reversal imminent trigger
Gann angle break through significant angle = trend line break = reversal trigger activated
### BREAKOUT CONFIRMATION RULES:
Close beyond resistance with >60% volume surge above average = confirmed breakout signal strong
RSI crosses above 62 for bullish breakout, below 42 for bearish breakout confirmation
VWAP alignment with directional move = institutional participation confirmation strong
Bollinger Band breakout with band expansion (squeeze release) = volatility expansion confirmed immediate
Multiple timeframe confluence (5M + 15M + 1H + 4H aligned) = highest probability setup attainable
Ichimoku Cloud break (price clears all clouds with bullish candles) = strong continuation signal
Volume imbalance (ask volume > bid volume) = directional sustain likelihood increases significantly
## 💡 WEEK FORECAST SUMMARY - NOV 10-14
Monday (10th): 🌍 Consolidation continuation near 6,750-6,850 zone. Range-bound trading anticipated. Early breakout direction watch crucial. Entry setups favor reversal plays at support zones.
Tuesday-Wednesday (11-12th): 📈 Prime breakout window opens —6,920 represents key decision point. Expect 250-400 point daily volatility swings. Breakout confirmation targets 7,000-7,100 extension. This is the optimal swing trade window all week.
Thursday (13th): ⚠️ Potential profit-taking pullback after breakout (if triggered). Support retest of 6,950-6,880. Buying opportunity if pullback holds above 6,800.
Friday (14th): 📊 Weekly close pattern formation critical. Extension run anticipated if above 7,000. If above 7,050 = week target 7,200-7,300 achieved. End-of-week positioning for next week.
## 📍 CRITICAL CONFLUENCE ZONES - KEY TARGETS
6,580-6,650: Major support zone (accumulation marker, Wyckoff spring area, structural hold)
6,700-6,800: Secondary support (EMA 9, demand cluster, psychological level, volume POC)
6,820-6,880: Micro-resistance cluster (consolidation squeeze zone, early breakout resistance)
6,920-7,000: KEY BREAKOUT ZONE (triangle apex, harmonic confluence, all timeframe resistance)
7,000-7,100: Primary upside target (Elliott Wave 5, daily Band upper, measured move extension)
7,100-7,200: Secondary extension target (Gann level, macro resistance, wave projection)
7,200-7,350: Weekly/monthly target (if wave 5 impulse extends beyond base projections)
## 🏆 RISK MANAGEMENT RULEBOOK
✅ 1) Position Sizing: Never risk >2% of account equity per single trade
✅ 2) Risk-Reward Ratio: Minimum 1:2.5 R/R on every entry—1:3+ preferred for swing trades
✅ 3) Profit Scaling: Close 25-50% at 1:1 ratio, let remainder run to 1:2+ targets
✅ 4) Stop Loss Discipline: Place stop IMMEDIATELY on entry—no exceptions (25-30 points tight)
✅ 5) Breakout Confirmation: Avoid FOMO—wait for candle close confirmation + volume surge always
✅ 6) Daily Support Respect: Psychological holds (round numbers 6,800 | 7,000) matter—trade confluence not against
✅ 7) Time Management: Exit losing trades quickly (max 1:0.5 acceptable for educational losses)
✅ 8) Macro Alignment: Always check daily/4H bias before taking 1H or lower trades
## #US500 #SP500 #SANDP500 #SP500TRADING
#TECHNICALANALYSIS #ELLIOTTWAVE #HARMONICPATTERN #BREAKOUTTRADING
#SWINGTRADER #DAYTRADING #INTRADAY #INDICES #TRADINGVIEW
#BOLLINGER BANDS #RSI #ICHIMOKU #VWAP #TRADINGSTRATEGY
#WYCKOFFMETHOD #GANNTHEORY #DOWTHEORY #TECHNICALS #ANALYSIS
#SUPPORTANDRESISTANCE #VOLUMEANALYSIS #OVERBOUGHT #OVERSOLD #REVERSAL
#STOCKINDEXTRADING #USINDEXTRADING #BREAKOUTSETUP #TRADERSOFTWITTER
#TECHNICALTRADER #CANDLESTICK #PATTERRECOGNITION #CHARTANALYSIS #DAYTRADER
## 🎁 BONUS: DAILY PRE-MARKET CHECKLIST
Use this every morning before US market open:
☑️ Check daily RSI (should be 62-74 for bullish bias continuation)
☑️ Identify support/resistance zones (6,700 | 6,800 | 6,920 | 7,050)
☑️ Verify 4H chart alignment (pennant/IH&S pattern status update)
☑️ Check Ichimoku cloud position (above/below = trend confirmation signal)
☑️ Review 1H Elliott Wave count (which wave are we trading exactly?)
☑️ Scan volume profile (POC = likely rejection zone area)
☑️ Set entry orders + stop losses BEFORE pre-market opens (12:30 ET)
☑️ Plan 3 Take Profit levels before entering any position
☑️ Monitor US economic calendar (Fed speakers, CPI data, jobs report)
## 🌐 US MARKET SESSION NOTES
The S&P 500 trades during US market hours (14:30-21:00 CET / 8:30-15:00 ET) . Highest volatility typically occurs:
Pre-Market (12:30-14:30 CET): Initial momentum setup—watch for direction confirmation patterns
Market Open (14:30-16:00 CET): Prime trading hours —best liquidity + volatility combination guaranteed
Tech-Heavy Bias: Mega-cap tech (FAANG+) drives 30%+ of index—monitor tech sentiment separately
💡 Disclaimer: This technical analysis is educational only. Always conduct your own due diligence and implement appropriate risk management. Past performance does not guarantee future results. Trade responsibly within your risk tolerance. Use stop losses on every position. Not financial advice.
Analysis Created: November 8, 2025 | Valid Through: November 14, 2025 | Updated Daily at Pre-Market

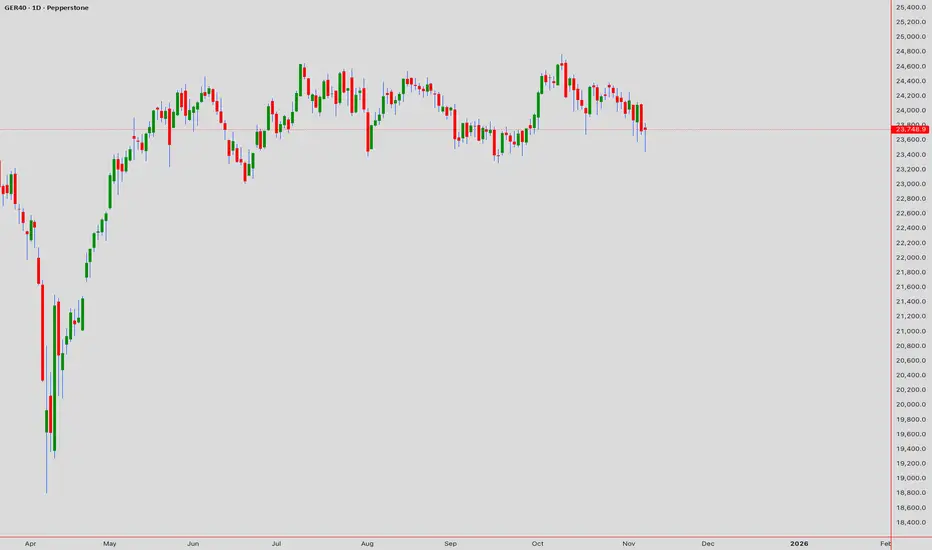
GER40 (DAX INDEX) TECHNICAL ANALYSIS# 📊 GER40 (DAX INDEX) TECHNICAL ANALYSIS 🎯
## Week of November 10-14, 2025 | Intraday & Swing Trade Mastery
Close Price: 23,748.9 Points | Entry Point: November 8, 2025, 12:54 AM UTC+4 📈
## 🔍 EXECUTIVE SUMMARY - MULTI-TIMEFRAME PERSPECTIVE
The DAX (GER40) is trading at a pivotal technical juncture with multi-timeframe alignment suggesting imminent breakout potential. Elliott Wave analysis reveals completion of corrective cycles, positioning for the next impulse leg targeting 24,200-24,500 extension. Bollinger Bands display classic compression pattern —volatility squeeze preceding directional expansion. RSI across all timeframes maintains neutral bullish bias (55-65 range)—optimal momentum positioning without extreme overbought. Volume clustering at 23,700-23,800 represents institutional accumulation foundation. Wyckoff spring tests near 23,500 provide aggressive entry triggers. Harmonic pattern convergence at 23,950-24,050 resistance signals breakout confirmation zone with measured move targets extending to 24,300+.
## 📊 TIMEFRAME-BY-TIMEFRAME ANALYSIS
### 5-MINUTE (Scalping Execution) ⚡
Candlestick Formation: Japanese candles reveal micro-consolidation breakout attempts with successive hammer/engulfing patterns at support zones. Evening Star rejection formations detected at 23,850-23,900 intraday resistance.
Elliott Wave 5M: Sub-wave completion indicates Wave 4 micro-consolidation finalizing. Wave 5 breakout anticipated above 23,800-23,850 with targets 23,920-24,000 (measured move).
Bollinger Bands: Upper compression mode—middle band at 23,750 acts as pivot point. Lower band rejection (23,680-23,710) creates scalp-long setups. Squeeze breakout targets 23,900+ on volume.
RSI (14) Analysis: RSI oscillating 44-60 range—neutral with minor divergences forming. Bullish divergence at 23,720 support signals buyer engagement; caution on 60+ resistance approach.
Micro Support/Resistance: 23,680 (micro-support) | 23,720 (POC cluster) | 23,780 (pivot) | 23,850 (intraday resistance) | 23,920 (scalp target)
Volume Signature: Volume concentrated 23,740-23,760 zone—institutional marker. Breakout volume >40% above average required above 23,850 for sustained move above 23,950.
VWAP Alignment: Price oscillating around session VWAP at 23,745—each touch generates scalp opportunity. Upper VWAP band at 23,880; lower support at 23,680.
### 15-MINUTE (Quick Swing Gateway) 🎢
Candlestick Patterns: Engulfing bars forming at support zones—bullish engulfing at 23,710 zone confirms reversal attempts. Three-candle patterns (flag continuation) with 35-55 pip breakout potential.
Harmonic Pattern Recognition: Gartley Pattern potential completion near 23,700-23,750 PRZ (Potential Reversal Zone). Exceptional risk-reward at 1:3.2 for harmonic traders. Butterfly variant also forming at secondary levels.
Wyckoff Accumulation Phase: Classic accumulation evident—small barometer move (SBM) nearing completion. Spring test anticipated 23,580-23,620 zone; markup phase targets 24,050-24,150.
Bollinger Bands (15M): Band squeeze intensifying—historical volatility expansion suggests 50-80 pip moves follow. Upper band resistance at 23,920; lower band support at 23,620.
Volume Profile (15M): Point of Control (POC) at 23,740—prime concentration zone. Volume surge >50% required confirming breakout above 23,900. Imbalances favor upside probability.
Ichimoku Cloud (15M): Price consolidating below cloud edge—Tenkan-sen at 23,880 = resistance pivot. Kijun-sen (23,820) = critical secondary support. Cloud support 23,650-23,700.
EMA Structure: EMA 9 (23,745) above EMA 21 (23,715)—bullish alignment confirmed. Price remaining above both = intraday strength maintained.
### 30-MINUTE (Intraday Swing Axis) 🔄
Pattern Formation: Symmetrical Triangle pattern consolidating with apex near 23,950. Ascending triangle variant shows bullish bias—breakout above 23,900 targets 24,050-24,150 extension.
Dow Theory Application: Confirming higher highs/higher lows structure. Secondary trend bullish; pullbacks to EMA 20 (23,760) = optimal swing entry zones.
RSI Divergence Setup: Positive RSI divergence confirmed—price making lower lows (23,680) while RSI forms higher lows (42 level). Classic reversal setup targeting 23,950 minimum.
Exponential Moving Average: EMA 9 (23,760) = core support. EMA 21 (23,715) = secondary support. EMA 50 (23,600) = structural hold level. Bullish ribbon alignment intact.
Support Architecture: 23,600 (EMA 50/structural) | 23,680 (demand zone) | 23,720 (volume cluster) | 23,760 (EMA 9 dynamic)
Resistance Architecture: 23,850 (triangle formation) | 23,950 (measured move target) | 24,050 (weekly resistance) | 24,150 (extension)
Volume Analysis (30M): Increasing volume on recent bars—accumulation signature strong. Buy volume exceeding sell volume confirms institutional interest.
### 1-HOUR (Core Swing Trade Foundation) 🎯
Elliott Wave Structure: Major wave analysis suggests Wave 3 completion near 24,100. Current Wave 4 correction targets 23,750-23,850 support zone. Wave 5 impulse anticipated—target: 24,300-24,450.
Pennant Formation: Classic Bullish Pennant pattern forming—breakout confirmation above 23,900 validates pattern. Pole height measured move = 24,200+ target.
Bollinger Bands (1H): Upper band at 24,050 = squeeze breakout target. Middle band (23,900) = bullish support. Lower band rejection (23,650) creates premium swing longs with excellent R/R.
VWAP Daily: DAX trading above daily VWAP at 23,720—bullish gradient confirmed. Each hourly candle close above VWAP strengthens continuation probability.
Volume Profile Hotspot: Heavily traded at 23,720-23,800 (accumulation) and 23,900-23,950 (resistance cluster). Imbalances above 24,000 suggest vacuum-fill potential.
Ichimoku Cloud Alignment: Price above Senkou Span A (23,850) & Span B (23,780)—cloud thickness strong support indicator. Chikou Span above candles = bullish confirmation. Cloud color: BULLISH GREEN.
Gann Theory Application: 45-degree angle from swing low (23,500) establishes rally trajectory. Resistance at 38.2% Fibonacci extension (23,950) precedes aggressive breakout phase.
Support Tiers 1H: 23,600 (structural hold) | 23,700 (EMA support) | 23,750 (Kijun-sen) | 23,800 (accumulation zone)
Resistance Tiers 1H: 23,900 (breakout trigger) | 23,950 (extension) | 24,050 (major level) | 24,150 (impulse target)
### 4-HOUR (Swing Trade Thesis Foundation) 💼
Inverse Head & Shoulders Pattern: Potential IH&S formation completing—left shoulder (23,450), head (23,350), right shoulder completing (23,550-23,650). Neckline breakout at 23,900 targets 24,100-24,250 extension.
Wyckoff Accumulation Deep Dive: Institutional buying signature evident—SBM completion imminent. Spring test to 23,500-23,550 anticipated; subsequent markup phase targets 24,150-24,350.
RSI 4H Analysis: RSI at 58-68 range—bullish bias maintained. Room for upside extension without extreme overbought. RSI above 75 targets 24,200+; below 35 = defensive posture required.
Cup & Handle Formation: Potential bullish Cup pattern visible—handle stabilization near 23,750-23,850. Breakout above handle (23,950) targets cup depth extension = 24,150-24,250.
EMA Ribbon Structure: EMA 8 (23,780), EMA 13 (23,760), EMA 21 (23,715), EMA 50 (23,600), EMA 200 (23,200)—BULLISH ALIGNMENT PERFECT. Compression/expansion cycles identify momentum phases.
Support Tiers 4H: 23,500 (structural support) | 23,600 (accumulation) | 23,720 (pivot) | 23,800 (demand cluster)
Resistance Tiers 4H: 23,900 (key breakout) | 23,950 (extension) | 24,050 (major target) | 24,150 (weekly projection)
Volume Signature 4H: Accumulation volume bars > distribution bars—bullish bias maintained. Volume nodes clustering at 23,720-23,800 indicate institutional support.
### DAILY CHART (Macro Swing Thesis) 📅
Elliott Wave Macro: We're potentially in Wave 3 of larger cycle—aggressive expansion still possible. Wave structure supports break of 24,050 targeting 24,300-24,500 daily close objectives.
Double Bottom Recognition: Historical Double Bottom pattern near 23,200-23,350 support—confirmed breakthrough above 23,900 neckline triggered. Second target near 24,200-24,300.
Bollinger Bands Daily: Upper band at 24,300 = realistic daily target. Mean (23,950) = healthy pullback support. Band slope indicates volatility expansion—expect 200-350 point daily ranges.
Volume Profile Daily: Strong buying volume bar at 23,500-23,700 zone—institutional accumulation marker established. Selling volume decreasing significantly—demand controls trend.
Ichimoku Cloud Daily: Cloud thickness growing—bullish trend strengthening substantially. Cloud support around 23,700-23,850 zone. Kumo breakout anticipated—targets cloud top at 24,000-24,100.
Harmonic Analysis Deep: Butterfly Pattern potential completion—PRZ at 23,900-23,950 suggests reversal zone OR breakout confirmation. Confluence amplifies probability of extension.
Gann Angles & Fibonacci: 50% retracement (23,600) + 61.8% extension (24,100) = key reversal zones. Gann fan angles suggest 24,000-24,100 as structural resistance before continuation.
Key Daily Support: 23,350 (psychological/structural) | 23,500 (accumulation zone) | 23,650 (demand level) | 23,750 (midpoint)
Key Daily Resistance: 23,900 (breakout trigger) | 23,950 (extension) | 24,050 (measured move) | 24,200 (weekly target)
Trend Confirmation: Higher highs & higher lows maintained—uptrend intact. Daily close above 24,000 = strong continuation signal targeting 24,300+ next level.
## 🎪 TRADING SETUP PLAYBOOK - NOV 10-14
### BULLISH SCENARIO (Probability: 78%) ✅
Trigger: 4H candle close above 23,950 + volume surge (>45% above average) + RSI above 62
Entry Zone: 23,850-23,900 (with breakout confirmation)
Target 1: 23,950 (TP1) | Target 2: 24,050 (TP2) | Target 3: 24,200 (TP3) | Target 4: 24,300 (TP4)
Stop Loss: 23,700 (below EMA/structural support)
Risk/Reward: 1:3.1 (exceptional asymmetric setup)
Trade Duration: 18-72 hours (prime swing window)
### BEARISH SCENARIO (Probability: 22%) ⚠️
Trigger: Daily close below 23,800 + volume increase + RSI divergence failure
Entry Zone: 23,950-24,050 (short setup)
Target 1: 23,900 (TP1) | Target 2: 23,800 (TP2) | Target 3: 23,700 (TP3)
Stop Loss: 24,150 (above resistance)
Risk/Reward: 1:1.6 (acceptable but lower probability)
Trade Duration: Watch for trend reversal confirmation first
## ⚠️ VOLATILITY & OVERBOUGHT/OVERSOLD CONDITIONS
Current Volatility Status: Moderate compression → Expect significant expansion imminent
5M/15M RSI: 44-60 range (neutral)—room for 20-40 point movements | Scalp target zones
30M/1H RSI: 52-68 range (bullish bias, safe zone)—sweet spot for swing entries
4H RSI: 58-72 range—approaching caution zone but room to extend | Safe for core swings
Daily RSI: 62-75 range (approaching extremes)—be defensive if daily RSI>78 | Take profits aggressively
Overbought Recognition Points:
RSI daily >77 combined with upper Bollinger Band rejection = immediate profit-taking
Ichimoku cloud top penetration fails (bearish candle rejection) = trend exhaustion signal
Volume declining on breakout attempt = false breakout warning signal
Harmonic pattern PRZ exact hit without follow-through = reversal likely imminent
Oversold Bounce Setups:
RSI 1H <32 on support touch = high-probability bounce back to 23,900-23,950
Price below EMA 50 (23,600) + RSI <30 = aggressive accumulation zone
Spring test below 23,550 with volume surge = Wyckoff spring reversal trigger
Harmonic pattern PRZ support bounce = measured move extension targets activated
## 🎯 ENTRY & EXIT OPTIMIZATION STRATEGY
### OPTIMAL ENTRY TIMING
For Scalpers (5M): RSI bounce from 42-48 zone after Band lower touch = 15-25 point scalp (1-3 min holds)
For Quick Swings (15M-30M): 15M candle close above 23,850 with 4H alignment = 80-120 point swing (30 min-2 hour holds)
For Core Swings (1H-4H): 4H pennant breakout above 23,950 on volume = 200-350+ point target (hold 12-48 hours)
For Position Swings (Daily): Daily close above 24,050 = continuation play targeting 24,200-24,300 (hold 5-7 days)
Best Entry Windows: Frankfurt open (7:00 CET), London open (8:00 CET), NY open (14:30 CET)
### EXIT STRATEGIES & PROFIT TAKING
Take Profit Levels: TP1: Fibonacci 38.2% (23,950) | TP2: Harmonic PRZ (24,000) | TP3: Daily Band upper (24,150) | TP4: Weekly target (24,300)
Stop Loss Placement: Always below most recent swing low + 15 points (strict risk management priority)
Trailing Stops: Activate at TP2—trail with 35-45 point buffer for 4H+ trades (lock in profits)
Breakeven Exit: Move stops to entry after 1:1 risk/reward achieved—eliminate emotional trading
Partial Profit Strategy: Close 25% at TP1 | 25% at TP2 | 25% at TP3 | Let 25% run to TP4 (maximize winners)
## 🔔 REVERSAL & BREAKOUT RECOGNITION CHECKLIST
### REVERSAL SIGNALS TO MONITOR:
RSI positive divergence (lower price lows, higher RSI lows) = bullish reversal setup high probability
Candlestick engulfing patterns at support/resistance zones = trend reversal confirmation strong signal
Volume profile breakdowns (declining volume on breakout attempts) = false move warning immediate
Ichimoku Cloud rejection (price fails to penetrate cloud layer) = structural resistance confirmed
Harmonic pattern completion at exact PRZ = reversal zone probability increases significantly
Elliott Wave 5th wave failure (truncation) = impulse completion = reversal imminent trigger
Gann angle break through significant angle = trend line break = reversal trigger activated
### BREAKOUT CONFIRMATION RULES:
Close beyond resistance with >40% volume surge above average = confirmed breakout signal strong
RSI crosses above 60 for bullish breakout, below 45 for bearish breakout confirmation
VWAP alignment with directional move = institutional participation confirmation strong
Bollinger Band breakout with band expansion (squeeze release) = volatility expansion confirmed immediate
Multiple timeframe confluence (5M + 15M + 1H + 4H aligned) = highest probability setup attainable
Ichimoku Cloud break (price clears all clouds with bullish candles) = strong continuation signal
Volume imbalance (ask volume > bid volume) = directional sustain likelihood increases significantly
## 💡 WEEK FORECAST SUMMARY - NOV 10-14
Monday (10th): 🌍 Consolidation continuation near 23,750-23,850 zone. Range-bound trading anticipated. Early breakout direction watch crucial. Entry setups favor reversal plays at support.
Tuesday-Wednesday (11-12th): 📈 Prime breakout window opens —23,900 represents key decision point. Expect 150-250 point daily volatility. Breakout confirmation targets 24,000-24,050 extension. This is the optimal swing trade window.
Thursday (13th): ⚠️ Potential profit-taking pullback after breakout (if triggered). Support retest of 23,950-23,850. Buying opportunity if pullback holds above 23,750.
Friday (14th): 📊 Weekly close pattern formation critical. Extension run anticipated if above 24,050. If above 24,100 = week target 24,200-24,300 achieved. End-of-week positioning for next week.
## 📍 CRITICAL CONFLUENCE ZONES - KEY TARGETS
23,500-23,550: Major support zone (accumulation marker, Wyckoff spring area, structural hold)
23,650-23,750: Secondary support (EMA 9, demand cluster, psychological level, volume POC)
23,800-23,850: Micro-resistance cluster (consolidation squeeze zone, early breakout resistance)
23,900-23,980: KEY BREAKOUT ZONE (triangle apex, harmonic confluence, all timeframe resistance)
24,000-24,100: Primary upside target (Elliott Wave 5, daily Band upper, measured move extension)
24,150-24,250: Secondary extension target (Gann level, macro resistance, wave projection)
24,300+: Weekly/monthly target (if wave 5 impulse extends beyond base projections)
## 🏆 RISK MANAGEMENT RULEBOOK
✅ 1) Position Sizing: Never risk >2% of account equity per single trade
✅ 2) Risk-Reward Ratio: Minimum 1:2.5 R/R on every entry—1:3+ preferred for swing trades
✅ 3) Profit Scaling: Close 25-50% at 1:1 ratio, let remainder run to 1:2+ targets
✅ 4) Stop Loss Discipline: Place stop IMMEDIATELY on entry—no exceptions (15-20 points tight)
✅ 5) Breakout Confirmation: Avoid FOMO—wait for candle close confirmation + volume surge always
✅ 6) Daily Support Respect: Psychological holds (round numbers 24,000) matter—trade confluence not against
✅ 7) Time Management: Exit losing trades quickly (max 1:0.5 acceptable for educational losses)
✅ 8) Macro Alignment: Always check daily/4H bias before taking 1H or lower trades
## #GER40 #DAX #DAXINDEX #TRADINGSETUP
#TECHNICALANALYSIS #ELLIOTTWAVE #HARMONICPATTERN #BREAKOUTTRADING
#SWINGTRADER #DAYTRADING #INTRADAY #INDICES #TRADINGVIEW
#BOLLINGER BANDS #RSI #ICHIMOKU #VWAP #TRADINGSTRATEGY
#WYCKOFFMETHOD #GANNTHEORY #DOWTHEORY #TECHNICALS #ANALYSIS
#SUPPORTANDRESISTANCE #VOLUMEANALYSIS #OVERBOUGHT #OVERSOLD #REVERSAL
#STOCKINDEXTRADING #GERMANYINDEX #BREAKOUTSETUP #TRADERSOFTWITTER
#TECHNICALTRADER #CANDLESTICK #PATTERRECOGNITION #CHARTANALYSIS #DAYTRADER
## 🎁 BONUS: DAILY PRE-MARKET CHECKLIST
Use this every morning before market open:
☑️ Check daily RSI (should be 60-70 for bullish bias continuation)
☑️ Identify support/resistance zones (23,700 | 23,850 | 23,950 | 24,100)
☑️ Verify 4H chart alignment (pennant/IH&S pattern status update)
☑️ Check Ichimoku cloud position (above/below = trend confirmation signal)
☑️ Review 1H Elliott Wave count (which wave are we trading exactly?)
☑️ Scan volume profile (POC = likely rejection zone area)
☑️ Set entry orders + stop losses BEFORE Frankfurt market opens
☑️ Plan 3 Take Profit levels before entering any position
☑️ Monitor economic calendar (ECB events, German data releases)
## 🌐 EUROPEAN SESSION NOTES
The DAX trades primarily during Frankfurt hours (7:00-17:30 CET) . Highest volatility typically occurs:
Frankfurt Open (7:00-8:00 CET): Initial direction breakout—watch for 50-100 point moves
London Overlap (8:00-12:00 CET): Prime trading hours —best liquidity + volatility combination
NY Open (14:30 CET): Secondary volatility surge—often confirms/reverses DAX direction
💡 Disclaimer: This technical analysis is educational only. Always conduct your own due diligence and implement appropriate risk management. Past performance does not guarantee future results. Trade responsibly within your risk tolerance. Use stop losses on every position. Not financial advice.
Analysis Created: November 8, 2025 | Valid Through: November 14, 2025 | Updated Daily
XAU/USD – Holds Its Range, Preparing for a Year-End Expansion🔍 Market Context
Friday’s New York session closed with a two-sided liquidity sweep, yet gold managed to hold its structural balance, maintaining the same rhythm seen over the past two weeks — sideways to mildly bearish, but firmly supported.
This behavior shows that buyers are still defending key zones, especially around 3,940$ – 3,980$, which MMFLOW highlighted multiple times last week as the decisive liquidity floor.
From a macro lens, the Fed’s cautious tone has slowed expectations for aggressive rate cuts — but the probability of another reduction before Q1 2026 remains alive.
As we move toward the final stretch of the year, thinner liquidity and seasonal safe-haven flows could help gold establish a mid-term bottom, setting the stage for the next impulsive leg.
📊 Technical Structure (H4)
The current chart presents a clear 5-wave recovery structure within a tightening range — a classic setup before expansion.
Key Technical Zones:
• 💎 Support Zone: 3,942$ – 3,982$ (liquidity base + strong absorption area)
• 🎯 Wave 3 Target: 4,072$ – 4,133$ (first reaction zone)
• ⚙️ Extended Target / Wave 5: 4,189$ – 4,201$ (Fibo 1.618 projection)
• ⚠️ Invalidation: Below 3,940$ → loss of short-term structure, possible re-accumulation lower.
The structure remains sideways but constructive, and a confirmed breakout of the descending trendline could act as the catalyst for a year-end bullish continuation.
🎯 MMFLOW TRADING View
Smart money continues to accumulate within equilibrium zones, with every liquidity sweep appearing more like preparation than rejection.
As long as gold stays above 3,970$, the bullish bias remains valid — with a 60%+ probability of a move toward 4,130$+ in the short to mid-term.
Historically, November–December often brings portfolio rebalancing and policy easing cycles, both of which may serve as fuel for a potential gold rally into Q1 2026.
⚜️ MMFLOW Insight:
“Accumulation isn’t waiting — it’s when big money quietly builds the next wave.”

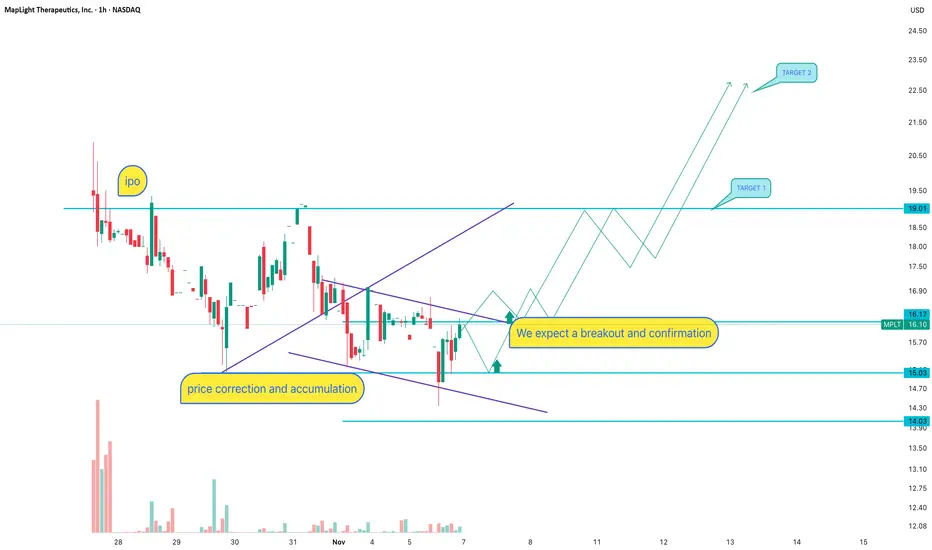
MPLT: Is the IPO working according to a scenarioAfter the IPO, the stock is forming a falling wedge — a classic post-listing accumulation pattern. Price is consolidating between the 15.03 support level and the accumulation zone. We see a trendline breakout attempt and price trying to hold above. The key resistance is 19.01, aligning with the previous consolidation range. Lowering volume indicates seller exhaustion. Scenario: breakout above 16.20 and confirmation gives a path toward target 1 at 19.01, with a potential impulse toward 22.50 (target 2). Entry only after breakout + retest. Without a retest, the risk of a fake breakout increases.
MPLT is a biotech company newly listed on NASDAQ. Post-IPO stocks often go through correction and accumulation while the market defines fair value. FDA updates or clinical trial results can act as catalysts — biotech names tend to move aggressively on news. If institutional interest increases, the trend may accelerate quickly.
If the breakout confirms — the rocket won’t wait for you to fasten your seatbelt. Let price show direction instead of forcing an entry inside noise.
BTCUSD Short: Bearish Rejection Targeting $100.6K Support ZoneHello traders! Bitcoin (BTCUSD) continues to trade within a well-defined descending channel, reflecting sustained bearish pressure after the rejection from the $116,000 Supply Zone. The market previously experienced a Fibonacci Arc retracement followed by a strong sell-off, signaling exhaustion from buyers and the formation of a broader corrective structure.
Currently, we have seen multiple fake breakouts on both the upper and lower boundaries of the channel, suggesting that liquidity sweeps are actively influencing volatility. Notably, price recently tapped the major Demand Zone around $100,600, a level that has historically triggered strong reactions. The sharp wick and immediate recovery from this support indicate buyer accumulation and defense of the zone. A short-term pivot point has now formed near $103,500–$104,000, marking a key decision area. If buyers hold above the $100,600–$101,000 support, a corrective move toward the upper channel boundary becomes increasingly likely.
I expect Bitcoin to retest the $103,500–$105,000 Pivot Resistance Zone, which aligns with the mid-channel level and previous breakout point. If price shows rejection in this region — such as bearish candlestick patterns or weakening momentum — it would provide a favorable entry point for short positions. A break and hold below $100,600 would strengthen bearish momentum and may trigger a continuation toward $98,000. However, if the price breaks and closes above $105,200, the short setup becomes invalid, as this would signal a potential shift in structure and a move toward $110,000. Manage your risk!

EURUSD Long: Rebound Setup Targeting 1.1560 Pivot ResistanceHello traders! EURUSD continues to trade within a clearly defined descending channel, maintaining a consistent bearish structure characterized by lower highs and lower lows. The recent rejection from the 1.1660 Supply Zone once again confirmed strong seller presence at that level. Additionally, the fake breakout above the channel resistance further highlighted the inability of buyers to shift the market structure.
Currently, price continued moving lower and is now testing the 1.1475–1.1500 Demand Zone, which aligns with the lower boundary of the descending channel. This area has previously acted as a reaction zone, meaning buyers have shown interest here before. The recent candle structure suggests that bears are slowing down near the demand area, indicating potential for a corrective pullback rather than immediate continuation downward.
In my opinion, If buyers manage to defend the 1.1475 Demand Zone, we could see a short-term bullish rebound toward the 1.1560 Pivot Resistance. This creates a favorable area for short-term long positions aiming for corrective upside movement. However, if sellers break below 1.1475 and price closes beneath the demand line, this would signal continuation of the primary bearish trend, opening the path toward lower levels around 1.1420–1.1380. For now, as long as price holds above the demand zone, a corrective rebound remains the more probable scenario. Manage your risk!

NFP: Dollar surge or market meltdown?On Friday, November 7, 2025, at 15:30 EET , the U.S. Bureau of Labor Statistics will release the Non-Farm Payrolls (NFP) report — a market-moving event that can reshuffle investor expectations in a matter of minutes. For traders and investors, it’s a real-time test: is the economy slowing enough to justify Fed easing, or are wages rising too fast, fueling services inflation and keeping core CPI elevated?
How to read the NFP: 5 key signals for traders
Jobs added . A print above forecasts signals strength; below expectations suggests weakness.
Unemployment rate . A rise above consensus = cooling labor market; a drop = tight conditions.
Wages . Rising faster = inflation risks and hawkish Fed; slowing = case for softer policy.
Revisions . Changes of ±50–100K to past months can flip the current release’s narrative.
Quality metrics . Hours worked, labor force participation, sector breakdown — broader and stronger growth if these are healthy.
The November 7 NFP isn’t just another jobs report — it’s a stress test for rate expectations and risk appetite . Market reactions will depend on the full mix of employment numbers, unemployment rate, wage growth, and revisions

Fundamental Market Analysis for November 7, 2025 USDJPYUSD/JPY is consolidating after a swift rise toward 154.000: some investors are taking profit amid stronger demand for safe-haven assets and verbal signals from Japanese authorities about the undesirability of excessive volatility. Increased caution in equity markets also supports the yen via the safe-haven channel, limiting further weakening of the Japanese currency.
At the same time, the overall fundamental backdrop for the pair is mixed: the yield differential still favors the U.S., but the pace of its widening has slowed, and market expectations for future Fed steps have softened as some components of employment data cooled. Any hints that Tokyo is ready to step up measures against excessive yen weakness increase the market’s sensitivity to downside corrections in USD/JPY.
In practice this creates conditions for tactical selling on rallies: with lingering nervousness and potential intervention-related comments from Japan’s Ministry of Finance, the short-term bias tilts lower. As of November 7, the pair trades around 153.100–153.300; pullbacks to 152.500–152.000 look plausible if U.S. yields ease and safe-haven demand persists.
Trading recommendation: SELL 153.250, SL 153.550, TP 152.450

BTCUSD: Falling Wedge Reversal in Play Toward 106KHello everyone, here is my breakdown of the current Bitcoin setup.
Market Analysis
Bitcoin (BTCUSD) has recently shown signs of recovering bullish momentum after rebounding from the 100,600–101,000 Support Zone, which has acted as a key demand region during previous tests. The market experienced a fake breakout below the wedge support line, but buyers quickly stepped back in, pushing the price back inside the structure — a classic indication of seller exhaustion and accumulation interest.
Currently, BTC is trading inside a falling wedge pattern, which is typically considered a bullish reversal formation. The recent bounce from the lower boundary suggests that buyers are attempting to regain control, especially after the sharp decline from the 113,700 Resistance Zone. The price is now gradually approaching the mid-range of the wedge, signaling a potential continuation toward the upper resistance line.
My Scenario & Strategy
If Bitcoin holds above the 100,600–101,000 support, the bullish scenario remains valid. I expect the price to gradually move toward the 104,000–106,000 area as the next short-term target, aligned with the wedge resistance line. A breakout and confirmed hold above the wedge resistance would likely signal a trend reversal, opening the door for a larger continuation toward the 113,700 resistance zone, and possibly beyond.
However, if BTC loses the 100,600 support again and closes below the wedge, this would invalidate the bullish setup and could trigger a deeper move toward 98,000 before a new structure forms.
That's the setup I'm tracking. Thank you for your attention, and always manage your risk.

EURUSD Holds Key Support — Potential Recovery Toward 1.1540Hello traders, I’d like to share my view on EURUSD. The market has been trading in a consistent downtrend, respecting the descending Resistance Line, which has acted as a strong dynamic barrier for price throughout the recent move. Each attempt to break above this trendline resulted in either a turnaround or a fake breakout, confirming continued bearish pressure. However, recently price has reached an important Buyer Zone near 1.1480, where strong reaction has been seen several times in the past. This area aligns with horizontal support, increasing its significance. After touching the buyer zone again, EURUSD has shown initial signs of accumulation and early bullish momentum. Currently, the price is attempting to recover from this demand area, forming a breakout above the short-term Support Line — which now potentially flips into bullish structure. From here, I expect EURUSD to attempt a move toward the next resistance area around 1.1540, which represents the nearest Resistance Level. A confirmed breakout above this zone would open the path toward the higher Seller Zone around 1.1660, where previous fake breakouts occurred. But for now, the key confirmation will be whether the price holds above 1.1480 Buyer Zone. A breakdown below the zone would invalidate the bullish setup and likely continue the downtrend. Please share this idea with your friends and click Boost 🚀

Gold Forms Higher Low — Potential Upside Toward Resistance LineHello traders, here’s my current outlook on Gold (XAUUSD). Gold has recently transitioned out of a strong bearish phase, where the price moved inside a descending channel and found significant support near the $3,930–$3,950 Buyer Zone. This support zone has proven to be a key reaction level multiple times, with several fake breakouts followed by strong bullish recoveries — confirming the presence of active buyers. After breaking out of the descending channel, the price began forming a higher-low structure, aligning along the Support Line, suggesting that bullish momentum is gradually returning. However, the market remains capped by the Resistance Line, where several strong rejections occurred, indicating that sellers are still defending higher levels. At the moment, Gold is trading between the Buyer Zone and the $4,020–$4,140 Resistance Zone (Seller Zone). If buyers manage to hold support and form another bullish push from the current levels, we could see an upward move targeting the $4,020 area first, and if momentum continues — a potential retest of the key resistance at $4,140. For now, the structure shows accumulation above strong support, suggesting that buyers still have the advantage. Please share this idea with your friends and click Boost 🚀

GBP/USD – BoE Rate Decision Ahead |(06.11.2025)🧠 Setup Overview:
GBP/USD is trading inside a descending channel, with price recently rebounding from a strong support zone near 1.3000.
Ahead of the Bank of England (BoE) interest rate decision, the pair is positioned for a possible bullish breakout if the BoE maintains rates and highlights inflation risks.
📊 Trading Plan:
Bullish Scenario:
If the BoE holds rates and remains cautious on inflation → expect GBP/USD to rebound toward 1.3120 – 1.3180.
Breakout confirmation above channel resistance will strengthen the bullish view.
Bearish Scenario:
If the BoE signals dovish tone or hints at future rate cuts, GBP/USD could drop below 1.3000, targeting 1.2850 – 1.2710.
⚙️ Technical Levels:
🟢 1st Resistance: 1.3133
🟢 2nd Resistance: 1.3171
🔴 Support Zone: 1.3000 – 1.3020
Pattern: Falling Channel → Potential Breakout
🧩 Fundamental Insight (Today – 6 Nov 2025)
1.Markets price a 1-in-3 chance of a BoE rate cut to 3.75%, but consensus expects a hold at 4.00%.
2.UK inflation at 3.8% YoY remains above the BoE’s target, supporting a hawkish stance.
3.A surprise dovish tone, however, could hit the pound hard against the USD, especially as US data remains resilient and the dollar stays firm.
#GBPUSD #BoE #Forex #TechnicalAnalysis #PriceAction #ChartPatterns #KABHI_TA_TRADING #FundamentalAnalysis #BankOfEngland #InterestRates #FXMarket #TradingPlan #ForexSetup #ChartsDontLieTradersDontQuit #GBP #USD #TradingView
⚠️ Disclaimer:
This analysis is for educational purposes only and not financial advice. Always do your own analysis and manage risk carefully before trading news events.
💬 Support My Work ❤️
If you find this chart helpful — LIKE 👍, COMMENT 💭, and FOLLOW 🔔 to stay updated with more daily Forex setups and price action insights!

USD/JPY(20251107)Today's AnalysisMarket News:
Revelo Labs, a US private data provider, reported that US non-farm payrolls decreased by 9,100 in October; Challenger job cuts in the US surged 175% year-over-year in October, and year-to-date layoffs increased by 65%; Chicago Fed data showed the October unemployment rate was approximately 4.36%, a four-year high. Federal Reserve officials remain cautious. Chicago Fed President Goolsby believes a lack of reliable inflation data and remains hesitant about interest rate cuts; Cleveland Fed President Hammarck emphasized inflation risks and opposed further rate cuts; however, Governor Milan continues to expect a Fed rate cut in December; New York Fed President Williams believes the model-based estimate of the US neutral interest rate is around 1%. Governor Barr pointed out that the impact of artificial intelligence may be affecting hiring in some industries.
Technical Analysis:
Today's Buy/Sell Threshold:
153.33
Support and Resistance Levels:
154.63
154.15
153.83
152.83
152.52
152.03
Trading Strategy:
If the price breaks above 153.33, consider buying with a first target price of 153.83.
If the price breaks below 152.83, consider selling with a first target price of 152.52.

Don’t Rush the AI Infrastructure Arms Race: Waiting Could Win### Don’t Rush the AI Infrastructure Arms Race: Why Patience Could Win
In the tech sector, the urge to invest heavily in GPUs and data centers is strong—to capture market share before competitors do. However, early movers risk a dangerous trio: skyrocketing capital expenditures (capex), fast hardware obsolescence, and inflexible financing. A wiser strategy for many investors and operators? Pause non-essential spending, secure options on emerging technologies like photonic and optical computing, and wait for innovations to mature before locking in major commitments.
#### 1. Hyper-Capex Meets Power Shortages
Big tech firms are projected to spend $350–$400 billion on capex in 2025, mostly for AI infrastructure, with global AI investments potentially hitting $1–2 trillion by 2029 (Goldman Sachs, 2025 forecast). U.S. data center power demand is expected to triple by 2030, surging 22% in 2025 alone (Electric Power Research Institute). Governments, including the U.S. DOE, are already considering power rationing for data centers amid grid strain—echoing overbuild risks in resource-limited sectors like semiconductors (WIRED, Oct 2025).
#### 2. The Hardware Treadmill Accelerates Obsolescence
NVIDIA's high-end GPUs now launch annually (e.g., Blackwell in 2024 to Rubin in 2025), with power draw rising to ~1,200W per unit (NVIDIA Q3 2025 earnings). This shortens cluster lifespans from 3–5 years to 1–2 years, stranding investments in cooling systems and networks. AMD and Intel follow suit, per CUDO Compute's 2025 analysis, amplifying depreciation costs by 40–50% for outdated setups.
#### 3. Financing Shifts to Debt at Peak Cycle Risk
AI projects increasingly rely on debt: Over $200 billion in AI-related bonds issued in 2025, including $30 billion single deals for data centers (Bloomberg). Off-balance-sheet financing for mega-campuses adds leverage, but with hardware depreciating rapidly, any ROI dip could erode equity value—mirroring the 2022 crypto mining debt crisis (Financial Times, Nov 2025).
#### 4. Photonic and Optical Computing Gains Traction
Silicon photonics and optical interconnects offer 10x bandwidth with 50–70% less energy use for AI workloads (Lightmatter whitepaper, 2025). Firms like Lightmatter and Celestial AI are deploying optical I/O in pilots, targeting full photonic accelerators by 2027. Locking into copper-based systems now could leave investors with inefficient "thermal walls," as optical scales to exascale computing (MIT Technology Review, Sep 2025).
#### 5. Ternary Logic: A Disruptive Wild Card
Ternary (base-3) computing, using three states per bit, could boost efficiency 30–50% over binary for AI inference (IEEE Spectrum, 2025). Revived via neuromorphic chips from startups like Mythic, it's lab-proven but not scaled—yet it highlights the peril of over-investing in binary ecosystems, much like quantum's threat to classical bits (Wikipedia; arXiv preprints, 2025).
#### 6. Even Leaders Strain for Capacity
OpenAI has tapped $10 billion in credit lines and chip-leasing deals in 2025 to hoard GPUs, per Reuters. This cash-burn approach ties firms to current tech paths; a photonic pivot could disadvantage debt-laden players, favoring agile newcomers with cleaner sheets.
#### Actionable Steps for Investors and Operators
- **Pause Legacy Builds**: Limit GPU/data center capex to projects with >20% IRR under obsolescence/power stress tests. Opt for modular, 18-month depreciation (The Next Platform, 2025).
- **Secure Future Options**: Sign pilot MOUs with photonics leaders; reserve optical upgrades in contracts for penalty-free swaps (Lightmatter, 2025).
- **Flexible Financing**: Use staged debt, pay-as-you-go leases, and vendor rebates tied to milestones—avoiding the leverage traps seen in recent $50B+ issuances (Financial Times).
- **Co-Develop for Priority**: Invest small in non-recurring engineering (NRE) for optics trials; offer AI datasets for faster validation and queue-jumping (IDTechEx report, Q4 2025).
- **Mitigate Power Risks**: Hedge via futures; site builds near renewables with PPAs expandable to 500MW+ to dodge allocation caps (S&P Global Ratings, 2025).
**Bottom Line**: Amid trillion-dollar AI bets, optionality trumps haste. Wait for photonics and advanced logic to commercialize—delivering cooler, cheaper compute—without the drag of obsolete, debt-fueled infrastructure. Patience positions winners for the next curve.
Building a Trading System: From Idea to ExecutionEvery trader starts with an idea — a setup, a pattern, a theory that seems to work.
But until that idea becomes a structured system, it’s just intuition.
A trading system gives your ideas rules, logic, and repeatability.
That’s the difference between a trader who hopes, and a trader who executes.
Define the Core Idea
Every system begins with an observation.
Maybe you notice breakouts after volume spikes, or reversals after RSI divergence.
Whatever the logic, write it down.
A system has to be specific, if you can’t define it clearly, you can’t test it.
Set Your Entry and Exit Rules
Your system should answer three things precisely:
When to enter a trade
When to exit a trade
How much to risk
Ambiguity is the enemy.
Rules make your strategy repeatable, testable, and objective.
Backtest the Logic
Before going live, test your rules on past data.
You’re not looking for perfection, you’re looking for consistency.
If your logic survives bull, bear, and sideways markets, it’s valid.
Track win rate, drawdown, and profit factor — they’ll tell you what’s working.
Execute With Discipline
A system only works if you do.
Follow the rules exactly as tested, even when it feels uncomfortable.
Consistency turns probability into profit — emotions destroy both.
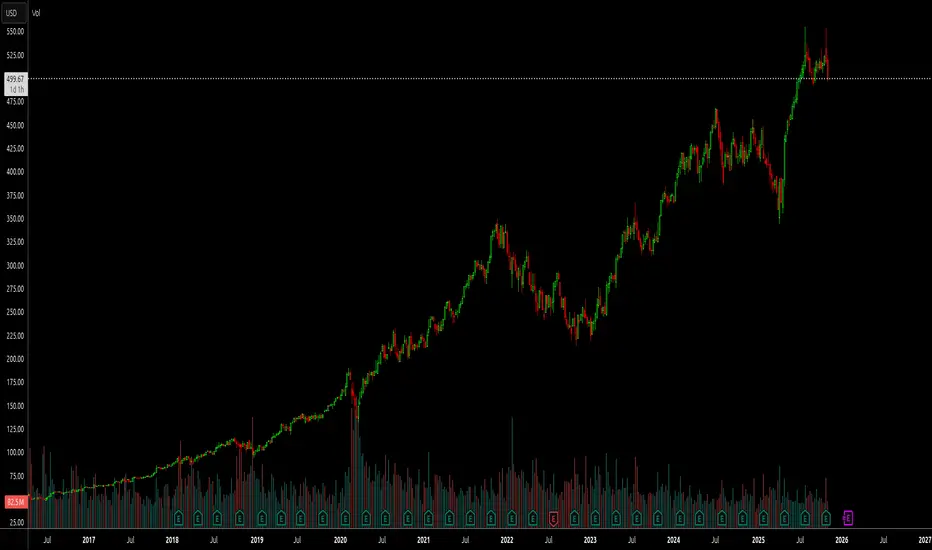
Application
Here we have a very good example from our trading signals where we executed one of our strategies for 10 days. The strategy was designed with detailed inputs, logic and executed with a precise setup in a trading bot.
Refine and Evolve
Once live, keep notes.
Track how the system performs under real conditions.
Make small, measured improvements based on data, not emotion.
A system should evolve, not change its identity.
Redefining and tuning is a part of the process, there is no strategy that lasts forever, everything needs to evolve and adjust!

Risk‑off vs squeeze: the near‑term BTC plan__________________________________________________________________________________
Market Overview
__________________________________________________________________________________
After a swift capitulation into 99–100k, the market is stabilizing on a 12H/1D floor cluster. The regime is mixed: HTFs remain constructive, while ETF outflows and a risk‑off backdrop cap momentum.
Momentum: Bearish-neutral 📉 short term, stabilizing above 101.6–102.1k after capitulation‑type volume.
Key levels:
- Resistances (D/2D) : 103,800–104,063 (D Pivot High), 105,000–105,500 (intraday supply), 109,377 (2D Pivot High).
- Supports (12H/1D/MTF) : 101,616–102,102 (1D/12H floors), 99,700–100,100 (multi‑TF cluster + D Pivot Low 100,267), 98,150–98,613 (2H floor + weekly pivot).
Volumes: Very high intraday (capitulation) and normalizing on 1D.
Multi-timeframe signals: 1W/1D/12H trend up; LTFs repairing. Hold 101.6–102.1k to target 103.8–104.1k; failure reopens 99.7–100.1k.
Risk On / Risk Off Indicator: Neutral sell — aligns with risk‑off macro and partially contradicts the bounce attempt.
__________________________________________________________________________________
Trading Playbook
__________________________________________________________________________________
Context: HTF uptrend versus macro risk‑off; favor tactical buys at supports and avoid chasing breakouts without confirmation.
Global bias: Neutral with a tactical buy tilt while 101.6–102.1k holds; key invalidation: sustained close < 101,616.
Opportunities:
- Buy confirmed pullback at 101,616–102,102 (≥2H/4H bullish) targeting 103.2k then 103.8–104.1k.
- Breakout buy above 104,063 (D close) toward 105.0–105.5k, then 109,377 if momentum persists.
- Tactical sell at 103.8–104.1k on clean rejection, or break/retest below 101,616 toward 100.3k then 99.7–100.1k.
Risk zones / invalidations: Break below 101,616 voids the bounce path and opens 99.7–100.1k; strong rejection at 104k invalidates early longs.
Macro catalysts (Twitter, Perplexity, news):
- Persistent spot BTC ETF outflows — cap upside under resistance.
- Broad risk‑off (Asia equities down, firm USD) — pressure on supports.
- FOMC: -25 bps and QT ending flagged — rate‑volatility, choppy tone.
Action plan:
- Entry: 101,650–102,150 after bullish confirmation (≥2H/4H).
- Stop: ~0.7–1.0% below 101,616 (≈100.9k–100.6k).
- TP1: 103,200–103,400; TP2: 103,800–104,063; TP3: 105,000–105,500.
- Approx R/R: ~2R to 3R depending on fill/stop.
__________________________________________________________________________________
Multi-Timeframe Insights
__________________________________________________________________________________
HTFs remain upward while LTFs repair around the 99.7–100.1k and 101.6–102.1k floor clusters.
1D/12H/1W: Uptrend; price sitting on the 101.6–102.1k cluster. Holding it = stabilization and a path to 103.8–104.1k; daily reclaim above 104,063 opens 105–105.5k then 109,377.
6H/4H/2H: Rebound from 99–100k with very high volume implying local seller exhaustion; first gate 103.8–104.1k, confirmed on closes > 104,063.
1H/30m/15m: Basing above 100k; need a clean reclaim of 102.0–102.8k to extend; time failure if no push within 1–2 bars.
Major divergences/confluences: Bullish confluence at MTF floors + capitulation volume; divergence with the Risk On / Risk Off Indicator (neutral sell) — execute with tactical prudence.
__________________________________________________________________________________
Macro & On-Chain Drivers
__________________________________________________________________________________
Macro is risk‑off with unfavorable ETF flows, likely capping bounces under 104k despite constructive HTFs.
Macro events: Asia equities lower and a firm USD weigh on risk; BOJ remains easy; FOMC: -25 bps and QT ending flagged — more rate vol; US shutdown headlines keep liquidity cautious.
Bitcoin analysis: Weekly “make‑or‑break” band at 101k–103k; large short liquidations above could fuel a squeeze on a decisive reclaim, yet ETF outflows limit upside follow‑through.
On-chain data: Mixed accumulation, softer derivatives, hedging up — stability hides fragility absent fresh inflows.
Expected impact: Prefer reactive buys at floors and demand daily closes > 104,063 before chasing breakouts.
__________________________________________________________________________________
Key Takeaways
__________________________________________________________________________________
BTC is parked in a 101.6–104k decision zone, between sturdy MTF supports and a flow‑capped ceiling.
Overall trend: neutral (HTF up vs macro risk‑off). Most relevant setup: tactical buy at 101.6–102.1k with scaled profit‑taking below 104k, or a confirmed breakout above 104,063. Key macro factor: persistent spot ETF outflows. Stay disciplined: act on floor signals and avoid unconfirmed breakouts.

XAUUSD Long: Demand Line Supporting Move Toward $4,080 TargetHello traders! Gold (XAUUSD) continues to show resilience as price action holds above the key $3,950 Demand Zone, signaling that buyers are still defending this area effectively. After forming a Double Top pattern near the $4,150 Resistance, the market entered a correction phase, which was guided by a clean break below the neckline, followed by a retracement defined by the Fibonacci Arc. This retracement created a series of Pivot Points that now serve as short-term references for buyers and sellers. The price has since found solid support along the Demand Line, aligning with the overall ascending Trend Line that has held firm since early October. Each rejection from this zone has been met with renewed buying pressure, suggesting that the current move could represent a continuation phase within the larger bullish structure.
Currently, gold is trading around the $4,000 level, consolidating just above its Demand Line. If bullish momentum accelerates from this area, we could see a push toward the $4,080 short-term target, followed by a possible test of the $4,150 major resistance — a critical level for confirming a broader breakout.
My base scenario anticipates a gradual upward move toward $4,080, which aligns with both the trend and key resistance confluence. A clean breakout above $4,150 would open the path for a stronger bullish continuation, potentially toward $4,200+. However, a confirmed breakdown below $3,950 could shift short-term sentiment to bearish, exposing the next support area near $3,900. For now, I maintain a bullish bias, expecting further upside momentum as long as the demand structure holds firm. Manage your risk.

EURUSD: Rebound Phase Developing From 1.1510 Support ZoneHello everyone, here is my breakdown of the current Euro setup.
Market Analysis
EURUSD has been forming a complex market structure, transitioning through several distinct phases. Initially, the pair traded within a Range Zone, showing indecision between buyers and sellers. A strong bullish breakout from the range led to the creation of an Upward Channel, where buyers maintained momentum until the price reached the 1.1660 Resistance Zone. This level acted as a significant supply area, resulting in multiple rejection points and eventually a bearish breakout from the channel.
Recently, EURUSD began consolidating in a Descending Triangle Pattern, with the Triangle Resistance Line serving as a dynamic barrier against bullish attempts and the Triangle Support Line acting as a demand zone. Currently, the pair is testing this support zone around 1.1500–1.1480, which has already provided several short-term rebounds. A clear break below this area could confirm a continuation of the bearish structure, potentially pushing price lower toward 1.1450 and even 1.1400. On the other hand, a rebound from the support line with strong bullish momentum could signal the beginning of a reversal move, targeting the resistance levels at 1.1530–1.1540.
My Scenario & Strategy
From my perspective, EURUSD sits at a pivotal technical point. If the Triangle Support Line continues to hold, I expect a bullish breakout attempt above the triangle’s resistance, confirming a possible trend reversal toward higher levels. Short-term traders could look for long entries near the 1.1500 support zone with tight stop-losses below 1.1480, aiming for a retest of 1.1530–1.1540. However, if the pair breaks and closes below 1.1480, it would invalidate the bullish scenario and likely trigger renewed selling pressure toward 1.1450–1.1400. For now, I remain cautiously bullish, expecting a potential rebound from the support base before a decisive move unfolds.
That's the setup I'm tracking. Thank you for your attention, and always manage your risk.

XAUUSD: Bulls Defend Channel Support, Eyeing $4,130 ReboundHello everyone, here is my breakdown of the current Gold setup.
Market Analysis
Gold (XAUUSD) continues to trade within a well-defined upward channel, showing a clear structure of higher highs and higher lows. After a series of breakouts and retests, the price recently tested the channel support and the key demand zone around $3,900–3,920, confirming buyers’ activity in that area.
Currently, previous fake breakout above the $4,130 resistance area led to a pullback, but the market is now stabilizing and showing early signs of bullish momentum. This zone aligns with both the lower boundary of the ascending channel and a horizontal support area — a technically strong confluence that often attracts long positions.
My Scenario & Strategy
The current setup suggests that as long as the $3,900 support holds, gold remains in a bullish structure. A confirmed bounce from the lower channel boundary would likely trigger a new impulsive move toward the $4,130 resistance zone, which is also the previous breakout area. If buyers manage to break and hold above that resistance, the next potential upside target is around $4,200–$4,250, aligning with the upper boundary of the channel.
My strategy here is to look for bullish confirmation signals (candlestick patterns or volume breakout) near the support zone and aim for long entries with targets toward $4,130 and higher. A daily close below $3,880 would invalidate this scenario and open the door for a deeper correction.
That's the setup I'm tracking. Thank you for your attention, and always manage your risk.

BTCUSD Rebounds from Support — Bulls Eye $106K Recovery MoveHello traders, I want to share with you my opinion about Bitcoin (BTCUSD). Bitcoin has been experiencing a prolonged corrective phase following a previous bullish rally. The market recently retested the Buyer Zone near $103,800–$104,200, where strong demand has once again emerged. This area has historically acted as a reliable support level, preventing deeper declines and triggering multiple rebounds. Currently, the structure is forming a descending wedge pattern, characterized by converging resistance and support lines. This technical formation often signals potential bullish reversals, especially when it appears near a key demand zone. The latest test of the lower wedge boundary coincided with the Support Level, resulting in a sharp reaction from buyers. From my perspective, as long as the price holds above the Buyer Zone, the probability of a bullish breakout increases. A confirmed breakout above the resistance line would likely validate a move toward the $106,000 TP1 level, which aligns with previous local highs and the upper boundary of the pattern. However, if BTC fails to break the resistance and falls back below $103,800, sellers could temporarily regain control, pushing the price lower before another accumulation phase develops. Overall, the current setup favors the bulls, with clear structural support and a tightening pattern suggesting that Bitcoin may soon attempt a rebound toward $106,000 and potentially higher levels. Please share this idea with your friends and click Boost 🚀

Euro continued Weakness Points to 1.1480 RetestHello traders, I’d like to share my view on EURUSD. The current market structure shows a clear bearish momentum, with the pair consistently forming lower highs and lower lows inside a well-defined descending channel. The rejection from the 1.1660 Resistance Zone — which coincides with a strong Seller Zone — marked the beginning of a sustained downtrend. After a fake breakout attempt above the resistance, the market quickly reversed and continued to decline, confirming that sellers remain in control. The pair is now trading close to the Buyer Zone, which aligns with the Support Level around 1.1500–1.1480. This area has historically acted as a key demand region, making it crucial for the next price reaction. At the moment, EURUSD is respecting both the Resistance Line and the Support Line within the channel, showing the continuation of the bearish cycle. My primary scenario anticipates a potential short-term pullback toward the upper boundary of the channel (around 1.1560–1.1580) before another bearish impulse develops toward TP1 at 1.1480. However, a confirmed breakout above 1.1600 could invalidate this bearish setup and open the way for a broader correction toward the 1.1660 Resistance Level. Until then, the trend remains bearish, and I favor short opportunities targeting 1.1480 as the next key level. Please share this idea with your friends and click Boost 🚀

Fundamental Market Analysis for November 5, 2025 EURUSDThe euro remains under pressure as the US dollar firms ahead of key US services activity indicators. Investors are weighing the mix of resilient consumer demand and signs of softer employment, which supports the dollar via firmer Treasury yields and demand for safe-haven assets. The upcoming release of the US services activity index and fresh private-sector employment data shapes expectations for the Federal Reserve’s rate path and, overall, keeps the bias in favor of the dollar.
In the euro area, the backdrop is subdued: business activity in manufacturing and services remains muted, while inflation expectations have been revised lower following the ECB’s latest easing of financing conditions. The combination of soft domestic momentum and limited progress in credit growth sustains caution toward the euro. Recent ECB communication emphasizes stabilizing growth over the risks of re-accelerating inflation, which also weighs on the currency.
An additional factor is a generally risk-averse tone: concerns around the US budget and headlines on government spending bolster demand for the dollar as a reserve asset. Against this backdrop, the near-term risk balance for EURUSD remains tilted lower; if US data stay firm, the pair risks holding around multi-month lows.
Trading recommendation: SELL 1.14950, SL 1.15250, TP 1.14450
