THE GOLDEN-PRINT STRATEGY XAUUSD continues to hold firmly above the major support zone around $4000.00. A confirmed break and close above the $4100.00 resistance could signal a potential continuation of bullish momentum.
With the upcoming G20 Summit, market volatility is expected to increase. Depending on the outcomes, this event could either strengthen or weaken the bullish outlook.
In addition, reports suggesting that D. Trump may not attend the summit in South Africa could weigh on USD sentiment. Weakening USD often supports upside moves in gold, which aligns with the bullish scenario if price breaks the $4100.00 zone.
Overall bias:
➡️ Bullish above $4000
➡️ Strong continuation expected above $4100
➡️ Fundamentals currently lean slightly in favor of gold
Analysis

XAUUSD: Bullish Rebound Setup as Price Holds Above Wedge SupportHello everyone, here is my breakdown of the current Gold setup.
Market Analysis
XAUUSD is currently maintaining a bullish market structure after rebounding from the key Wedge Support Line, which continues to act as a major dynamic support for the ongoing uptrend. The chart shows that Gold previously formed a broad Range at the top, followed by a sharp rejection from the Resistance Area near $4,170–$4,200, where strong sellers stepped in. This zone remains the primary supply region and aligns closely with the Wedge Resistance Line, creating a strong confluence barrier. After the rejection, price moved back into a correction phase, retesting both the Support Zone around $4,040–$4,070 and the ascending wedge structure. Notably, the recent bullish reaction inside this zone indicates that buyers are still defending this area effectively. Multiple breakouts and a prior fake breakout highlight that sellers are struggling to maintain downward momentum, while buyers continue to accumulate at lower levels.
Currently, XAUUSD is stabilizing just above the Support Zone, forming early signs of a potential upward continuation. As long as the price respects the wedge support and holds above $4,070, the bullish structure remains intact. The market behavior suggests increasing buyer interest, especially during retests of lower support.
My Scenario & Strategy
I expect Gold to continue its upward movement from the current support area and retest the $4,170–$4,200 Resistance Zone once again. This level will be the next major decision point; a successful breakout above this zone could open the path toward higher highs and potentially signal a continuation of the broader bullish trend.
However, if XAUUSD breaks below the Wedge Support Line, the bullish outlook would weaken, and the price could revisit deeper support levels before buyers attempt another recovery. For now, bullish continuation remains the most probable scenario as long as the support structure holds. Pullback-based long entries remain the best approach while price continues to trade above the key support zone and upward trendline.
That's the setup I'm tracking. Thank you for your attention, and always manage your risk.

BTCUSD Rebounds From Channel Support — Targeting $93K PullbackHello traders! Let’s break down the current BTCUSD market structure. Bitcoin continues to move within a well-defined descending channel, where price has repeatedly respected both the resistance and support lines. Every touch of the upper boundary resulted in a Turned Around reaction, confirming strong seller dominance throughout the downtrend. After breaking below a key local support, BTCUSD shifted into a deeper bearish phase and moved toward the broader Support Zone beneath $90,000. This level aligns with the lower boundary of the descending channel and has acted as a strong reaction area in previous price swings. Recently, price reached the channel’s support line, where buyers stepped in and formed an early rebound attempt. BTCUSD is now showing signs of a potential short-term correction, with price aiming toward the nearest resistance cluster at $93,000–$96,000, which also represents the mid-channel region and a key retest zone. As long as Bitcoin stays below the descending resistance line, the broader trend remains bearish. However, a corrective move toward TP1 near $93,000 is likely if the current support continues to hold. A rejection from the resistance area could send the price back toward the channel bottom for another test. A confirmed breakout above the descending resistance line would be the first signal of a potential shift in momentum and could open the way for a stronger recovery. Until then, BTCUSD remains in a bearish structure with a possible short-term bullish pullback. Please share this idea with your friends and click Boost 🚀

EURUSD Rejected From Resistance — Pullback Toward 1.1560 in PlayHello traders! Let’s analyze the current EURUSD market structure. EURUSD continues to move within a broad descending channel, where both the Resistance Line and the Support Line have been respected multiple times, confirming a well-defined bearish market structure. Throughout the past sessions, price formed several Range phases near key levels, followed by Breakouts that maintained the overall downward momentum. Recently, EURUSD approached the upper boundary of the channel and reacted strongly from the major Resistance Level near 1.16600, which overlaps with the Seller Zone. This area has triggered multiple Turned Around movements in the past, reinforcing its importance as a supply region where sellers consistently regain control. After rejecting this resistance, price started a downward move toward the mid-range structure. The pair is now approaching the Buyer Zone around 1.15500–1.15600, which aligns with both the local support area and previous Range accumulation. This zone has historically served as a strong reaction level, where short-term bullish corrections often began. As long as EURUSD remains below the descending channel’s resistance and fails to break above the Seller Zone, the bearish structure remains intact. A continuation toward TP1: 1.15600 is the most likely scenario in the short term, especially if sellers maintain momentum below the 1.16200 area. A clean break below the Buyer Zone could open the door for a deeper decline toward the Support Line at the bottom of the channel. On the other hand, a confirmed breakout above the 1.16600 Resistance Level would invalidate the current bearish view and potentially shift the trend toward recovery. Please share this idea with your friends and click Boost 🚀

GRAB 1D - picking phones off the market floor again?GRAB pulled back exactly into the 4.90–5.10 buy-zone, where the wedge retest aligns with the MA200 - a major technical cluster that previously launched strong impulses. Oscillators show deep oversold conditions, candles print buyer tails, and the first resistance sits at 5.35, matching the 0.618 retracement. A breakout above 5.35 opens the path toward 8.65 (1.618), and a move above 6.80 could initiate a larger rally toward 11.92 based on the 2.618 extension.
Company: Grab Holdings is Southeast Asia’s largest super-app platform, combining ride-hailing, food delivery, fintech, payments, and micro-lending across Singapore, Malaysia, Indonesia, Thailand, and Vietnam.
Fundamentally , as of November 19, GRAB continues to strengthen: gross profit and GMV grow, operational efficiency improves, and both ride-hailing and delivery segments have reached sustainable profitability. Fintech is expanding at double-digit rates, margins improve as subsidies are reduced, and operating losses continue to shrink. Cash flow strengthens, the path to full profitability is visible, and the overall digital-services boom across Southeast Asia remains a long-term driver for growth. Competition cooled, monetization improved - exactly то environment the company needed.
Technically , the bullish scenario holds as long as price stays above 4.90–5.10. A breakout above 5.35 activates the 8.65 target, and the major upside - 11.92 - becomes realistic once price gets above 6.80. A drop below 4.80 complicates the picture, but current structure still looks like a controlled reset rather than a trend break.
Grab acting like usual: discounts first, acceleration later - Southeast Asia likes this script.

NEO: the market wakes up and hints at a bullish reversalNeoGenomics is breaking out of a mid-term descending wedge while forming a clear trend reversal structure with higher lows and steady support above key Fibonacci retracement levels. The 10.00–10.80 area acts as a consolidation range before a potential continuation of the upward move.
The price has already broken the descending trendline, retested it, and is now holding above the 0.705 Fibonacci zone. EMA 20/50/100 are shifting toward a bullish alignment, confirming renewed buying pressure. Volume is increasing — a classic behavior after a prolonged decline. If the structure holds, the next bullish impulse may form right after breaking the 10.80 resistance.
Fundamentally, NeoGenomics is recovering after a sector-wide selloff in biotech. The company continues to strengthen revenue growth, improve its diagnostics portfolio, and reduce financial pressure — factors that often precede medium-term trend reversals in this sector.
Tactical plan: consider long positions after a confirmed breakout above 10.80. Targets: 15.00 (primary supply zone) and 19.20 as an extended target at the upper boundary of the previous long-term structure. Invalidation: breakdown below 9.00.
If the bullish impulse confirms, the move to 15 and beyond may unfold much faster than the market currently expects.

Fundamental Market Analysis for November 19, 2025 USDJPYEvent to watch today:
21:00 EET. USD - FOMC Meeting Minutes
USDJPY:
Risk-off conditions have revived interest in the yen: amid equity weakness and uncertainty around the timing of U.S. data releases, market participants are trimming dollar long positions versus JPY.
Japan-related signals add to the picture: the long end of the JGB curve is edging higher, bringing attention to inflation persistence and authorities’ readiness to react to excessive FX volatility. Cautious remarks from the finance ministry keep markets from setting fresh USD/JPY highs.
If headlines maintain a wary tone and expectations for a December Fed rate cut persist, the pair can retreat below 155 on safe-haven demand and the threat of verbal intervention.
Trade recommendation: SELL 155.500, SL 156.500, TP 154.500

GBP/CAD - Triangle Breakout (17.11.2025)🧠 Setup Overview
GBP/CAD has broken below a symmetrical triangle, signaling a potential bearish continuation after repeated rejections from the upper trendline. The pair is now trading under the breakout level, with sellers showing strong control. If bearish momentum continues, the next support zones become key targets.
📊 Trading Plan 🔻 Bearish Scenario (Primary Bias)
Look for a clean breakdown retest and rejection for confirmation
Bearish continuation expected toward the support areas below
🎯 Targets:
1st Support: 1.8335
2nd Support: 1.8287
⚡ Fundamental Outlook — Today (17 Nov 2025)
GBP Sentiment – The Pound remains under pressure as markets expect the Bank of England to stay cautious, given ongoing inflation uncertainty and slowing economic data.
CAD Sentiment – The Canadian dollar stays supported by stable Bank of Canada policy and improving expectations around the energy sector.
– Rising US bond yields indirectly support CAD’s strength through its correlation with risk-on flows.
➡️ Overall: Fundamentals align with the bearish bias on GBP/CAD.
#GBPCAD #Forex #TechnicalAnalysis #TriangleBreakout #PriceAction #CAD #GBP #ChartPatterns #ForexTrader #TradingView #KABHI_TA_TRADING #ChartsDontLieTradersDontQuit #BearishSetup #MarketOutlook #FXMarket
⚠️ Disclaimer
This analysis is for educational purposes only and not intended as financial advice.
Always wait for confirmation and follow your risk management rules.
💬 Support My Work ❤️
If this helped you:
👍 LIKE, 💬 COMMENT, and 🔔 FOLLOW
Your support encourages more clean chart breakdowns & daily setups!

Risk Management for Automated SystemsAutomation gives you speed, consistency, and emotionless execution, but it also has a dark side.
A bot can follow rules perfectly, but if the rules are risky, it will amplify the danger with mechanical precision.
That’s why risk management is the backbone of every successful automated strategy.
It doesn’t matter how good your code is — without proper risk control, even the smartest system can fail fast.
Below are five core pillars of risk management that every trader should build into their automation framework.
1. Know Your Maximum Drawdown
Every trading system, even the best one, goes through losing streaks.
What matters isn’t avoiding them, but controlling how deep they cut.
Setting a maximum drawdown limit defines the exact point where your bot pauses or shuts down.
Whether it’s 5%, 10%, or 20%, this boundary protects your capital and your mindset.
Why it matters:
Prevents “death spirals” during high volatility
Stops the system if market conditions change
Forces you to step back and evaluate logic
Protects the account from black swan trends
A bot that can’t stop itself, is a bot that will eventually blow up.
A bot that knows when to stop, survives.
2. Position Sizing Is Everything
You can have the best entry logic in the world, but if your position sizes are inconsistent or too large, the system becomes unstable.
Smart position sizing adapts to:
Account balance
Market volatility
Asset liquidity
A fixed-percentage model, such as risking 1–2% per trade, keeps performance steady even during rough periods.
It also allows your system to grow naturally without taking oversized risks.
Think of sizing as the volume knob of your bot — turn it too high, and you distort everything.
3. Avoid Correlated Exposure
Running several bots doesn’t automatically mean you are diversified.
Many traders make the mistake of running multiple strategies that all rely on the same market behavior.
For example:
Three momentum bots on BTC, ETH, and SOL are still highly correlated
Two trend systems may fail at the same time if the market suddenly ranges
Several “dip-buying” strategies will all get hit hard during a crash
True diversification means mixing:
Uncorrelated assets
Different signal types
Varying timeframes
Both trend and mean-reversion logic
The goal is for your bots to perform differently, not identically.
4. Review Your System’s Risk Profile
Markets change, and so should your risk model.
Volatility increases and decreases, spreads widen, volume dries up, and certain assets become more unpredictable.
Regular reviews ensure your system stays aligned with real conditions.
What to check:
Has drawdown increased over the last quarter?
Are trades becoming larger than planned due to volatility shifts?
Has your system entered a new market phase it wasn’t designed for?
Are win rates or profit factor weakening?
A quarterly or monthly audit reveals issues before they explode.
Risk management isn’t a one-time setup — it’s a continuous process.
A strategy tester can be very good tool to help you manage risk properly and evaluate risk.
Here is an example from one of our strategies.
5. Let Risk Management Be Automated Too
If your entries are automated but your risk controls aren’t, you’re only half-protected.
Risk management logic you can automate:
Stop-loss placement
Progressive stop tightening
Position scaling
Reducing size after a losing streak
Pausing after reaching a daily or weekly limit
Complete shutdown at max drawdown
This turns your bot into a self-regulating system that responds to both opportunity and danger.
The more risk rules you automate, the less emotional interference you’ll face — and the more consistent your results become.

BTCUSD Long: Short-Term Correction Eyes $97,500 ResistanceHello traders! BTCUSD continues to trade within a well-defined descending channel, maintaining a broader bearish structure while forming a series of lower highs and lower lows. Throughout the move, the price has created multiple pivot points along both the upper and lower channel boundaries, confirming the strength of this trend. Inside the channel, Bitcoin developed two notable range phases, each reflecting temporary consolidation before continuing downward. A key formation on the chart is the Rounding Top Pattern, which developed near the mid-channel area. This structure signaled weakening bullish pressure and preceded a sharp decline back toward the channel’s lower boundary. After the breakdown, BTC attempted a small recovery, but price failed at the Supply Zone, creating a rejection that aligned with a bearish breakout confirmation.
Currently, the price is approaching the $97,500 short-term target, which sits close to the lower edge of the Supply Zone. This level has acted as a significant reaction area several times, and the market may retest it before deciding the next direction. As long as BTC trades within the descending channel, the broader trend remains bearish, but short-term corrective moves to the upside are possible due to the strong reaction from demand.
My scenario as long as BTCUSD holds above the Demand Zone ($94,000–$94,500) and shows continued strength, a corrective move toward $97,500 remains likely. This level represents the nearest resistance and aligns with previous supply reactions. A clean breakout above $97,500 would open the way for a deeper correction toward the channel’s mid-line or even the upper boundary. However, if price gets rejected at the supply zone again, sellers may regain control and attempt another push back toward the demand area. A confirmed break below the Demand Zone would invalidate the bullish recovery setup and could trigger continuation of the broader downtrend. For now, the structure supports short-term bullish correction, but overall trend remains bearish until the descending channel is broken. Manage your risk!

BTCUSD: Buyers Aiming for a Move Toward 99,000 ResistanceHello everyone, here is my breakdown of the current Bitcoin setup.
Market Analysis
BTCUSD has recently completed a strong downward phase inside a well-defined Downward Channel, where price continuously formed lower highs and lower lows. After reaching the Support Zone around $94,500–$95,200, buyers stepped in and created a fake breakout, followed by a quick recovery — a sign of weakening seller pressure. Following this rebound, Bitcoin formed an Inverse Head and Shoulders pattern, confirming a potential bullish reversal. Price has now broken above the Triangle Resistance Line, signaling the first structural shift from bearish to bullish.
Currently, BTCUSD is consolidating just above the $95,500–$96,000 support zone, which now acts as a retest area for the breakout. As long as BTC stays above the Triangle Support Line, bullish momentum remains intact, and the market structure favors further upward movement. The nearest target for buyers is the $99,000 Resistance Zone, which previously acted as a strong supply area. A successful breakout above $99,000 would confirm bullish continuation and open the way toward higher resistance levels. If price fails to hold above support, a short-term pullback toward the lower triangle boundary may occur before buyers try to regain control.
My Scenario & Strategy
I expect BTCUSD to maintain its bullish bias as long as price trades above the Triangle Support Line and the key support zone. Potential long entries remain valid on retests of the $95,500–$96,000 area, with a primary target at the $99,000 Resistance Zone (TP1).
A confirmed breakout above $99,000 would strengthen bullish momentum and open the next leg upward. However, a breakdown below the triangle structure may lead to a deeper correction toward $94,500. For now, sentiment remains bullish, and Bitcoin appears ready for a continued recovery within the new reversal structure.
That's the setup I'm tracking. Thank you for your attention, and always manage your risk.

RESOLV Hello my friends 😍
Is the end of the bullish trend of the RESOLV cryptocurrency near? 🤔
The RESOLV cryptocurrency seems to have reached the end of the uptrend and should change direction soon
⚠️ The question is, should I enter a short position at this point?
💁♂️ Absolutely not!
🤔 When should we enter a trade?
💁♂️ When we see a logical structure with a trigger in this area
⚠️ If I don't see a structure and a trigger in this area, I won't enter a trade
The analysis targets will be the lower orange areas
⚠️The analysis may not reach the final target, so at each target, if you make a good profit and see signs of a trend change, you can exit the trade or manage your capital.
⚠️ None of the analysis is a recommendation to buy or sell, but simply my personal opinions on the charts. You can use the charts and choose any that interest you and take a position if you wish.
To support me, I would appreciate it if you boost the analysis and share it with your friends so that I can analyze it with more energy for you, my dears. Thank you all. ❤️

Fundamental Market Analysis for November 18, 2025 GBPUSDThe GBPUSD pair is holding near 1.31500–1.31600, as the dollar is supported by cautious market sentiment ahead of upcoming US data and by revised expectations for a Fed rate cut. Any strong figures on employment or inflation in the US strengthen the case for keeping rates high for longer and limit the upside potential for the pound.
On the UK side, pressure comes from weak growth and signs of a cooling labor market. Recent GDP figures confirmed only modest expansion, while labor market reports indicate slower job creation, which increases the likelihood of a Bank of England rate cut next year.
Additional pressure on the pound comes from the high sensitivity of households and businesses to borrowing costs and from uncertainty around fiscal policy. Against the backdrop of a strong dollar and growing expectations of a softer stance from the Bank of England, fundamental factors tilt the balance in favor of further GBPUSD downside, which supports short positions from around 1.31550 with a target near 1.30550.
Trading recommendation: SELL 1.31550, SL 1.32050, TP 1.30550

NZDUSD: Downtrend ConfluenceDaily TF Observations
Price is in a clean downtrend
H1 TF Observations
Price faked out of one ascending trend line (ATL)
However, price is making a clean break below the second ATL
EMA20 is also below EMA60

EUR/USD - Ascending Triangle (17.11.2025)🧠 Setup Overview TICKMILL:EURUSD
EUR/USD has formed an ascending triangle, but instead of breaking upward, price failed at the horizontal resistance and slipped below the rising trendline — signaling potential bearish reversal. The pair is rejecting the 1.1650–1.1660 supply zone, and downside momentum is building as fundamentals shift in favor of USD strength.
📊 Trading Plan🔻 Bearish Scenario (Primary Bias)
Look for trendline retest rejection for confirmation
Expect continuation to the downside toward key support zones
🎯 Targets:
1st Support: 1.1581
2nd Support: 1.1561
🔰 Resistance Zone: 1.1650 – 1.1660
⚡ Fundamental Updates (Today – 17 Nov 2025)
1️⃣ Fed officials remain cautious about easing policy due to persistent inflation risks.
• This reduces the chances of a near-term rate cut → USD strengthens.
2️⃣ U.S. government bond yields rise as investors move into safer assets during stock market weakness.
• Higher yields = stronger USD → bearish pressure on EUR/USD.
These fundamentals align with the technical breakdown, supporting further downside.
#EURUSD #Forex #TechnicalAnalysis #PriceAction #AscendingTriangle #BearishSetup #USD #EUR #FundamentalAnalysis #ForexSignals #TradingView #KABHI_TA_TRADING #ChartsDontLieTradersDontQuit #FXMarket #TrendlineBreak #SupplyZone
⚠️ Disclaimer
This is not financial advice.All content is for educational purposes only. Always confirm signals and apply strict risk management before entering trades.
💬 Support My Work ❤️
If this analysis helps you —
👍 Like 💬 Comment 🔔 Follow
Your support motivates me to post more daily setups & clean chart analysis!

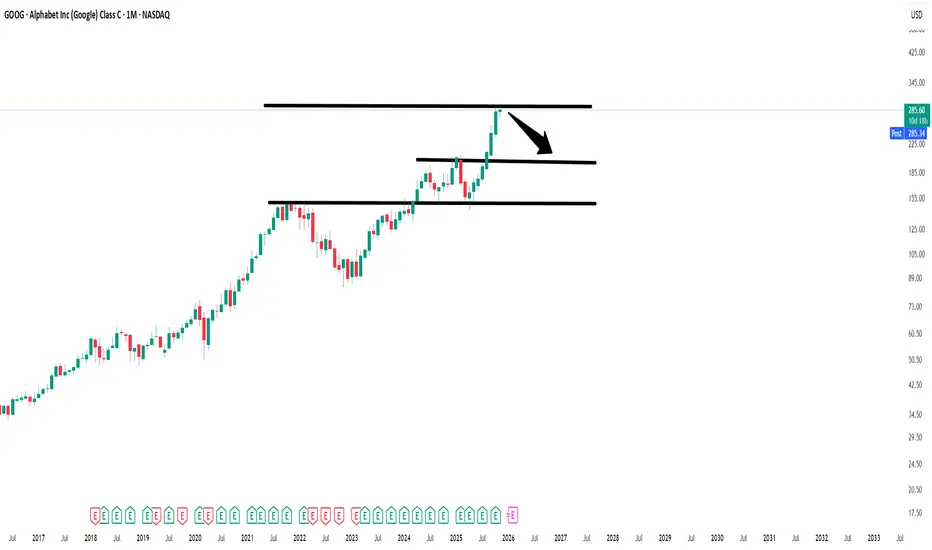
Even The Most Accomplished Make Mistakes $Goog [Berkshire]Berkshire Hathaway made an entrance into the Mag 7 (Excluding Apple) with its purchase of Alphabet / Google I believe that this was a mistake solely based on the fact that the majority of the tech industry is extremely overvalued. While Googles Valuation at least in my opinion is justified considering how strong Its business model is with its High Margin Reoccurring Subscription models (Google Cloud),(YouTube Premium),(Google Workshop),(Google Play) to name a few and how Dominate it is in Ads with YouTube / Chrome. It also Dominates Web Search let alone the majority of people saying they will "Google something" it sounds stupid but its a good mental metric on how people think of search. Google has built Search / web ecosystem to complement each other and force you to use there services in one way or another you are using there web ecosystem everyday from Google maps, to Google Docs or Gmail, they made you dependent on there services, Especially the younger generation (GenZ) is growing very dependent on Google Maps which may be free but shows you the grip they have on peoples web use. The Primary issue I have with Berkshire Hathaway entering at these prices is generally the markets are indiscriminate if the mag 7 or tech industry has a red day no matter how strong Google may be that will bring them down too.
-----------------------
My Personal Thesis on Google:
I am very bullish on several areas of Alphabet Including but not limited to Google Cloud, YouTube, Its subscription Services, Its high Margin software business model. Most Importantly to me is There Robotics Section Deepmind and Gemini Robotics. Robotics is underappreciated and my personal belief is that it is the Next AI like boom but we are very early to this. Robotics has use cases in every industry from Solving lack of labor issues and an aging workforce / population especially in western countries Robots can easily pick up this slack and they will greatly benefit from Artificial intelligence Google / Alphabet has the money and cashflow to heavily invest in this area maybe not creating the physical humanoid robots but they can definitely excel in the software section of it. Segments like Waymo are also interesting and bullish. Google is also massively profitable has very little debt, and an extremely solid balance sheet.
-----------------------
Risks:
I Believe the biggest Risk for Alphabet once again is that The American Tech Sector is extremely Overvalued, I Also See moderate amount of risk being that Google is such a monopoly that leaves it open for Antitrust Suits.
-----------------------
Business Model:
Google Is Vertically Integrated its Business was closely tied to the AI Boom being one of the Big 3 with its AI spending. People Disregard its extremely impressive moat it possesses having one of the strongest moats in tech let alone in the history of business.
-----------------------
Fundamentals:
Cash: US$98.50b
Debt: US$26.60b
Equity: US$386.87b
Total Liabilities: US$149.60b
Total assets: US$536.47b
Net Margins: 32.23%
-----------------------
Metrics:
Return On Equity: 32.1%
Return On Assets: 22.5%
Return On Capital Employed: 28.8%
-----------------------
Valuation:
Price to Sales: 8.9x
Price To Earnings: 27.7x
Price To Book: 8.9x
-----------------------
Disclaimer: I am not Initiating buy, Sell or Hold Opinions. I Only make these posts for Conversation. I am not a financial Expert or an Analyst.
EURUSD Long: Buyers Targeting a Move Toward 1.1670 ResistanceHello traders! EURUSD is maintaining a bullish structure after rebounding from the Demand Zone at 1.1600–1.1610, where buyers consistently stepped in to defend support. This area also aligns with the Demand Line of the ascending channel, making it a key decision point for the current uptrend. Earlier, the pair formed a Rounding Top near the 1.1650–1.1670 Supply Zone, which triggered a downside breakout and a short-term correction. Once price reached the pivot point around 1.1530, buyers regained control and initiated a steady recovery, forming a clean ascending channel.
Currently, EURUSD is approaching the Supply Zone at 1.1650–1.1670, which also aligns with the Supply Line of the channel — creating a strong confluence resistance area. A breakout above this zone would confirm bullish continuation toward the next major liquidity cluster. As long as the pair holds above the Demand Line, the bullish structure remains intact. A minor pullback toward the 1.1610–1.1620 Demand Zone would be considered a healthy correction within the trend.
My scenario as long as EURUSD stays above 1.1600–1.1610, buyers remain in control and the bullish channel is valid. The primary upside target is 1.1670, which serves as both a Supply Zone and a key structural resistance. A confirmed breakout above 1.1670 would signal continuation toward higher levels and mark a shift into a stronger bullish phase. If the pair rejects the Supply Zone, a pullback toward 1.1620–1.1600 is likely, where buyers may re-enter. A break below 1.1600 would weaken the bullish outlook and open the path toward deeper correction. For now, the market favors buying pullbacks while holding above demand. Manage your risk!

EURUSD: Breakout Structure Supports Move Toward 1.1650Hello everyone, here is my breakdown of the current Euro setup.
Market Analysis
EURUSD is showing a clear bullish shift after breaking out of multiple downward structures and reclaiming higher support levels. The chart highlights several key phases: a prolonged decline inside two consecutive Downward Channels, followed by confirmed breakouts, each signaling weakening bearish momentum. After the second downward channel breakout, EURUSD established a stable bullish structure, forming an ascending move supported by the Triangle Support Line. Price has been consistently creating higher lows along this line, indicating strong buyer presence.
Currently, EURUSD retraced back toward the Triangle Support Line after being rejected from the major Resistance Area around 1.16500. This zone has acted as a key supply region multiple times, and it also aligns with the Triangle Resistance Line, making it a significant confluence area. As long as price remains above the ascending support, the bullish structure stays intact. The overall market behavior shows healthy correction patterns followed by breakouts, suggesting that buyers remain in control, with momentum gradually building toward the upper resistance once again.
My Scenario & Strategy
I expect price to rebound from the current correction zone and attempt another move toward the 1.16500 Resistance, which is the next major decision point. A successful breakout above 1.16500, followed by consolidation, would signal a bullish expansion and could open the path toward higher targets in the coming sessions.
However, if EURUSD breaks below the Triangle Support Line, the current bullish structure would weaken, and price may return to lower support areas before buyers attempt another recovery. For now, structure remains bullish, and pullback-based long entries continue to offer the best opportunity while price respects the rising support trendline.
That's the setup I'm tracking. Thank you for your attention, and always manage your risk.

XAUUSD Buyers Step In — Market Aiming for $4,140 RetestHello traders! Let’s take a look at XAUUSD (Gold). XAUUSD maintains a bullish structure after bouncing from the key $4,050–$4,060 support zone, where price also retested the ascending trendline. After breaking out of the descending channel, Gold formed a new accumulation zone and moved higher, approaching the strong $4,140 resistance level. The price is now trading between the ascending support and the local supply zone near $4,140, forming a tightening structure. A breakout above this level could open the way for further upside, while a rejection may trigger a correction back toward $4,060. As long as XAUUSD holds above $4,060 and the ascending trendline, a renewed move toward $4,140 remains likely, with potential for a breakout. Please share this idea with your friends and click Boost 🚀

BTCUSD Rebounds From Buyer Zone — Correction Toward $101KHello traders! Let’s take a look at BTCUSD (Bitcoin). After an extended bearish phase inside a broad descending channel, price consistently respected both the resistance and support lines, forming a clear series of lower highs. Each touch of the descending resistance line resulted in a Turned Around reaction, confirming strong seller control throughout the structure. Earlier, Bitcoin broke below its local support area, initiating a deeper correction toward the major Support Level near $96,000. This zone aligns with the lower boundary of the descending channel and historically served as a strong reaction area for buyers. Recently, BTCUSD reached the bottom of the structure and is now showing early signs of a potential pullback. Price is attempting to rebound from the Buyer Zone, aiming toward the nearest resistance cluster around $100,800–$101,600, which also forms the lower boundary of the Seller Zone. This level previously acted as support and is now expected to serve as a strong retest area. As long as price remains below the descending resistance line, the overall trend stays bearish. A short-term bullish correction toward TP1: $101,600 remains possible, especially if buyers maintain control above the $96,000 support. However, if BTC fails to break above the Seller Zone, sellers may step in again, potentially pushing the price back toward the major support and even extending the downtrend. A confirmed breakout above the descending resistance would invalidate the bearish scenario and open the door for a stronger recovery. Please share this idea with your friends and click Boost 🚀

XAUUSD Long: Ascending Channel Targets Retest of $4,230 SupplyHello traders! XAUUSD has recently shown a clear bullish recovery structure after forming a strong base within the Demand Zone around $4,120–$4,130, where price previously reacted multiple times. This area also aligns with the lower boundary of the Ascending Channel, confirming it as a key decision point for buyers. Earlier, Gold formed a Double Top pattern near the $4,230–$4,240 zone, which acted as a pivotal Supply Area and triggered a sharp correction. Following that, the market produced two notable fake breakouts below support — liquidity sweeps that failed to establish a bearish continuation. Each failed breakdown was followed by strong buying pressure, signaling active demand.
Currently, after touching the Fibonacci Pivot Point, price reversed and re-entered the Ascending Channel, where bulls regained control. The current movement shows Gold pulling back from the Supply Line near $4,200–$4,230, suggesting that sellers are defending this zone, but the overall structure still favors buyers as long as the price remains above the channel support. At the moment, XAUUSD is approaching the confluence area between the Supply Zone ($4,200–$4,230) and the Supply Line, which represents a major reaction level. A clean breakout above this region would confirm bullish continuation, while a rejection could trigger another correction back toward the Demand Zone.
My scenario as XAUUSD holds above the $4,120–$4,130 Demand Zone, the bullish structure remains intact. The next upside objective sits around $4,200–$4,230, where both the Supply Line and key resistance meet. A successful breakout and close above $4,230 would confirm bullish continuation, opening the door for a move toward $4,260–$4,280 in the short term. However, if price rejects the supply area, a pullback toward $4,150–$4,130 is possible — an area where buyers may re-enter. A break below $4,120 would invalidate the bullish scenario and signal deeper correction toward $4,080–$4,060. For now, the structure favors buying pullbacks within the ascending channel, as long as price remains above key demand. Manage your risk!

XAUUSD: Bounce from Support Zone Targets $4,280 ResistanceHello everyone, here is my breakdown of the current Gold setup.
Market Analysis
Gold (XAUUSD) continues to maintain a bullish market structure after successfully recovering from the Support Zone near $4,090–$4,100, where buyers stepped in to defend a key demand area. Following a fake breakout to the downside in late October, price regained momentum and established a new Upward Channel, characterized by higher highs and higher lows — a strong sign of renewed buying pressure.
Currently, gold has already completed two major breakout phases, first reclaiming the support range and then extending toward the mid-channel zone. The current consolidation suggests a temporary pause before another impulsive leg upward. Price is now trading between the $4,190 support and the $4,350 resistance area, where previous reactions indicate strong liquidity. This resistance has acted as a cap for prior rallies, making it a crucial target zone for bulls. As long as the metal holds above the channel’s lower boundary, the short-term trend remains bullish. A minor pullback toward the support area could serve as a healthy correction before another rally unfolds. However, a confirmed break below $4,190 could temporarily weaken the bullish momentum and lead to a deeper retracement.
My Scenario & Strategy
I expect XAUUSD to maintain its bullish trajectory while respecting the ascending channel structure. Buyers may look for potential long setups near the $4,190–$4,200 support zone, targeting the $4,320–$4,350 resistance area (TP1). A breakout and close above $4,350 would open the path toward $4,400+ levels, confirming further continuation of the bullish cycle.
Conversely, a strong bearish break below the channel and support zone could signal a short-term correction toward $4,100 before buyers attempt to regain control. For now, sentiment remains optimistic, and gold continues to look poised for another bullish leg higher within its well-defined upward channel.
That's the setup I'm tracking. Thank you for your attention, and always manage your risk.

EURUSD Breaks Channel Resistance — Rally Toward 1.1660 in FocusHello traders! Let’s analyze the current EURUSD market structure. After an extended downtrend within a descending channel, the pair has recently shown the first signs of potential bullish reversal. Throughout the decline, price consistently respected the resistance line of the channel, making lower highs and lower lows. However, buyers have now stepped in strongly near the 1.1500–1.1530 Buyer Zone, which coincides with both the horizontal Support Level and the lower boundary of the previous structure — confirming it as a major demand area. Following a fake breakout below this support, EURUSD quickly recovered, forming a turnaround pattern and breaking above the descending resistance line. This move indicates that sellers are losing control while bullish momentum is gradually building. The pair has now established a short-term ascending structure, where price is developing higher highs and higher lows. Currently, EURUSD is retesting the breakout zone near 1.1580, which acts as dynamic support inside the new bullish channel. As long as the pair holds above this level, the outlook remains constructive, and buyers could push the price higher toward TP1 at 1.1660, which represents a key Resistance Level and former Seller Zone. A confirmed breakout above 1.1660 would reinforce the bullish bias and open the door toward the next resistance area near 1.1720. On the other hand, a rejection from this level might trigger a temporary pullback back to the 1.1580–1.1550 Buyer Zone before a new upward wave emerges. Overall, the structure has shifted from bearish to bullish, with the ascending Support Line now serving as a key level for maintaining the positive outlook. Please share this idea with your friends and click Boost 🚀
