EUR/AUD - Selling Pressure Below 1.7850 (22.09.2025)#EURAUD #Forex #Trading #TechnicalAnalysis
EUR/AUD – Channel Breakout Pattern (30M)
EUR/AUD has broken below the rising channel, confirming a bearish reversal after completing a Head & Shoulders pattern at the top.
🔹 Market Structure:
Clear rejection from the resistance zone (1.7850 – 1.7860)
Breakdown of the bullish channel support
Head & Shoulders formation adding to bearish momentum
🔹 Key Levels:
1st Support: 1.7715
2nd Support: 1.7710
📉 Trading Idea:
As long as EUR/AUD stays below the channel resistance, selling pressure could drive price toward the support levels.
🎁 Please hit the like button and
🎁 Leave a comment to support for My Post !
Your likes and comments are incredibly motivating and will encourage me to share more analysis with you.
Best Regards, KABHI_TA_TRADING
Thank you.
Analysis

EURUSD: wedge narrowing with downside targets in sightOn the daily chart, EURUSD has formed a rising wedge pattern, and the current price action indicates readiness for a decline. Attempts to hold above 1.1800 have failed, pressure has increased, and last week’s close can be viewed as a potential false breakout.
The first downside target is at 1.1413, where a strong support level lies. Further targets may shift to 1.0750 and 1.0480 levels that have accumulated significant volume over the past few months. A full breakdown of the wedge would give momentum to the bearish scenario and increase pressure on the euro.
From a fundamental perspective, the picture remains mixed: the 200 EMA capping from above and the sideways movement in the dollar index confirm the likelihood of euro weakness, but every pullback continues to be aggressively bought, preventing a collapse. If the dollar gains additional support from US macroeconomic data or Federal Reserve policy, the bearish scenario will become dominant.

Fundamental Market Analysis for September 22, 2025 GBPUSDThe latest public finance data showed that net borrowing by the public sector reached £18 billion, the highest monthly figure in five years. Economists had expected public borrowing to be significantly lower, at £12.8 billion. Analysts believe that this move threatens to exacerbate the debt burden and increase fiscal risks, which could put some pressure on the pound sterling.
On Thursday, the Bank of England voted to keep interest rates at 4.0% amid uncertain growth prospects and a weakening labor market. This decision was made after the UK central bank last cut its key interest rate by 25 basis points (bps) in August. The Bank of England reiterated that “a gradual and cautious further easing of monetary policy constraints remains appropriate.”
As for the US dollar, last week the US Federal Reserve (Fed) approved a widely expected rate cut and signaled that there would be two more cuts before the end of the year.
Traders will be focusing more on the Fed's statements later on Monday. Comments from Fed officials may provide some clues about the outlook for US interest rates.
Trading recommendation: SELL 1.3430, SL 1.3460, TP 1.3380

EURAUD: Counter-Trend TradeNot my conventional signal as this one is looking to trade in the opposite of the trend.
Daily Timeframe:
EMA20 is barely below EMA60 > downside momentum might pick up
Price is barely crossing below EMA20 > another indication of downside momentum
Price crossed below ATL, pulled back, and now seems to be continuing lower
H1 Timeframe:
Price crosses below ATL > first indication of uptrend failing to continue
Note that EMA20 is above EMA60 still > there is a risk that this will trap sellers

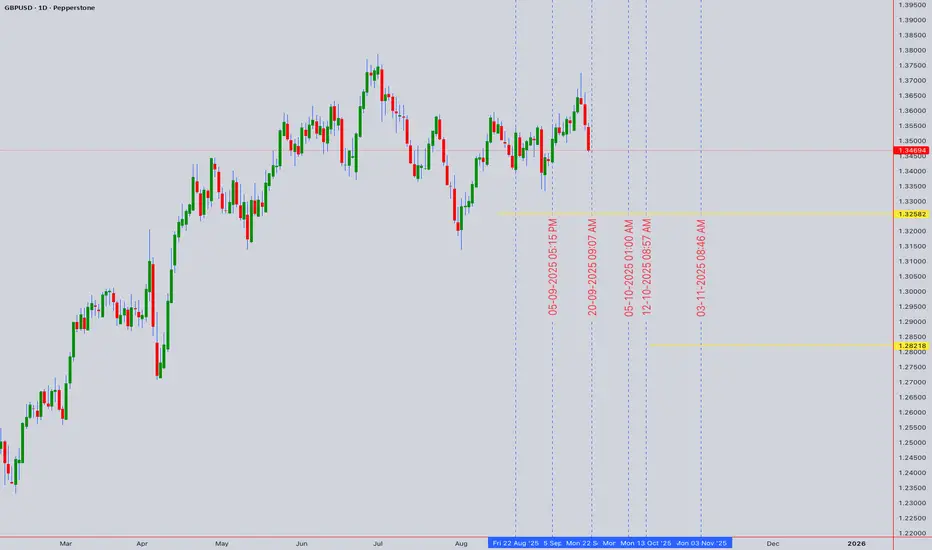
GBP Volatility & Momentum Study: Finding the Perfect Entry📊 GBPUSD Forecast | Intraday & Swing 📉📈
Asset: GBPUSD (CFD) Closing Price: 1.34694 (20th Sept 2025, 12:50 AM UTC+4)
🔎 Market Snapshot
Cable is trading around 1.3469, with mixed sentiment between dollar strength 🦅 and sterling resilience 💂♂️. Volatility is expected this week as traders eye macroeconomic updates & central bank cues.
🕯️ Chart Patterns & Signals
🟢 Bullish Hints: Possible inverse H&S on 4H + support at 1.3420.
🔴 Bearish Pressure: Lower-high structure intact since 1.3620 peak.
⚡ Trap Risk: Watch for a bull trap near 1.3520 resistance.
📐 Harmonic AB=CD projection aligns with 1.3400 zone (support).
📈 Indicators Check
RSI (H4): Neutral → 48 (room for breakout).
BB: Price squeezed ⚠️ → volatility incoming.
MA Cross: 20 EMA < 50 EMA (short-term bearish bias).
VWAP: Anchored VWAP from September high sits at 1.3500.
⏱️ Intraday Strategy
Buy Zone: 1.3420–1.3440 (support test, scalps).
Sell Zone: 1.3520–1.3550 (resistance rejection).
🎯 Targets:
Upside: 1.3490 / 1.3520 / 1.3565
Downside: 1.3400 / 1.3360 / 1.3325
🛡️ Stops:
Longs below 1.3390
Shorts above 1.3575
📆 Swing Outlook (Days–Weeks)
Trend: Bearish bias unless daily closes above 1.3565.
📉 Swing Sell Setup:
Entry: 1.3520–1.3550
TP: 1.3400 → 1.3325
SL: 1.3590
📈 Swing Buy Setup (Aggressive):
Entry: 1.3360–1.3400
TP: 1.3490 → 1.3560
SL: 1.3320
🎯 Key Levels to Watch
Resistance: 1.3520 / 1.3565 / 1.3620
Support: 1.3420 / 1.3360 / 1.3325
🧭 Final Take
⚖️ GBPUSD is at a decision point:
Intraday → play the range 1.3420–1.3520
Swing → favor shorts below 1.3565, longs only on deep pullbacks near 1.3360.
Trade safe & adapt to volatility! 🚀📉
For individuals seeking to enhance their trading abilities based on the analyses provided, I recommend exploring the mentoring program offered by Shunya Trade. (Website: shunya dot trade)
I would appreciate your feedback on this analysis, as it will serve as a valuable resource for future endeavors.
Sincerely,
Shunya.Trade
Website: shunya dot trade
📝 TRADING CHECKLIST
Before entering any position:
- ✅ Confirm volume supports move
- ✅ Check RSI for divergences
- ✅ Verify multiple timeframe alignment
- ✅ Set stop loss before entry
- ✅ Calculate position size
- ✅ Review correlation with DXY
- ✅ Check economic calendar
- ✅ Assess market sentiment
⚠️Disclaimer: This post is intended solely for educational purposes and does not constitute investment advice, financial advice, or trading recommendations. The views expressed herein are derived from technical analysis and are shared for informational purposes only. The stock market inherently carries risks, including the potential for capital loss. Therefore, readers are strongly advised to exercise prudent judgment before making any investment decisions. We assume no liability for any actions taken based on this content. For personalized guidance, it is recommended to consult a certified financial advisor.
Unlocking EUR's Value: A Data-Driven Analysis of Macro Factors📊 EURUSD Technical Forecast | Intraday & Swing Outlook 🚀💶💵
Asset Class: EURUSD (CFD) Closing Price: 1.17432 (20th Sept 2025, 12:50 AM UTC+4)
🔎 Technical Overview
Trend Context: EURUSD has been consolidating near 1.1740, with mixed signals across short- and mid-term charts.
Momentum Check: RSI (H1/H4) → Neutral, close to 50 ⚖️
Volatility: Bollinger Bands tightening → Expect breakout soon 💥
Volume Flow: Anchored VWAP → Buyers defending 1.1720 📈
🕵️ Chart Patterns & Theories
Elliott Wave: Wave 4 correction nearing completion – possible Wave 5 uptrend. 🌊
Wyckoff: Signs of re-accumulation in H4 range. 📦
Ichimoku: Price hovering near cloud → watch for bullish breakout ☁️
Gann Levels: Key resistance around 1.1785, support at 1.1700 ⏳
H&S Watch: No clear head & shoulders yet, but traps possible around 1.1760/1.1720 ⚠️
📈 Intraday Levels (Next 24–48H)
🔹 Buy Zone: 1.1710 – 1.1730 (tight stop below 1.1690)
🎯 Targets: 1.1760 → 1.1785
🔻 Sell Zone: 1.1785 – 1.1805 (stop above 1.1825)
🎯 Targets: 1.1745 → 1.1720
📊 Swing Trading Outlook (Weekly)
Bullish Scenario: Sustained break above 1.1805 → eyeing 1.1880 – 1.1925 🌟
Bearish Scenario: Breakdown below 1.1690 → drop toward 1.1625 – 1.1580 🕳️
⚖️ Strategy Recap
Intraday: Range trading between 1.1720 – 1.1785 🎯
Swing: Watch breakout levels for trend confirmation 🚀 or ❌
🌍 Market Context
Geopolitics & ECB vs Fed divergence → driving sentiment.
Dollar Index (DXY) consolidation near highs → closely linked.
📌 Key Takeaways
✅ Buy dips near 1.1710–30, target 1.1760–85.
✅ Sell rallies near 1.1785–1.1805, target 1.1720.
⚠️ Major breakout zones: Above 1.1805 = bullish 🚀 | Below 1.1690 = bearish ⛔
For individuals seeking to enhance their trading abilities based on the analyses provided, I recommend exploring the mentoring program offered by Shunya Trade. (Website: shunya dot trade)
I would appreciate your feedback on this analysis, as it will serve as a valuable resource for future endeavors.
Sincerely,
Shunya.Trade
Website: shunya dot trade
📝 TRADING CHECKLIST
Before entering any position:
- ✅ Confirm volume supports move
- ✅ Check RSI for divergences
- ✅ Verify multiple timeframe alignment
- ✅ Set stop loss before entry
- ✅ Calculate position size
- ✅ Review correlation with DXY
- ✅ Check economic calendar
- ✅ Assess market sentiment
⚠️Disclaimer: This post is intended solely for educational purposes and does not constitute investment advice, financial advice, or trading recommendations. The views expressed herein are derived from technical analysis and are shared for informational purposes only. The stock market inherently carries risks, including the potential for capital loss. Therefore, readers are strongly advised to exercise prudent judgment before making any investment decisions. We assume no liability for any actions taken based on this content. For personalized guidance, it is recommended to consult a certified financial advisor.

Gold Forecast: Liquidity Zones Mapped | Bullish or Bearish ReverGoldRush_Traders institutional forecast.
Price closed at 3684.975, compressing under ATH (3707).
Stacked supply zones remain valid between 3707 and 3686 — each serving a different purpose: sweep trap, blow-off top risk, and rejection base.
🔺**Bullish Path:**
• Hold 3665–3672 or sweep 3638
• Break above 3695 → 3707
• Clean ATH break = 3720–3732 possible
🔻 **Bearish Path:**
• Fail at 3686–3700 zone
• Drop to 3665 → 3638
• Break of 3628 = opens flush to 3605 or 3582
⚠️ Zones are stacked with no gaps — each has distinct algorithmic purpose.
This is a **provisional forecast** pending any weekend news shifts.
🔱 Liquidity-based | ICT/SMC inspired

Gold can continue its bullish trend after small correctionHello traders, I want share with you my opinion about Gold. The market context for Gold has been firmly bullish since the price broke out of its prior consolidation range, a move that originated from the deep 3270 - 3290 buyer zone. This breakout shifted the market structure, initiating a new impulsive phase that has since been guided by a major ascending mirror line. The price action for XAU has been respecting this dynamic support, creating a clear sequence of higher highs and higher lows. Currently, after reaching a new local high, the asset is undergoing a healthy corrective phase. This pullback is guiding the price back towards a critical confluence of support, defined by the 3622 - 3598 support zone and the ascending mirror line itself. The primary working hypothesis is a long, trend-continuation scenario, which anticipates that buyers will step in to defend this key support cluster. A confirmed bounce from this area would signal the conclusion of the corrective move and the resumption of the dominant upward trend. This would likely initiate the next impulsive wave higher. Therefore, the TP is logically placed at 3720, representing a new potential structural high. Please share this idea with your friends and click Boost 🚀
Disclaimer: As part of ThinkMarkets’ Influencer Program, I am sponsored to share and publish their charts in my analysis.

Gold Forecast (XAUUSD)🟡 GOLD – 1H Breakdown
Alright traders, here’s the scoop 👀
We’re chopping around mid-range after that last BOS. Liquidity is literally everywhere — BSLs chilling above the highs, SSLs hiding under the lows. Market’s teasing both sides like it’s fishing for stops 🎣.
🔑 Levels to Watch:
Buy Zone 1 (Preferred snack stop): 3,600 – 3,620 🍫
Buy Zone 2 (Deeper dip special): 3,560 – 3,580 🥤
Trendline liquidity just waiting to get grabbed… you know how it goes 😏
Upside target: 3,700+ — where the big liquidity bags are stacked 🎯
🛠 Possible Plays:
Quick liquidity sweep under the lows → tap into Buy Zone 1 or 2 → rocket launch 🚀
If demand fails, we’re diving into the swing range 3,530 – 3,550 for a bigger reload.
🔍 Outlook
Short-term: Expect a cheeky stop-hunt under the lows.
Mid-term: Bulls still in control, eyes on that juicy 3,700+ grab.
Bias : Liquidity sweep down → Buy for continuation 📈✨

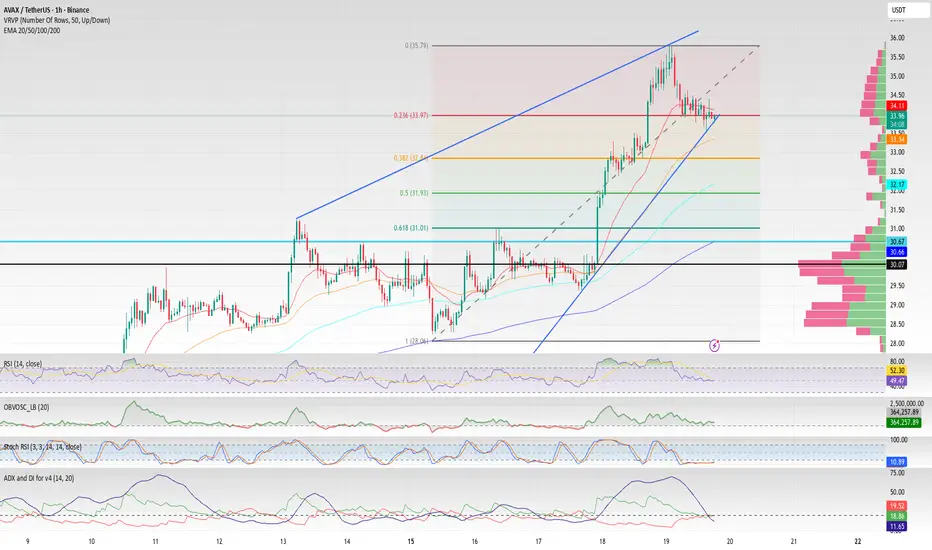
AXS: Coiling Up for a Shakeout?AXS is stuck between floors and ceilings, grinding inside a tight rising wedge. While the macro picture looks juicy with the Fed turning on the liquidity taps, the on-chain data for AXS is telling a different story. We're seeing a classic setup where the chart looks bullish from afar, but the internals are weak.
Our game plan is to watch for a breakdown. The bulls' line of defense is the wedge support around $33.50. A clean break below that level opens the door to our primary target zone, a liquidity magnet around $31.90-$30.50. This area is a major support cluster and a logical place for a healthy reset before the next leg. Heavy resistance sits at the recent high of $35.76.
Patience is key here; we're waiting for the market to show its hand while the crowd gets chopped up. Don't be the exit liquidity for underwater holders looking to break even on this bounce. Smart money waits for confirmation.
Quick update on gold since Wednesday!price is still bullish for and market structure still hold at the extreme point of the move, and currently gold is showing nice bullish signals.. so pay attention after this 1hr closes like this!
patience and letting the market play out as its trying to no reason to force price until it give you clear reason as what the intention it's trying to do..
with that been said we be back in few hours or days, please subscribe to my youtube where am super active with this analysis.. and comment whoop if you wanna join my circle..

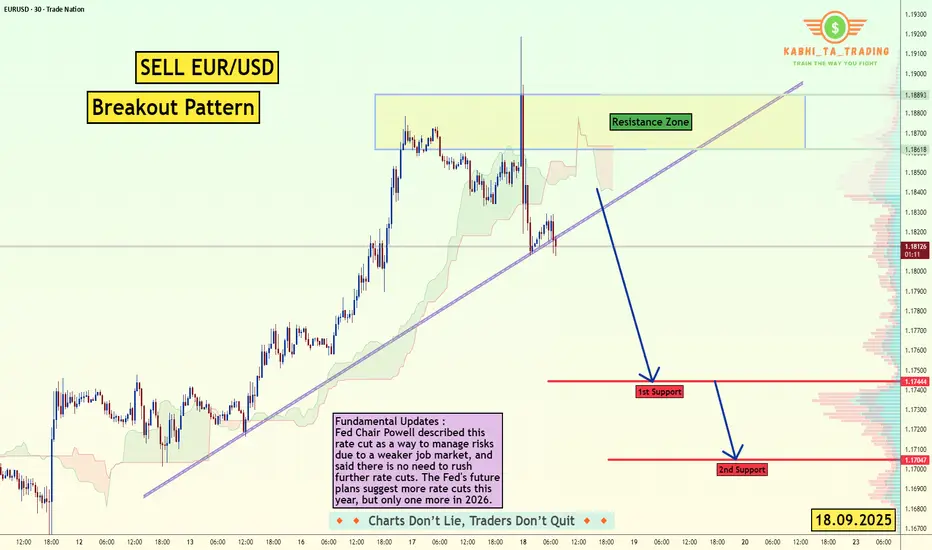
EUR/USD - Fundamental Move (18.09.2025)The EUR/USD Pair on the M30 timeframe presents a Potential Selling Opportunity due to a recent Formation of a Breakout Pattern.
This suggests a shift in momentum towards the downside in the coming hours.
Possible Short Trade:
Entry: Consider Entering A Short Position around Trendline Of The Pattern.
Target Levels:
1st Support – 1.1744
2nd Support – 1.1704
Fundamental Updates :
Fed Chair Powell described this rate cut as a way to manage risks due to a weaker job market, and said there is no need to rush further rate cuts. The Fed's future plans suggest more rate cuts this year, but only one more in 2026.
🎁 Please hit the like button and
🎁 Leave a comment to support for My Post !
Your likes and comments are incredibly motivating and will encourage me to share more analysis with you.
Best Regards, KABHI_TA_TRADING
Thank you.
USD/CHF - Trade Setup 🕰 1H Structure
Price has shifted bullish after a BOS and liquidity sweep. We’ve tapped into discount levels near the 71% retracement and held demand.
📊 Technical Breakdown
MSS → BOS confirmed bullish intent.
Demand zone sits at 0.7880 – 0.7900.
Price cleared SSL liquidity and is now seeking upside inefficiency.
Next magnet = 0.8000 – 0.8030 swing range.
🎯 Entry / Exit Zones
Entry: Wait for a pullback into the 0.7880 – 0.7900 demand zone.
Target 1: 0.7950 (intra-range).
Target 2: 0.8000 – 0.8030 (swing range high).
Invalidation : Break below 0.7860.
⚖️ Outlook
Short-term pullback into demand → continuation bullish towards 0.8000+.
Bias : 📈 Bullish continuation after retrace.

$SOLANA 250+ or bearish trend to 225/200With the recent solana pump, major profits have been taking place.
However, SOL stopped out at 249. Just under the Psychological level of 250.
On this chart we can see the following:
- Supply & Demand
- Anchored Volume
- Pattern: BF / BC /SR
- Two 4 hour FVG's below price, with HTF GP on the second FVG.
- One swing high & swing low
- OBV tool in place forming a bearish channel
- Psychological levels of 250, 225, 200
With these in place, we can see solana is looking pretty bearish now.
What comes up, must come down.
Solana is making a retest on the demand zone, which is also the resistance and golden pocket.
If price wicks and successfully rejects. We will definitely see 225.
A long with the Volume Anchor acting as a magnet for price to come back down as there has not yet been a retest.
But if it closes above the resistance, there is a greater chance of it breaking above the demand zone.
We will begin looking for shorting opportunities once solana fails to break above.
We will begin looking for long opportunities if solana succeeds in it's break above.
Right now, keep your eyes peeled.
We have movement incoming.

Fundamental Market Analysis for September 19, 2025 EURUSDThe US Department of Labor (DOL) reported on Thursday that the number of Americans filing new claims for unemployment benefits fell to 231,000 for the week ending September 13. The latest data was lower than the initial estimate of 240,000 and lower than the previous week's figure of 264,000 (revised from 263,000). Meanwhile, the number of people continuing to claim unemployment benefits fell by 7,000 to 1.920 million for the week ending September 6.
The US dollar remains strong after the Federal Reserve (Fed) announced an expected rate cut on Wednesday but did not indicate that it would rush to lower borrowing costs in the coming months.
The decline in the EUR/USD pair may be limited as the euro (EUR) could be supported by growing expectations that the European Central Bank (ECB) will end its cycle of rate cuts after the release of the latest inflation data.
ECB Vice President Luis de Guindos said the central bank should take a “very cautious” approach given the high uncertainty. Guindos added that the current rate is adequate given inflation trends and monetary policy transmission.
Trade recommendation: SELL 1.1735, SL 1.1765, TP 1.1685

XAUUSD 30M – Intraday Plan Around the RangePrice is consolidating between $3,660.93 (resistance / buy trigger) and $3,626.93 (support / sell trigger). Current price is near $3,648, sitting mid-range. Breakout confirmation is key.
🔼 Bullish Plan (needs confirmation)
Trigger: 30-min body close above $3,660.93.
Targets: $3,662.79 → $3,665.17 → $3,669.30.
Management: Take partials at the first target, move SL to breakeven once $3,661 is cleared, trail remainder if momentum continues.
🔽 Bearish Plan (clean if floor breaks)
Trigger: 30-min body close below $3,626.93.
Targets: $3,621.49 → $3,619.00 → $3,616.88.
Management: Scale partials at the first target, protect remaining position at breakeven. Trail if selling momentum builds.
🔄 Range Scalp (higher risk — small size)
Shorts: rejection near $3,659–$3,660, target $3,648–$3,650, SL above rejection high.
Longs: bounce near $3,627–$3,628, target mid-range (~$3,640–$3,645), SL under wick low.
✅ Break Confirmation
Strong 30-min body close beyond the trigger.
Expansion candles with follow-through.
❌ Invalidation
Breakout closes back inside the box on the next bar.
Multiple wicks through levels without momentum.
📌 Bottom Line
Above $3,660.93 → bullish bias toward $3,662.79 → $3,665.17 → $3,669.30.
Below $3,626.93 → bearish bias toward $3,621.49 → $3,619.00 → $3,616.88.
Inside range = scalp only, keep risk tight.

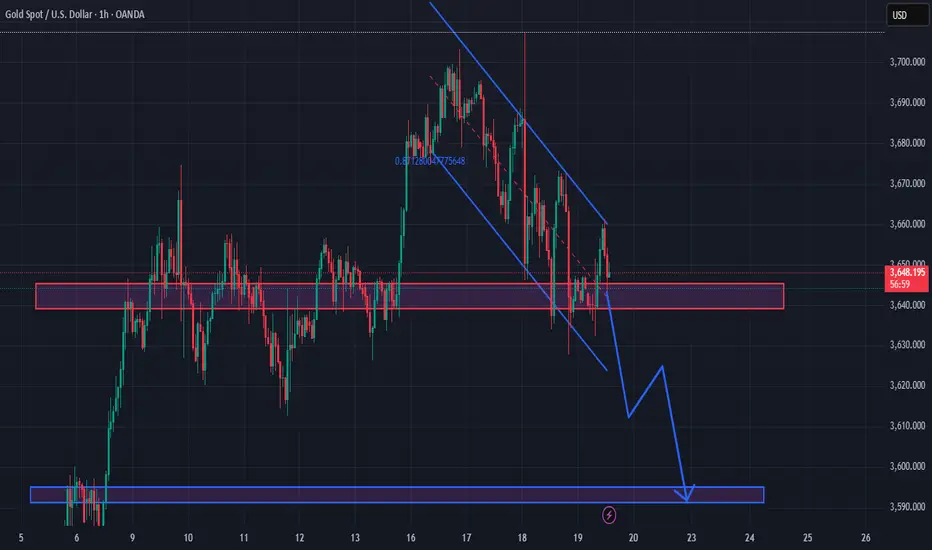
Take-profit near 3,610 first, and extended target around 3,590.1. Current Trend
Price is moving inside a down channel, marked by the two blue trendlines.
Each time price touches the upper edge of the channel, it gets rejected and turns lower, showing sellers are in control.
Key resistance zone: around 3,645 – 3,655 (red box), which has been tested multiple times but failed to hold.
2. Key Levels
Short-term resistance: 3,650 – 3,655. Unless a breakout occurs, the bearish momentum remains dominant.
Support target: 3,590 – 3,600 (blue box below). This is a previous low and a strong demand zone.
3. Price Scenarios
Main scenario (preferred): Price continues moving inside the down channel → breaks below 3,640 → gradually drops toward 3,600 – 3,590.
Alternative scenario: If there’s a strong breakout above 3,655 with a solid H1 close, the short-term trend may reverse upward, targeting 3,670 – 3,680.
4. Trading View
With the current trend: bias remains Sell within the down channel, with stop-loss above 3,660.
Take-profit near 3,610 first, and extended target around 3,590.
EUR/USD 4H Trade Setup🔎 Bias
Mid-term bullish continuation after corrective pullback into demand.
📊 Technical Breakdown
Weekly/Daily: Structure remains bullish after breaking out of consolidation.
4H : Clear impulsive leg (i-ii-iii) with current correction into the 71% fib retracement.
Demand zone: 1.1730 – 1.1770 aligns with BOS retest + liquidity sweep.
Confluence : Trendline support + untested 4H demand.
🎯 Entry / Exit
Entry zone : 1.1740 – 1.1770 demand
Targets:
TP1: 1.1860
TP2: 1.1960
TP3 (extended): 1.2050+ (wave (v) projection)
Invalidation : Below 1.1685
⚖️ Risk Management
Risk only 1–2% per trade.
Stop loss tucked under 1.1685 demand break.
📌 Outlook
Expecting a corrective dip into demand before continuation higher. If demand holds → strong bullish wave (v) towards 1.20+.
Bias: Pullback → Mid-term bullish 🚀

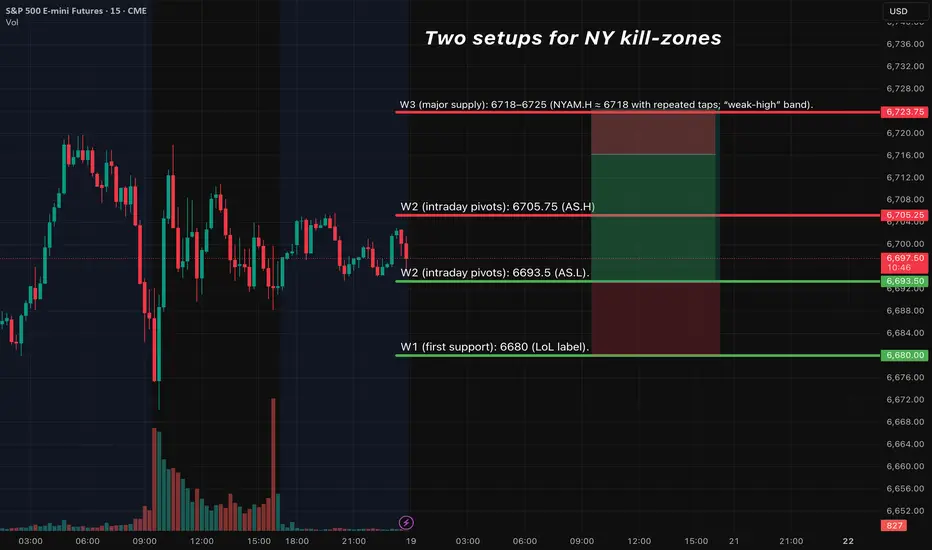
ES (SPX) Analyses - Key Levels - Setups - Fri, Sep 19Bias:
After the recent FOMC meeting, where they cut rates by 25 basis points on September 18, the E-mini S&P 500 futures are looking a bit bullish. There’s decent support holding up, but expect some bumpy trading around those all-time highs. We might see the market bouncing between the usual value areas, with traders likely to fade the extremes unless there’s a strong breakout.
Momentum could slow down as we get close to overbought levels, which might lead to some profit-taking on any rallies. On the flip side, expect strong buying when prices dip. For now, the trading range looks to be between 6660 and 6710, with swings of about 20 to 30 points likely in quieter trading conditions.
Friday has no major U.S. data on the weekly calendar wrap; Thursday’s LEI fell −0.5% m/m in Aug (already out), so macro tape-bombs are limited.
Quadruple-witching: 09/19/2025 is the quarterly expiration (third Friday of Sep). Also note ESU25 last trade = Sep 19, even though most trading has rolled to ESZ25. Expect flowy opens/closes and possible “pin” behavior. 
Options positioning (ES):
• Report totals: 5.83M total OI; put/call = 3.51. 
• Friday weeklies: 2.676M OI; P/C = 5.09 (put-heavy into expiry). 
• Sep contract (ESU5, 2 DTE): ~1.07M total OI; P/C = 3.01; ~185k volume in the latest report. 
• Vol: 30-day ATM IV ≈ 12.33% (down slightly d/d). 
• 0DTE share in SPX options has been >60% of volume recently — expect same-day gamma flows to matter on a quad-witch Friday. 
Bottom line: This is a put-heavy, expiry-dense tape with subdued vol. Expect pinning/reversion around big strikes and flowy opens/closes rather than a trend day—unless price cleanly accepts outside the range.
Next known catalysts (not tomorrow but near-term): Flash PMIs Mon 9/22; U. Michigan final sentiment Fri 9/26.
Setup 1 — Tier-2 (A+ Bounce) LONG @ 6680–6695
Trigger: sweep 6680–6690 → 15m close back above 6693.5 (AS.L) → 5m re-close + HL → 1m pullback hold.
Entry: 6694–6697.
SL: below the 15m sweep low −0.5 pt (hard).
TP1: 6705–6707 (AS.H). TP2: 6718–6725 (W3).
Management: at TP1 close 70%, move runner to BE; aim TP2; time-stop 45–60m if neither TP1/SL hits; max 2 attempts/level.
Setup 2 — Tier-1 (A++ Rejection-Fade) SHORT @ 6718–6725
Trigger: quick sweep above 6718–25 → 15m body back inside 6710 → 5m LH + re-close → 1m failure retest.
Entry: 6714–6718 on the re-close.
SL: above sweep high +0.5 pt.
TP1: 6705–6707; TP2: 6693–6695; stretch 6685–6680 only if momentum continues.
Management: same as above.
SPY options overlay (execution notes)
Given quarterly expiration and heavy 0DTE participation, prefer same-day SPY (AM window) with Δ≈0.60–0.70 on entries; consider 1-DTE for PM window to temper decay. (0DTE share data from Cboe.)
EUR Futures analysis I am looking for to continuing compression at EUR futures (EurUsd) chart
According to Engulf of the lower flag limit; i am waiting for continue drop.
This analysis could mean that US inflation could spike again on Thursday's news.
We'll just have to wait and see.

XAUUSD GOLD RESISTANCE AND SUPPORT READ CAPTIONGold is currently holding above the support levels 3640 – 3655. As long as these zones are respected, the market may attempt a bullish move toward the resistance 3695. A successful breakout above this resistance can open the way toward the supply zone 3710. On the other hand, if support breaks, market may show further downside pressure
Support zone: 3655_3640
Resistance zone: 3695
Supply 3710
will gold respect support or break lower?
For more chart updates, you can follow my TradingView profile.

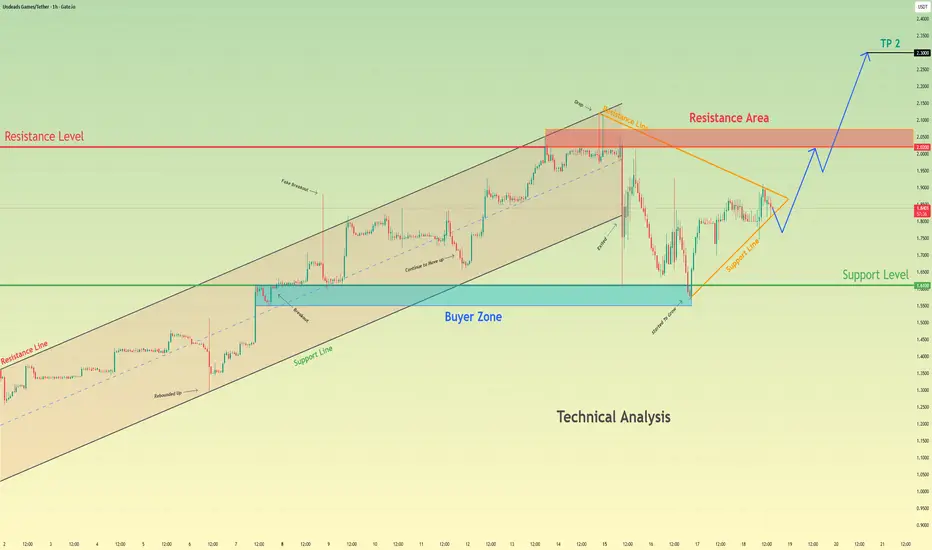
Undeads Games may Be Preparing for its Next Major Move UpHello traders, I want share with you my opinion about Undeads Games. The market for Undeads Games has transitioned from a strong impulsive uptrend into a prolonged corrective phase, setting the stage for its next potential major move. After a rally within an upward channel peaked near the 2.0200 Resistance Level, the price entered a lengthy consolidation, forming a large pennant pattern. This correction guided the price of UDSUSDT back down to the key 1.6100 buyer zone, where it found significant support. Currently, the asset is at a critical inflection point, with the price coiling tightly at the apex of this pennant, signaling that a high-volatility breakout is imminent. The primary working hypothesis is a long scenario, which anticipates a bullish resolution to this consolidation. The expectation is that the price will break out from the top of the pennant and rally towards the major Resistance zone at 2.0200, which serves as TP 1. Following the achievement of this first target, a healthy correction or retest of the broken resistance is anticipated. A successful hold of this level as new support would then provide the foundation for the next impulsive wave higher, with a secondary objective set at TP 2 at the 2.3000 level. Please share this idea with your friends and click Boost 🚀
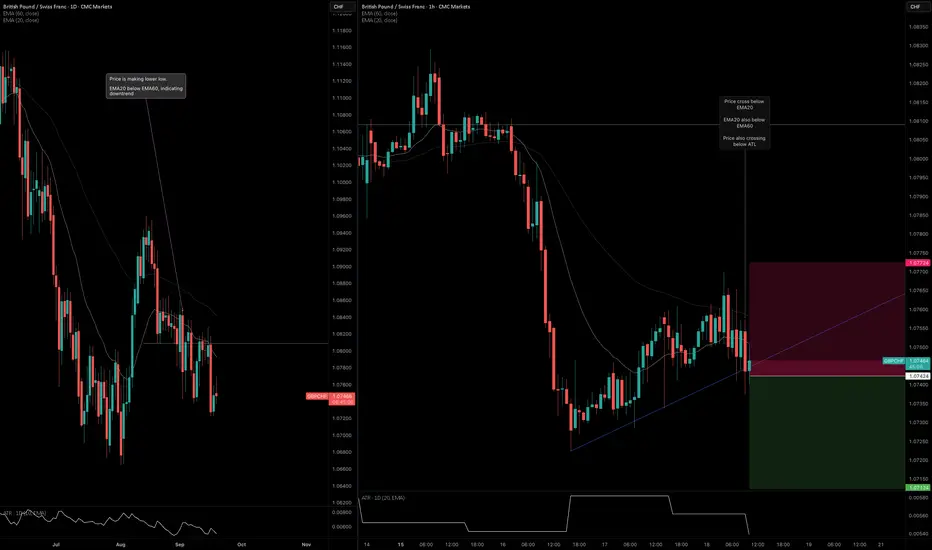
GBPCHF: ATL BreakoutI noticed confluence over on the GBPCHF pair. Here's the breakdown on the daily and H1 timeframes.
Daily Timeframe:
EMA20 is below EMA60 > downtrend structure
Price is also bouncing below EMA20 > confirms downtrend
Price also holding below HTL based on previous end at bearish candle
H1 Timeframe:
Price is exiting the EMA band > momentum has high potential to accelerate lower
EMA20 is below EMA60 and expanding > confluence that momentum is accelerating