USD/CAD - Bearish Flag (15.09.2025)The USD/CAD Pair on the M30 timeframe presents a Potential Selling Opportunity due to a recent Formation of a Bearish Flag Pattern. TRADENATION:USDCAD
This suggests a shift in momentum towards the downside in the coming hours.
Possible Short Trade:
Entry: Consider Entering A Short Position around Trendline Of The Pattern.
Target Levels:
1st Support – 1.3814
2nd Support – 1.3796
🎁 Please hit the like button and
🎁 Leave a comment to support for My Post !
Your likes and comments are incredibly motivating and will encourage me to share more analysis with you.
Best Regards, KABHI_TA_TRADING
Thank you.
Analysis

CADCHF: Trend ContinuationCADCHF continues to remain bearish as it holds below the key level on the daily timeframe. Here's a summary of my key observations over on the daily and intraday timeframes.
Daily Timeframe:
Price broke the key support level in early September
After some sideways price action, price is currently making a bearish bar that engulfs the prior day's doji
H1 Timeframe:
Price broke through the ATL, which shows confluence with the downtrend
EMA20 is also below EMA60, moving further apart to signal momentum is picking up
Price is also below EMA20, which signals confluence with downtrend as well

GBP/USD Full Analysis: Can W e Break Through This Resistance!Price has been moving around a very strong area of resistance and as shown on the on the chart u will see multiple wicks trying to push through this res and failed completely. my prediction for this pair is that USD on the index is struggling to move to the upside and the maid direction is down, also if we combine fundamentals too i believe strongly that USD will continue melting.
for GBP/USD pair i will wait for a daily candle stcik closure above this area of resistance. if i get this then entering a buy trade will be the best and low risk setup

Short term analysis main trend is still bullishXAU/USD Technical Analysis (H1)
1. Overall Trend
Gold (XAU/USD) is moving inside an upward channel, confirmed by two parallel rising trendlines.
After bouncing from the strong support zone around 3,520 – 3,540 USD, price has been forming higher lows, keeping the bullish structure intact.
2. Key Support & Resistance
Strong Resistance: 3,660 – 3,680 USD zone. Price has been rejected here multiple times, creating a zig-zag/triangle-like pattern.
Dynamic Support: The rising trendline. As long as price stays above this line, the bullish bias remains valid.
Static Support: 3,520 – 3,540 USD. If the trendline breaks, this will be the next key zone to test buyers’ strength.
3. Chart Pattern
Price is consolidating in a triangle/zig-zag formation within an uptrend, often considered a continuation pattern.
If the resistance at 3,660 – 3,680 USD is broken, price may rally toward the psychological level 3,700 – 3,720 USD.
4. Trading Scenarios
Bullish (preferred):
Enter long on pullbacks to the trendline or on a breakout above 3,660–3,680.
Target: 3,700 – 3,720 USD.
Stop-loss: Below 3,620 or under the trendline.
Bearish (alternative):
If price breaks the rising trendline, a correction toward 3,520 – 3,540 USD is possible.
This zone will act as a decisive level for the next direction.
👉 Conclusion: The short-term bias remains bullish, but a clear breakout above 3,660 – 3,680 is needed for confirmation.

Fundamental Market Analysis for September 15, 2025 USDJPYThe pair trades around 147.4. Last week the yen firmed after political headlines from Tokyo: the prime minister’s resignation increased uncertainty and supported safe-haven demand for JPY. At the same time, US yields pulled back on softer labor data and a mild PPI, narrowing the rate differential in the dollar’s favor.
On Japan’s side, debate has revived about further BoJ normalization as wages rise and inflation stabilizes. Even if the BoJ leaves settings unchanged at the next meeting, the risk balance is shifting from one-sidedly dovish toward more neutral, which limits USD/JPY upside as a Fed cut appears likely.
The combination of a prospective Fed cut on Wednesday and elevated political noise in Japan makes further downside drift plausible. We prefer selling at 147.500 with a 146.000 target and a 148.500 stop. A “hawkish” Fed reaction and/or an ultra-cautious BoJ could push the pair back toward 148+.
Trading recommendation: SELL 147.500, SL 148.500, TP 146.000

BTC: What to expect on Monday?BTC: What to expect on Monday?
Sunday is the perfect time to sync up with the market while most people are resting. Historically, Monday sets the tone for the entire week, often bringing increased volatility after the CME futures open. Currently, we can see the price of BTC on the 1-hour chart moving neatly within an ascending channel, gathering strength before the next impulse. This is the calm before the storm.
Fundamentally, everyone is awaiting this week's US Federal Reserve meeting, where there is a high probability of a rate cut. This could weaken the dollar and provide a powerful boost to risk assets, including Bitcoin. Technically, we have run into a key resistance zone of $117,200 - $117,500. It is here that the short-term fate of the trend is being decided. A breakout above this level will open the way up for us.
My plan is simple: I am not entering a position right now, but rather waiting for confirmation. I need a confident breakout and for the price to hold above $117,500. If that happens, my first target will be the $119,000 area.

fed press confrencehere to share an idea and show a road , on 17th the press is gonna decide where the markets will be going towards and probably on the next monday im expecting to see another gap on the CME chart which the market will tend to fill it where when how i dont know but based on my experience and expectation there will be another cme gap created in the upcoming weeks , certainly saying and claiming that the BTC price will get pumped or dumped is not really a professional way to look at the markets im expecting to see a 135k to 160k btc on new years eve but these again are just expectations.
thank you for reading this if it was helpful
leave your impression that would help my account to reach more people and help them to understand the markets better

XAUUSD: Rully Will Continue in ChannelHello everyone, here is my breakdown of the current Gold setup.
Market Analysis
From a broader perspective, the price of Gold has been in a strong and sustained uptrend for some time. This entire bullish phase has been neatly contained within a well-defined Upward Channel, which has been guiding the price through a series of higher highs and higher lows, establishing a clear bullish market structure.
Currently, the price is trading in the upper half of this channel, consolidating after its most recent push higher. The momentum appears to be pausing, which is a normal and healthy sign in a sustained trend. This pause often precedes a brief corrective move before the next leg higher.
My Scenario & Strategy
My scenario is based on the expectation that this dominant uptrend will continue to be respected. I am looking for the price to make a small corrective dip from its current position.
Therefore, the strategy is to watch for this bounce as a potential entry to rejoin the trend. A confirmed rebound would validate the long scenario. The primary target for the next impulsive wave higher is 3710 points, aiming for a new high within the channel's structure.
That's the setup I'm tracking. Thank you for your attention, and always manage your risk.

BTCUSD Short: A Corrective Decline is AnticipatedHello, traders! The price auction for BTCUSD has been clearly defined by a large ascending channel. This bullish structure has guided the price higher through a series of higher highs and higher lows, with the demand zone 2 at the 110000 level acting as a major foundational low. The initiative has remained firmly with the buyers throughout this trend.
Currently, the auction is at a critical inflection point, having reached the upper supply line of the ascending channel. This test of the highs comes after a sustained rally, and the market is now in a key area where selling pressure is expected to emerge. This price action could indicate a phase of trend exhaustion.
The primary scenario anticipates a short-term corrective move from these highs. The expectation is that after a potential final push higher, the price will be rejected from the channel's resistance. A confirmed reversal would signal a temporary shift in control to sellers. The take-profit for this corrective play is therefore set at the 113400 level, targeting the major horizontal demand zone. Manage your risk!

EIGEN SHORT TERM be careful for trigger if it not triggered do not enter cause here is a bit critical under that line we may see a bearis movement Above white support eigen still chance to rise but my main target feels like a bit far so you may want to close some at tp 1
Always manage your own risks this is not a investment advise I am not responsible neither your loss nor profit.

Gold (XAUUSD) – Technical Outlook
🟢 Bullish Scenario:
Key Level (Pivot): 3630
If price holds above 3630, bullish momentum may extend towards:
🎯 First target: 3656 (resistance)
🎯 If 3656 breaks strongly → continuation towards:
🎯 Second target: 3675
🎯 Third target: 3697
🔴 Bearish Scenario:
If price fails and sustains below 3630, bearish move may develop towards:
🎯 First support: 3595 (a strong support zone)
🎯 If 3595 breaks decisively → continuation towards:
🎯 Second target: 3546
📌 Summary:
3630 = decision zone
3656, 3675, 3697 = upside targets
3595, 3546 = downside targets

Fundamental Market Analysis for September 12, 2025 GBPUSDThe pound is trading near 1.35500 amid a weak dollar and expectations that the Bank of England will keep rates unchanged on September 18. The market highly values the likelihood of a pause, as wage growth and persistent “hard core” service inflation are keeping the regulator from easing anytime soon. This supports the interest rate differential in favor of the GBP against the dollar in the coming weeks.
The US, in turn, is providing additional tailwinds through growing signs of a weakening labor market and easing inflationary pressures in segments relevant to PCE. Risk appetite remains strong, which is combined with investor caution towards the long dollar ahead of the Fed meeting. Political and fiscal risks exist in the UK, but in the short term, they are secondary to the monetary agenda.
Based on the fundamental balance, the base scenario is to buy with careful money management: BUY 1.35550, SL 1.35150 (below the nearest macro news “risk threshold”), TP 1.36250 — provided that the Fed/BoE rhetoric remains moderately dovish and there are no surprises on inflation.
Trading recommendation: BUY 1.35550, SL 1.35150, TP 1.36250

EURJPY: Uptrend ContinuationSeveral observations over on the daily and H1 timeframes.
Daily Timeframe:
EMA20 remains above EMA60, which indicates uptrend from a technical standpoint.
Price is also crossing above HTL so that's no longer holding as resistance.
H1 Timeframe:
Price crosses above ATL, pulls back, and holds above breakout level.
The demand zone is subjective but price's pull-back did remain above this zone.

Buy if price breaks above 3,670 with confirmation, target around1. Main Trend
Gold remains in a strong uptrend, forming higher highs and higher lows.
The rising channel (red trendlines) is still intact, though price is now testing a strong resistance zone.
2. Resistance Zone & Upside Target
Key resistance area: 3,650 – 3,670 USD/oz (blue box on the chart).
If price breaks clearly above 3,670, the next target will likely be 3,700 – 3,720 (psychological level and Fibonacci extension zone).
3. Pullback Scenario
If price fails to break resistance, a pullback may occur toward Fibonacci retracement levels:
Fib 0.786 ≈ 3,574 USD (nearest support).
Fib 0.618 ≈ 3,509 USD (major support, aligning with previous demand zone – red box).
Fib 0.5 ≈ 3,463 USD (intermediate support).
The 3,500 – 3,510 USD zone is a critical support area; if broken, a deeper correction could unfold.
4. Technical Signals
Price is forming a small triangle/pennant pattern right at resistance → suggesting a strong breakout is likely soon.
RSI/Momentum (not shown here but typically at these levels) may be in overbought territory, increasing the chance of a short-term correction before resuming higher.
5. Trading Scenarios
Bullish case (preferred): Buy if price breaks above 3,670 with confirmation, target around 3,700 – 3,720.
Bearish case: If price gets rejected at resistance and breaks below the rising trendline, short-term selling may target 3,574 – 3,510.
📌 Summary:
The main trend remains bullish, but the 3,650 – 3,670 zone is the decision point.
A confirmed breakout → 3,700+.
Failure to hold → correction toward 3,574 or deeper to 3,510.
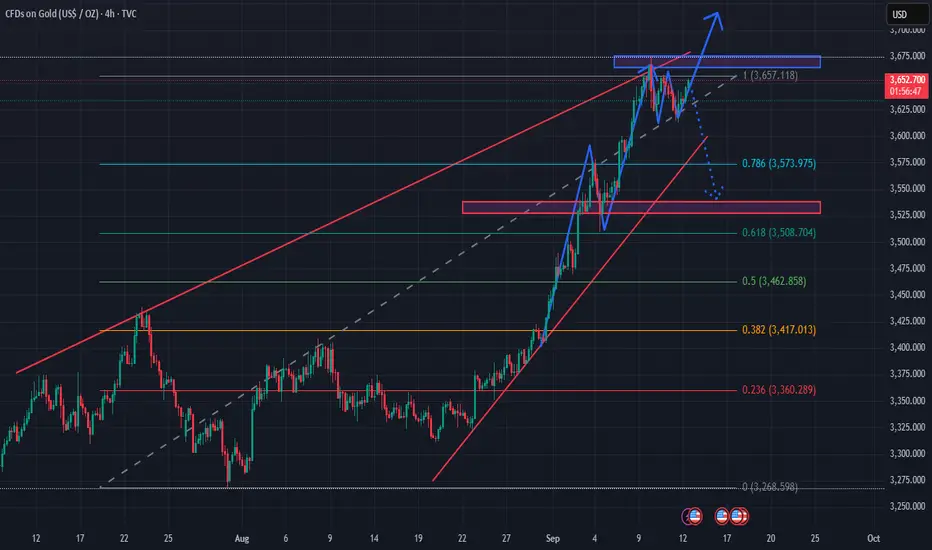
If gold stays above 3,585 and breaks 3,680, it could target 3,70 External News Factors
Gold is supported by expectations of a Fed rate cut in September, which continues to drive safe-haven inflows.
Additionally, geopolitical tensions (Russia–Ukraine, Middle East) and concerns over the U.S. debt crisis (interest payments surpassing $1.1 trillion, fiscal deficit nearing $2 trillion) further strengthen gold’s bullish momentum.
The U.S. dollar is showing slight weakness, adding more fuel to gold’s upside.
Overall Trend
Gold (XAU/USD) is in a strong uptrend, clearly shown by the steep rally from the support area around ~3,420 USD.
Price has already broken through several key Fibonacci retracement levels and is now testing the upper resistance zone (~3,650 – 3,680 USD).
Key Support and Resistance
Main Resistance: 3,650 – 3,681 USD (red zone on the chart). This is a strong supply zone where price is consolidating.
Nearest Support: Around 3,585 – 3,517 USD (Fibo 0.786 and 0.618 levels).
Major Support: 3,420 USD (aligned with Fibo 0.382 and the previous consolidation area marked “SUPPORT”).
Price Pattern
Within the resistance zone, price is showing signs of forming a triangle/sideways accumulation pattern.
A breakout to the upside could confirm a continuation pattern (trend continuation).
Trade Scenarios
Bullish Scenario (preferred): If gold holds above 3,585 and breaks through 3,680, the next target would be the psychological level of 3,700 – 3,720 USD.
Bearish/Correction Scenario: If price fails to hold 3,585, it could retrace deeper to 3,517 or even 3,420 before buyers step in again.
👉 In summary: The main trend remains bullish. Gold needs to consolidate and decisively break above 3,680 to aim for 3,700+. If it fails, a pullback towards 3,585 – 3,517 is likely before another buying opportunity.

Gold (XAUUSD) Technical Outlook
🟢 Bullish Scenario:
Key level: 3612
If the price holds above 3612, the bullish momentum is likely to continue towards:
🎯 First target: 3656
🎯 Second target: 3675
🎯 Third target: 3697 (if 3656 breaks strongly)
🔴 Bearish Scenario:
If the price breaks and sustains below 3612, the downside move may extend towards:
🎯 First support: 3595 (a strong support zone)
🎯 If this level breaks and price sustains below ➝ further decline towards:
🎯 Second target: 3546
📌 Summary:
3612 = key decision level
3656, 3675, 3697 = upside targets
3595, 3546 = downside targets

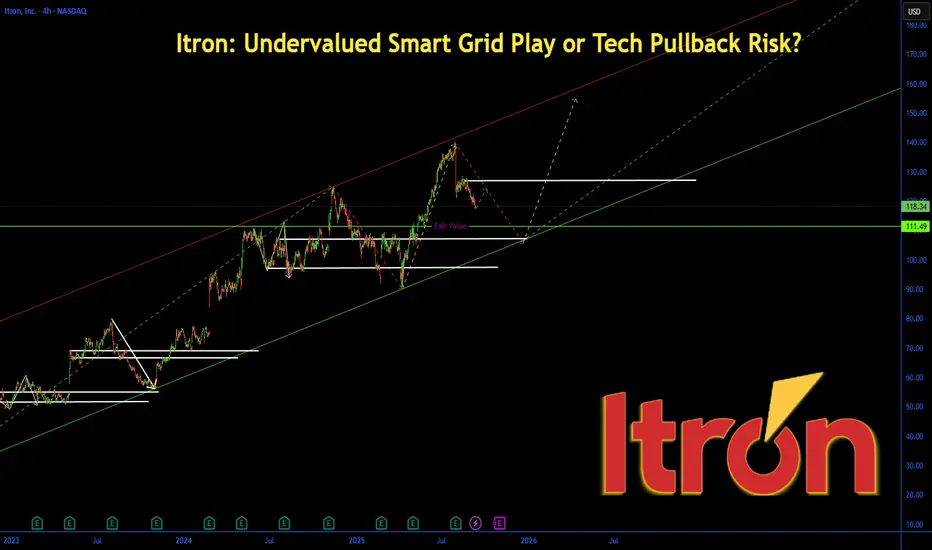
Itron: Undervalued Smart Grid Play or Tech Pullback Risk? Itron: Undervalued Smart Grid Play or Tech Pullback Risk? $144 Target in Play?
Itron (ITRI) shares are trading at $118.29 today, down 0.40% from yesterday's close but up 2.5% over the past week amid broader market gains following S&P 500 and Nasdaq record highs. As a leader in smart metering and utility analytics, Itron reported record Q2 2025 profitability and raised its full-year earnings guidance, even as revenue expectations were trimmed slightly due to supply chain hiccups.
With analysts pegging a $144.40 one-year target—implying 22% upside—and the stock flagged as one of September's top undervalued picks, is ITRI poised for a breakout on IoT and energy transition tailwinds, or will sector rotation and macro jitters weigh it down? Let's dissect the fundamentals, SWOT, technicals, and setups for September 11, 2025.
Fundamental Analysis
Itron's growth is anchored in the booming demand for smart grid solutions, with Q2 2025 delivering EPS of $1.12 (beating estimates) and margins hitting all-time highs at 11.05%. Analysts forecast 2025 EPS of $6.45 on $2.5B revenue, up 10% YoY, fueled by utility digitization and partnerships in renewables. However, softer demand in some segments and persistent supply issues could pressure short-term execution if inflation lingers.
- **Positive:**
- Raised 2025 earnings guidance signals operational strength; strong backlog in smart metering amid global energy upgrades.
- Institutional buying and ETF inflows in industrials highlight undervaluation at 18.35 forward P/E versus sector average of 22x.
- Broader trends like AI-driven grid management and ESG mandates position Itron for 15%+ annual growth.
- **Negative:**
- Revenue trim in guidance reflects supply chain vulnerabilities and delayed projects.
- Economic uncertainties, including potential tariff escalations, could slow utility capex if rate cuts stall.
SWOT Analysis
**Strengths:** Dominant market position in smart metering with a 20%+ share in North America; robust R&D pipeline yielding high-margin IoT innovations and recurring software revenue.
**Weaknesses:** Heavy reliance on cyclical utility spending exposes earnings to economic downturns; elevated debt levels at 0.8x EBITDA limit flexibility amid rising rates.
**Opportunities:** Expansion into emerging markets like Asia-Pacific for grid modernization; integration of advanced analytics and AI for $11.9B global utility market by 2025 end.
**Threats:** Intensifying cybersecurity risks in connected devices; fierce competition from Siemens and Schneider, plus regulatory shifts in energy policies.
Technical Analysis
On the daily chart, ITRI is forming a bullish ascending triangle after rebounding from $115 support, with volume rising on the upside amid the broader tech rally. This follows a 3.68% monthly dip, now stabilizing near key EMAs as September forecasts eye a range of $108–$120. Current price: $118.29, with VWAP at $117.80 offering intraday balance.
Key indicators:
- **RSI (14-day):** At 52, neutral but climbing from oversold—bullish if it sustains above 55. 📈
- **MACD:** Histogram ticking positive with lines converging for a potential crossover, signaling emerging momentum. ⚠️
- **Moving Averages:** Price above the 21-day EMA ($116.50) but testing the 50-day SMA ($119)—a hold here maintains the uptrend.
Support/Resistance: Solid support at $115 (recent low and 200-day EMA), resistance at $120 (September high). Patterns/Momentum: Triangle apex approaching; breakout above $120 targets $130. 🟢 Bullish signals: Higher lows and analyst upgrades. 🔴 Bearish risks: Bearish MA trend could drag to $108 on sector weakness.
Scenarios and Risk Management
- **Bullish Scenario:** Clear $120 on strong earnings momentum or soft CPI data targets $130 short-term, then $144 by year-end. Buy dips to $115 for value entries.
- **Bearish Scenario:** Drop below $115 eyes $108 (monthly low); broader tech correction could trigger 10% pullback.
- **Neutral/Goldilocks:** Range-bound $115–$120 if data mixed, suitable for covered calls or waiting for Q3 catalysts.
Risk Tips: Set stops 2% below support ($112.70) to curb downside. Risk 1-2% of portfolio per trade. Diversify with peers like SEDG or broader industrials to dodge utility-specific traps.
Conclusion/Outlook
Overall, a bullish bias if ITRI holds $115 and guidance beats continue, cementing its undervalued status with 20%+ upside on smart grid demand.
But watch Q3 earnings and Fed minutes for confirmation—this echoes September's value rotation in tech amid record highs. What’s your take? Bullish on Itron's rebound or sidelining for now? Share in the comments!
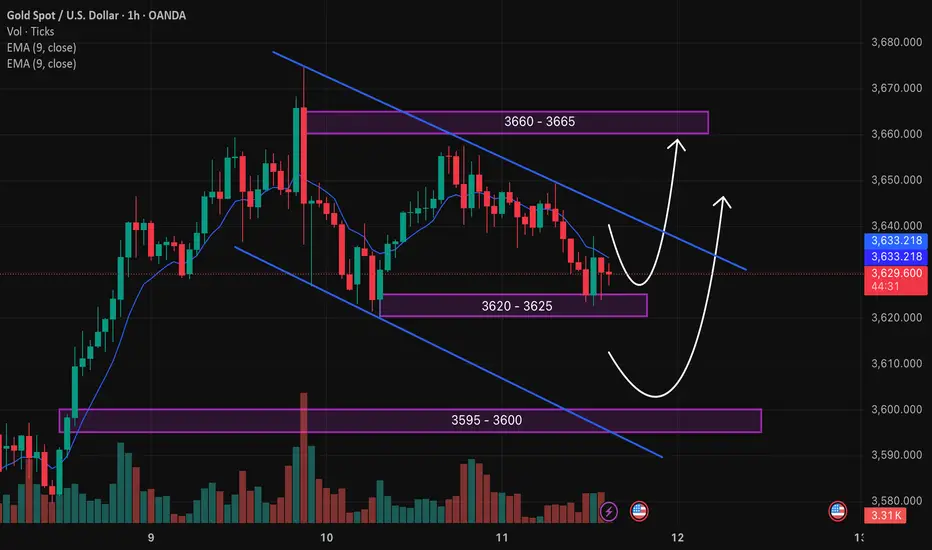
Gold Trading Strategy XAUUSD 11/9/2025Gold Trading Strategy XAUUSD 11/9/2025: Gold is stable, traders prepare ahead of important US CPI data, conditions and technical positions to watch.
Fundamental news: Spot gold prices were generally stable in today's Asian trading session, currently around $3630/ounce. Gold prices are in a wait-and-see mode, closely watching the all-time high before the release of US CPI data for August. Weak US PPI inflation data, fueling speculation that the Federal Reserve will continue its easing cycle at its upcoming meeting in September.
Technical analysis: After making the latest ATH at 3675, gold prices are correcting and forming a short-term downtrend channel in the H1 frame, however, the 3620 - 3625 area is still a good support zone for gold prices. Currently, there will be 2 scenarios with the highest probability of occurrence: Case 1: Gold price will form an upward price pattern around the 3620 - 3625 area and increase sharply, we will wait for the reaction when the price meets resistance at 3660 - 3665. Case 2: Gold price continues to follow the downtrend channel to the lower support area of 3595 - 3600 and then increase again. We will trade based on these 2 scenarios and still prioritize trading according to the main trend.
Important price zones today: 3620 - 3625, 3595 - 3600 and 3660 - 3665.
Today's trading trend: BUY.
Recommended orders:
Plan 1: BUY XAUUSD zone 3620 - 3622
SL 3617
TP 3625 - 3635 - 3645 - 3665 - OPEN.
Plan 2: BUY XAUUSD zone 3598 - 3600
SL 3595
TP 3603 - 3610 - 3630 - 3660 - OPEN.
Plan 3: SELL XAUUSD zone 3663 - 3665
SL 3668
TP 3660 - 3650 - 3640 - 3630 (small volume).
Wish you a safe, effective and profitable trading day.🌟🌟🌟🌟🌟
Fundamental analysisFundamental analysis is a method of evaluating the intrinsic value of a financial asset by analyzing economic, financial, and geopolitical factors that influence its price.
It’s the opposite of technical analysis, which focuses on charts and price patterns. Instead, fundamental analysis looks at the "why" behind price moves.

Fundamental Market Analysis for September 11, 2025 EURUSDThe euro is getting support as the market has a calmer view on the Fed: investors expect gentler moves later this year, so the dollar doesn’t look as strong as it did in mid-summer. At the same time, the ECB avoids sharp statements: the regulator is acting cautiously and making sure eurozone inflation doesn’t re-accelerate. In this environment, the euro feels more confident and can slowly climb toward 1.18000.
The US remains the key risk: if inflation or jobs data comes in much stronger than usual, the dollar will rise quickly and the euro may pull back. For now, the backdrop is neutral-to-positive for the euro: fewer market fears, stable rate expectations, and no “hawkish” surprises from Frankfurt. That makes buying moderately justified with controlled risk.
Overall: absent a major upside surprise in US data and without tough signals from the ECB, the pair has a chance to edge higher from current levels. The 1.18000 target looks realistic in the near term, and the stop level helps keep the position under control.
Trade idea: BUY 1.17000, SL 1.16850, TP 1.18000

XAU/USD (Gold) - Trendline Breakout (US - CPI Data) (11.09.2025)The XAU/USD Pair on the M30 timeframe presents a Potential Selling Opportunity due to a recent Formation of a Trendline Breakout Pattern.
This suggests a shift in momentum towards the downside in the coming hours.
Possible Short Trade:
Entry: Consider Entering A Short Position around Trendline Of The Pattern.
Target Levels:
1st Support – 3583
2nd Support – 3546
🎁 Please hit the like button and
🎁 Leave a comment to support for My Post !
Your likes and comments are incredibly motivating and will encourage me to share more analysis with you.

GBP/USD - Breakout (US - CPI Data) (11.09.2025)The GBP/USD Pair on the M30 timeframe presents a Potential Selling Opportunity due to a recent Formation of a Breakout Pattern.
This suggests a shift in momentum towards the downside in the coming hours.
Possible Short Trade:
Entry: Consider Entering A Short Position around Trendline Of The Pattern.
Target Levels:
1st Support – 1.3475
2nd Support – 1.3441
🎁 Please hit the like button and
🎁 Leave a comment to support for My Post !
Your likes and comments are incredibly motivating and will encourage me to share more analysis with you.

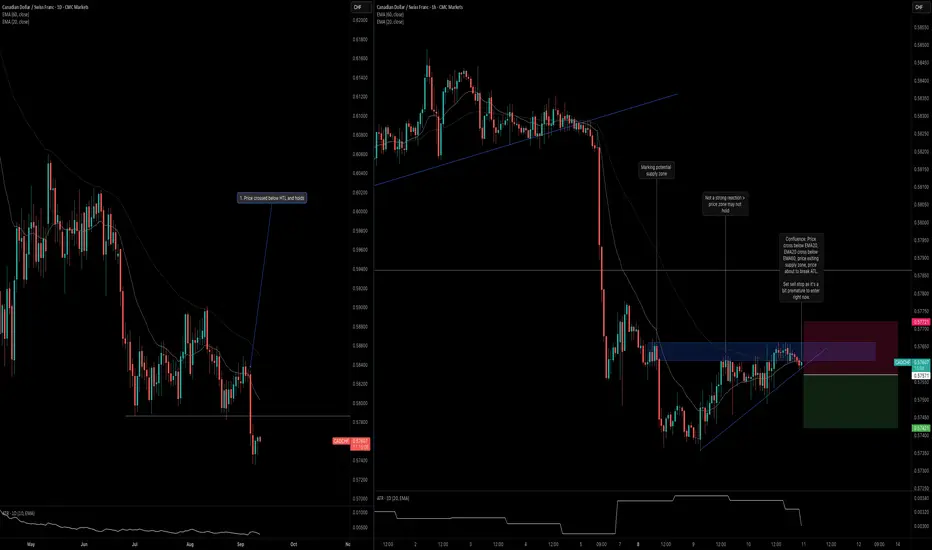
CADCHF: Trend Continues Below Daily LevelCADCHF is beginning to show confluence, which gives me an opportunity to frame my entry opportunity. Here are the key observations across the daily and H1 timeframes.
Daily Timeframe:
Price made a strong break below the HTL and is holding below it.
Although two bullish bar formed, they did not engulf the previous bearish bar, which is a good indication that buying strengh just isn't there.
H1 Timeframe:
There's quite a bit of confluence on the H1 timeframe with the first being price entering and exiting the potential supply zone.
In addition, price is about to cross below the ATL, which is another sign that the counter-trend move is ending.
Finally, there's confluence with the moving averages where EMA20 is crossing below EMA60; price is also beginning to cross below EMA20.