EUR/USD breakout buy alert EUR/USD Buy Opportunity
Current Price: 1.17500
📈 Buy Entry Active — Targeting higher levels
✨ Euro showing bullish momentum against USD.
✨ Buyers are holding strong support at 1.17500.
✨ Upside pressure is building for a breakout.
✨ Trend indicates further gains ahead toward key resistance.
✨ Market sentiment favors the Euro as strength continues.
⚡ Stay with the buyers — momentum is on your side!
---
Do you want me to add specific target levels (like TP1, TP2, SL) to make it look more like a professional signal?
Analysis

USDSEK: Trend ContinuationUSDSEK looks to resume its downtrend. This is observable based on the daily and 1-hour timeframe confluence.
Daily Timeframe:
Starting on the daily timeframe, EMA20 rests below EMA60, with price hovering below EMA20. This indicates that the overall trend is down.
In addition, price recently made a clean break below the horizontal trendline (HTL). It then tried to trade above it with no success.
1-Hour Timeframe:
Over on the lower timeframe, we see confluence as well. Price crosses below the ascending trendline, which indicates the overall trend is resuming. There's alignment on the daily and 1-hour timeframes.
My entry is based on the consolidating range that formed after the price pullback. Price is now breaking out of this range, which signals that momentum is picking up.

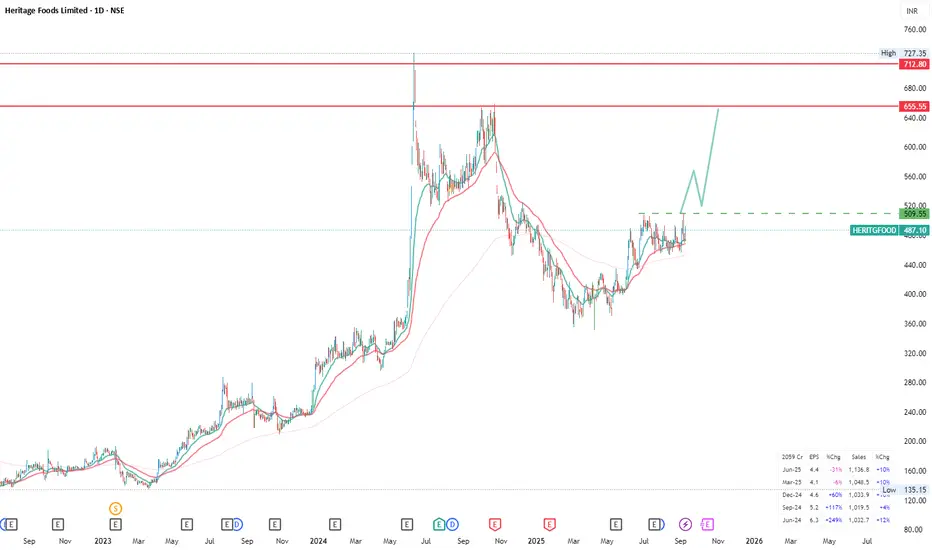
Heritage Food - Dairy Product going to become a Brand - Go LongGST relief for dairy products
The revised GST rates, effective September 22, are set to benefit the organized dairy sector significantly. Key changes include:
UHT milk: reduced from 5% to 0%
Butter, ghee, cheese: cut from 12% to 5%
Paneer: brought down from 5% to 0%
This move is expected to make packaged dairy products more affordable, boosting demand across India and giving a direct push to branded players.
Heritage Foods among key beneficiaries
As one of India’s prominent dairy firms, Heritage Foods is poised to benefit from lower tax incidence, potentially improving sales volumes and consumer reach. The announcement also sparked optimism across other dairy counters such as Hatsun Agro, Parag Milk, Dodla Dairy, Umang Dairies, and Nestle India (value-added dairy portfolio). FMCG majors like Britannia and ITC are also seen as indirect beneficiaries.
Market outlook
Brokerage houses believe the GST cuts are a strong positive catalyst for the dairy industry, aiding profitability and consumption growth. Investors now await Q2 results to see the real impact of the new tax regime on revenue momentum.
Record Revenue: Q1 FY26 delivered the highest ever quarterly revenue at INR 11,368 million, marking the third consecutive quarter of double-digit revenue growth. Management attributes this to “strength of the core business and agility of our supply chain networks”.
Profitability:
EBITDA: INR 739 million, margin at 6.5%.
PAT: INR 405 million, margin at 3.6%.
Margins were “softer due to seasonality, input cost inflation and a temporary product mix shift”, but are expected to “normalize in coming quarters as volume-led operating leverage kicks in.”
Brand & Product Initiatives
360-degree Brand Campaigns: Rolled out across Andhra Pradesh, Telangana, Tamil Nadu, and Karnataka. Notable campaigns for curd (season three) and first-ever milk brand campaign focused on “purity.”
Heritage Livo Platform: Launched fortified flavored milk (vitamins A & D) and high-protein yogurts. Targeting “growing health-conscious consumer segment.”
Margin & Cost Dynamics
Input Costs:
Raw milk procurement price up 4.74% YoY, “a tad higher than what we would have liked, but nothing extraordinary.”
Sequential increases in procurement prices due to lean seasonality (May–June).
Management chose to “hold price increases to ensure volumes stay strong” in April–May, especially for VAPs.
Gross Margin Analysis:
Margin knock (160–180 bps) attributed to VAP mix decline, not bulk fat losses.
Standalone VAP (ex-fats) share: 36.1% vs 37.5% YoY; management expected 39% if growth had continued.
Lower volumes in VAPs led to suboptimal cost absorption and plant utilization.
June saw normalization; July onwards expected to be “normalized.”
Inventory & Working Capital
SMP Inventory:
6,197 MT as of 30 June 2025 vs 4,586 MT YoY.
Higher stock due to lower consumption in Q1 (VAP demand hit); expected to be consumed in Q2–Q3.
Working Capital:
Cycle days at 19 (inventory: 35 days, receivables: 3 days, payables: 17 days).
Commitment to maintain <20 days, aided by B2C model and fresh nature of products.
Industry Headwinds:
Q1 impacted by “erratic monsoon and unseasonably cool summer,” leading to VAP demand shrinkage and margin softness.
Management expects “normalization” as volumes recover and operating leverage improves.
Milk supply expected to be stable; procurement prices may see minor increases but “nothing extraordinary.”
SMP inventory to be absorbed in Q2–Q3 as VAP demand recovers.
Growth Guidance:
No formal guidance, but management aspires to return to 15–16% revenue growth and ~20% VAP growth for FY26, assuming normalization of demand.
EBITDA margin expected to recover by “at least a percentage correction.”
Fundamental Market Analysis for September 08, 2025 GBPUSDThe GBP/USD pair is starting the new week on a softer note, dropping below the 1.3500 psychological mark during the Asian session. However, the decline does not look convincing, which calls for caution from bearish traders and positioning for a continuation of Friday's pullback from the 1.35550 area, or a nearly three-week high.
The US Dollar (USD) is gaining positive momentum and pulling away from its low since July 28, reached on Friday in response to disappointing US employment data, which in turn is putting pressure on the GBP/USD pair. The rise in the USD can be attributed to the fall of the Japanese Yen (JPY) amid domestic political turmoil and risks fizzling out rather quickly amid growing bets on a Federal Reserve (Fed) rate cut.
The U.S. Nonfarm Payrolls (NFP) report showed that the economy added only 22,000 jobs in August, significantly below consensus forecasts. In addition, revisions to previous data showed that the economy lost 13,000 jobs in June, the first monthly decline since December 2020, indicating a weakening U.S. labor market. This has fueled speculation of a more aggressive Fed interest rate cut and should limit the USD's rise.
The British Pound (GBP), however, may struggle to attract significant buyers amid financial uncertainty ahead of the autumn budget in November.
Trading recommendation: BUY 1.34950, SL 1.34750, TP 1.35950

Gold 1H Outlook | Key Levels to Watch – 3595 | 3625 | 3470Gold is trading near 3594 after a strong bullish move. On the 1-hour chart, price has been following a rising trendline which shows that buyers are still active.
Here’s what matters for traders today:
🔹 Key Support Levels:
3560 → intraday support where buyers are stepping in.
3525 → major structural support + trendline confluence.
🔹 Resistance Zones:
3595 → first resistance, market is already reacting here.
3625 → next upside objective if buyers stay in control.
📌 Bias:
As long as price holds above 3525, gold remains bullish. Upside path: 3595 → 3625.
A confirmed break below 3525 would mean a shift in structure. In that case, sellers may push price towards 3470

CBDCs, Cryptocurrency, & the coming Redenomination RevolutionDisclaimer: this is not financial advice - this is strictly speculation and scenario planning, and totally not drawn on privileged information from powerful people. Please consume responsibly.
Let's set aside memecoins, rugpulls, and corpo coin acquisitions to focus on what actually matters: macro.
I'm married to the money, so I follow macro wherever it goes. And it's going into CBDCs and cryptocurrency. You could say it started in the past 12 mos with the GENIUS bill, tariffs, BRICS' concept coins, etc but the truth is more devious than that. The macro perspective is much more than the flow of money, its the sentiment and interest of policy makers, national actors, and IGOs. In other words, groups that make money through passive taxation create macro conditions to control or create outcomes that influence how you make or spend money. They are interested in strategic payoff over cashing out. This means the way they look at crypto is different than retail and investors. As groups, you seek legitimacy for a profit payoff, they seek strategy for a power payoff. Fiat currency is not some platonic ideal willed into being by the laws of nature, it's entirely an instrument of the national interest. In other words, it exists only so long as policymakers find it strategically useful.
So let's look at their strategy.
For almost three years now, your world leaders and central bankers have been preparing for a reserve currency transition scenario. They've made sudden pivots to programmable currency R&D, they've been hoarding gold into CBs and taking extra steps to keep it quiet, they've been making strange comments about fantastical banking crisis scenarios, adjusting payment options for hydrocarbons (the USD is an international soft-peg), signaling the desired end of the dollar reserve (or oddly making protecting the dollar reserve part of their political platform), and building cross-border systems (BRICBridge/mBridge) to facilitate non-SWIFT or SWIFT legacy exchange/insurance/settlement capabilities. Certain essential economic entities in the West have been prepped as well but are not yet in position to disclose. Meanwhile, Ray Dalio is already identifying our monetary order as the primary vulnerability. He's not the only old rich person to notice. Buffet is done with markets by EOY. You could say that value investing is retiring.
Contrary to popular opinion, this reserve currency transition will not take place as an Orwellian CBDC takeover or some BTC moon shot, but will instead be pitched as a redenomination opportunity - likely while GSIC banks are closed to customers (including ATM withdrawals and transfers and social payments or welfare services).
Before I get into the why this will happen, let's briefly look at the fragility of the modern monetary system under fiat.
If you think of the economic macrosystem as a living body, then you can understand, especially from recent memory, how a global infection could quickly bring just about everything to a halt. The lifeforce of the economic-being is the free-flow of USD. Powell has sufficiently proven this. In fact, you could almost argue the last 5 years have been the perfect demonstration of this gameplay loop. But you can't mistake the heart for the entire circulatory system. Liquidity is a digital dependency today. If the power goes out, there is no liquidity. If Window's crashes, there is no liquidity. If Crowdstrike gets hacked, liquidity is grounded (and air travel canceled). Liquidity is a luxury. It has been a luxury for all of human history. Only in times of conventional peace and American-led globalization have people begun to delude themselves otherwise. It will not work they way most think in tough times. Especially in our just-in-time widget meets server-based-bookkeeping era. The boardgame of money has never been flatter or more fragile. In an age of infinite KYC and a Bigger Brother, a major ATM corralito will not look like your Great-Grandfather's breadlines. Accounts will be electronically frozen (thus no withdrawals or personal payments) and social payments will be halted for several days or even up to several weeks (thus no welfare). Due to incredible complexity risk, capital controls will be applied like circuit breakers to shut everything down. This is how it will be done in major countries and how it has been done in small countries in recent years. M1 M2 M3 will be iced by natsec nitwits and placed under conservatorship. They will give you any and every excuse. Power outages, Russians, 4chan hackers, Iran, North Korea, Powell, Biden, a virus, weather, a disaster, Chyna, anything. They might even blame me.
To be truly forward in global macro, having an understanding of financial securities is not enough. National securities are a necessary intersect. If the NYSE went down unexpectedly for a few days, it would in effect generate a "stroke" for the velocity of the USD. Only one link in the financial accounting chain needs to be halted to warrant shutting down the entire electronic transaction system. There is no fractal redundancy, so to speak - everything is connected and dependent on that largely centralized and live bookkeeping data feed, otherwise the whole body gets hospitalized. This is the great weakness of centralized finance and merchant services and I'm sure I'm preaching to the choir here.
Only M0, select banking accounts (some community/credit & a chosen GSIC or two - IE, not Deutsch Bank), and alternative banking through cryptocurrency, will operate in that short window until your country's cartel sets a withdrawal rationing figure and initiates redemption options for the redenomination process. This process would likely involve the favorite GSIC (in the US) JP Morgan & the Post Office - giving national coverage to all area codes. You would convert your fiat, likely in cash and at a flat rate exchange that would be difficult for the layman to valuate, and receive the new notes. It could take several days to over a week before the rationing window is brought online. And even longer for the redemption system to be in place to convert federal notes to treasury notes (TL: CBDCs). These treasury notes will be backed by national assets - varying by nation, but always playing to their strengths. In the US, this means energy commodities, PMs, and the strategic crypto reserve and associated coins that service cross-border activity. The latter is the big money play, and has specifically been legalized through GENIUS to facilitate the merchant/business level transition when that occurs (the business-level redemption process will be aided by current crypto capability - which we will get in the DD section). I don't know if this board cares about PMs, but as a general standard, most nations that go through redenomination (a figure in the 100s) will opt to double or triple PM reserves (current standard is 20%), and will be interested in cross-border cryptocurrency (mBridge and/or crypto for BRICs, most of the G88, and potentially Eurozone). The reserve currency system under the US will come to an end at this point without any legal moves necessary to close the Federal Reserve. Initially, this will seem like a huge problem for the US alone. In reality, the opposite will be true. If you're a shoemaker in that pitiful collection of tourist destinations we call the EU, this is especially for you - because the fight over a national versus a continental currency solution could paralyze you all further. To wit, for the US and the world: it will likely mean the end of the housing market as a game of musical chairs, which will be the end of the global monetary system under its current paradigm for all major nations.
Now I'm not trying to create fear and panic, even though that's the main thing this website does. No one will starve or get sent to the streets during a cash crash in a developed country in the contemporary era. The situation will start as a misunderstood market event. But there will be a Bretton-Woods tier recalibration at a national (likely international) level to follow shortly after. The "forum building" stage of this event has already begun. Tariffs are revealed to be part of broad but messy geopolitical strategy, the escalation of which will engage the monetary system itself (goods>ports>share listings>national bonds). You will see that sequence begin to play out in the months to come, especially after the Rio Reset dud and the Swiss paper metal tariff. Trump's "deals" with certain countries keep getting delayed or reneged. He will continue his holding pattern on this matter, switching between punitive and TACO to extend the tariff negotiation horizons.
1.Global Blocks
The CCP are positioning to replace their dependency on the US-led Rules Based Order. When foreign policy suits and grey moustaches say 'RBO X' or 'US superpower Y', they mean reserve currency and maritime system dominance. It all comes down to coins and boats, as it always has. For our purposes, only the former is of interest (but buy all your high end electronics soon, because further tariff escalation will draw in shipping and port strategies - even if we freed up Panama beforehand). This isn't the right board for the investor note from hell, but all indications are a go for a reserve currency challenger framework to be officially announced Q4 or H1 of 2026. Most ongoing projects intend to connect commodities to currencies. This is necessary to build an alternative SDR. Certain nations and entities in the ME will be likely facilitators and front men for this framework (particularly to ease or lobby the G88). This is battlelines over bucks. Your favorite loose lips sink ships guy already came out rambling about it when he posted out of the blue about BRICs challenging the USD. I hope you all understand by now that when it wasn't a topic on Fox and Friends, then it's because he repeats what he is told in private.
When China introduces a settlement CBDC (with Russian, various Eurasians + some MENA, and potentially Brazilian support), their international accounting will require reserves to be interchangeable with other CBDCs. These reserves will be similar to the Special Drawing Rights, but include commodities (particularly those favorable to the majority of partners; aka what they produce or already hold). This means more gold and possibly silver, to start (imagine going from 20% standard gold reserve holdings to 40/60 + 10 in silver). Later platinum, lithium, uranium, and other frontier tech minerals which will be increasingly valuable and likely included. Regardless, this transition will push Chinese investors (retail and institution) out of UST (even if the tariff threat has ended). It's not a reserve for them any more, it may even be illegal to hold UST over a certain amount. That could happen overnight. The inevitability of this sequence shouldn't be underestimated. Many of the big holders of US bonds, aka those with a stake in the ticker we call USD, are not friendly at best. Others are always looking for ways to hedge their risk. This is not the free-market as you understand it. It's being Eli Lilly but your biggest stakeholder is RFK Jr. You know that's not gonna last, right?
For Europe, the reactive risk is closely related to disaster or conflict risk. Tariffs might be enough too. I'm leaning towards Germany or the UK accelerating the contagion for the broader continent. German manufacturing and energy are critically vulnerable. German PMI has been in effective contraction for 27 of the last 30 some months, and last year saw a record-breaking number of bankruptcies in the country. Both UK or Germany would handle an economic downturn poorly due to rising populist movements jumping on alternatives ( = national bond credit risk = currency vulnerability). The possibility of a second Brexit event following a commanding populist return is not priced in. Likewise, another pandemic or an expansion of Russia's war would lead to a tap out of EU economic unity. Annoyingly, the French and Germans are unlikely to search for an economic relief package of a conventional nature or one that is associated with American interests. In other words, they will be working with ME and Asia if the EU does not guarantee European continental harmony on a new Bretton-Woods framework (which I don't think they will).
Japan also falls into the reactive risk category. The question is the cause package. They have no cushion and all it takes is a little shove. Yes they has a high savings rate, but purchasing power and their import dependencies (high-pop island country) negates any security they think that will provide. It's unlikely 3rd world exporters will keep the basic necessities flowing (think in terms of virtual water exports) for the next GFC or summer famine/disaster. 3rd world imports and access to cheap food underpins much of the shadow economy for Asia (see local news over rice cost) - so consumption would crash along with rising unemployment (uncaptured but real) - and the BOJ has no room to stop unemployment without sacrificing their national corporate champions (RIP Buffett) (and thus more unemployment in their zero-entrepreneurial environment). All of this is a pretzeled way of saying that conventional economic shocks could trigger the cash crash, or vice versa. Unconventional risk - like MENA cyberwar risks (who knows what blowback we might face after Iran), or even geophysical concerns like another "1000 year event" (happening every month now) but this time in a major financial area like Tokyo or SF (do you buy or sell disaster bonds in that scenario?). Suffice to say, the unconventional supporting fuel will be there. No one ever signals the big deflationary event to the greater public. But rest assured my fellow stallions, the leading signal flares for the USD are the health of the CNY, JPY & EUR. The rest is just conversation.
As mentioned, the ensuing crash will be salvageable at a policy level, and thus not an inevitable depression, but only after the Bretton-Woods process comes to surface and settles, which could take most of 2026/27. This will be your golden crypto opportunity.
2.Opportunity DD
Unlike the last global financial crisis, cryptocurrencies and blockchain tech are now an available solution for short term cash access and long term platform use. They are already a wedge in the US economy. People will vote with their wallets to protect their purchasing power by moving into liquidity (cryptocurrencies). Thus the demand for respective nations/regions to produce their own national digital currency to offset will rise.
This isn't to say that physical coins (especially silver) won't be in a state of colossal demand (silver at 180 by 2029). But because most consumer and business transactions, debts, liabilities, taxes, etc still happen by digital bookkeeping, then cryptocurrencies (stablecoins in particular) will take priority until a national/international alternative is released. Which will come very quickly - likely by late summer of 2026. Crypto will remain bid as a trust arbitrage trade afterwards.
I am providing this ahead of time, because a gradual buy in is the safest and most reasonable way to leave a mark on the market.
TO OWN (in the interests of crypto):
1.PMs - physical ideally or by exposure to miners and mining ETFs. I have an 8,000$ price target for gold by 2029 (in 2025 dollars). I have 180$ price target for silver by 2029 (in 2025 dollars). Platinum = higher. I could go on and on about PMs. Decades ago I had a simple question: do prime mines sell gold and aggregates to government customers without reporting it? To answer that question, I am happy to report that I am still alive today. If you don't believe in internet magic money or virtual math money is too complicated, this asset is your first stop. It's a Golden Age. Take the hint. See KGC, GLD, GOLD & GDX.
2.Commodities - Lithium. Copper. Aggregates. Historically a great way to make money if you like buying Russian billionaires their yachts, creating nightmare company towns in central Africa, or funding "mining" companies that are fronts for the military industrial complex (MLM & MP = strong buy).
3.JVs - sophisticated only (which is a legal definition, not an aspiration). Not RE though (even utility related). All those watch-collecting power plant andy's on CNBC will make some money, but not as much as they think.
4.C-Word - WSB has the F-Word, Trump has the N-Word, and we have the C-Word. Again I'm preaching to the choir here, but it needs to be said anyway. As mentioned in the next section, there will be a valuation wild west period in which the shelf-stable stablecoins, other coins, and blockchain platforms will be used by developing countries and rich countries alike to fill in interoperability gaps and as a natural solution based on cost, availability, and immediacy for retail and small business needs. Only the most totalitarian countries, see Europe and China, will gatekeep over this. I strongly suggest buying and holding any digital currency currently settling it's legal hearings in the Southern District of New York. Or any digital coin holding company recently sued by the SEC (the Big Long will be the movie this time). And any that are based in the US via a foundation or corporation (IE, not BTC, which is owned and created by a British national), or start with letter X. Because {X} marks the spot, that's the DD.
It is not a coincidence or accident the very first crypto Trump mentioned for the national crypto reserve was XRP - a coin he likely had never even heard off until hours before making that tweet. There was no BTC or ETH mentioned until spaces like this hurt themselves in confusion. Why? Because BTC was created by a British national who also owns a commanding share. ETH does not have the business or banking relationships or the payment efficiency edge - and again, founder residency (Russian/Canadian) and controlling organization (Swiss) are foreign. The XRP Ledger is strategically useful and the leading contender for cross-border activity. Cardano is of interest (and in relationship) to banks and governments around the world for tokenizing assets under the redenomination era. Virtually every traditional financial asset will be tokenized for legal, tax, and accounting purposes. That includes home and car ownership. Solana is a further potential where speed and cost matter most. Finally, though unmentioned by the tweet, XLM already has a CBDC use-case track record and should be considered as well. What else do XRP, ADA, SOL, and XLM have in common? American founders, with USA-based organizations. This isn't about jingoism, this is about strategy.
You need to leave the history, anonymity, and grassroots community aspect behind for now. I agree that those attributes made crypto special in earlier eras, but it doesn't mean it will make you money in the redenomination era. It does not matter if your favorite Goonercoin has a better white paper or more airdrops. What matters is which coins are all-in on their chosen nations, and their efforts to generate relationships with banks, businesses, and governments associated with that respective nation. That is all that matters.
You can rinse and repeat with your own countries, but I would focus on these aforementioned first, and then exchange to your local equivalent later.
TO NOT OWN:
1.RE - will take the world's biggest beating when the EUR, USD, CNH, and JPY lose 30-40% of their value. The Reserve Recession event will be particularly painful for the elderly (pension+property) - thus adding to the pressure for CBDC solutions as a retirement welfare solution. In sum, the 30 year lending architecture will no longer exist. Many pensions will convert to digital currency systems. I wonder if that 401(k) inclusion recently has anything to do with this?
2.Sectors: all sectors except healthcare and industrials. Be wary of consumer staples and utilities, especially if you want to derisk your poorfolio from geopolitics.
3.Cash Accounts: don't be that guy who keeps 25k in his savings account. If you don't have a credit card, that's fine, but for everyone else, that money needs to be in physical assets, or intelligently invested. Remember, you aren't trading market volatility, you're hedging against monetary-systemic risk.
4.Other Currencies tied to the old monetary system - especially NIRPers. You could long the AUD/JPY, for instance, but don't own either via futures or ETFs (IE: FXE, FXY, etc - not even as a short).
5.Inflated Assets: in general, anything boosted by cost of money engineering (the modern monetary system function) will deflate. Lots of discretionary goods, luxury, travel, etc (Veblen goods).
Investor Note:
Do not expect cash to disappear. Those that engage in these cash crash predictions tend to be conspiratorial or hold prepper-mindsets. Those fear biases rarely align with reality. Besides a short ATM shock, cash will exist as usual during and alongside any monetary system transition, it will simply be a losing hedge. Ease of use redemption options at post offices and big banks will not be the only incentive for most people. Businesses and merchants will lead the way. As of this July, stablecoins are effectively legal in the US, when backed by the amorphously defined US Dollar (who's definition could change overnight with the right EO). This was a key green light to industry, giving them the option to navigate outside the conventional monetary architecture if need be - effectively defanging many potential capital controls for businesses. During the transition, businesses will quickly opt for the decentralized and reliable digital alternatives due to accountability, transparency, and availability - many options already exist to serve enterprises (unlike 07-08 monetary challenge), so this "free market" movement won't be entirely retail or consumer led. As mentioned before, don't be surprised if there is a prepared and proactive solution from the GSICs this time (unlike 08, which was reactive).
3.Outsider Information, Bessent, and the Golden Age:
To summarize, crypto on the 'TO OWN' list will platform and support the CBDCs to come. Those free-market coins will present massive investment opportunities for several years to come. Eventually, you can and many of you will likely have to convert them to the digital winners of tomorrow, which will all be CBDCs. And yes, the US will eventually have a state-backed digital currency under the treasury via the redenomination process. It won't be called a CBDC because it won't be backed by a central bank, but a consortium of banks under the US Treasury, who's reserves will be required (gold) at far higher ratios than many CBs (2-3x current), but still held at the US Treasury. Will it be a golden dollar to serve the so-called Golden Age? Before he became president, Trump had a long record of statements and publicized deals that supported gold as an investment, in settlement, and as a part of a monetary system. If investors studied his ramblings the same way they study Powell's statements, they would see this. Either way, there will be an American CBDC at minimum, even if it's wrapped in golden foil and comes with QR codes on red hats.
The Secretary of Fake Teeth knows this, and he and his foreign country comparables have planned for it. With all due respect to him, he was part of an all-star team of FX traders, the best of the best. They understand what makes or breaks nations from a currency standpoint and they have a track record of macro mania to prove it. He was the analytics mastermind behind Black Wednesday (NOT Druckenmiller or Soros). He's literally the currency guy (though gold was almost always his biggest position), and now in command of the top currency and the entire mirage of the modern monetary infrastructure as soon as Powell is out. He's the one who pitched the idea of a shadow Fed Chair. I don't know if he'll get that, but I do know he will get the next best thing: being remembered as the trader that successfully margin called the Federal Reserve. That's why he was chosen, he's going to oversee the biggest currency revolution in modern history.
Simply put, over 88% of global GDP will be functional within a CBDC currency architecture according to the Atlantic Council's CBDC tracker, BIS industry research, and my own review - likely by the Q2 2026. That's a lot of imminent coverage for a reserve currency system replacement that wouldn't be needed for 20-40 years, according to modern economists (TL: wagies). Is it possible the people who facilitate cross-border cash flows in the billions know something consumers don't about the near-future status of our dollar reserve system? Or a matter of curiosity that a tracker like this is hosted on the preeminent US/EU think tank? Instead of, for instance, ronpaulgold.com-?
The transition between the known reserve and liquidity system (USD dominance) to the upcoming digital cash systems of many qualities and styles (programmable currency playground) will constitute the largest global valuation crisis window ever. Even if, at first, only the M3 or M2 is replaced or two-tracked (in the USA). Even if they use some kind of national AI to help balance the exchange markets and oversee a new lending and credit model (spoiler: that's coming). Maybe it will be great in your country, maybe not. Ultimately, it's not a depression or a problem, not if you're prepared for it. That's my recommendation - to be prepared for an unexpected currency swap on a national or international scale unlike anything crapitalism has ever seen before. Upside to any downside: you make enough money and its hard to be depressed. Yes, there will be inflation, and everything will appear to fall (rise for room temp IQs) as the fiat cost of money paradigm goes offline and confusion around the redemption under redenomination structure is common for general consumers. But in purchasing power, certain commodities and cryptos will crab market instead of play dead for great vol plays, and in some cases, represent the last great financial investment opportunities. They are on the functionality shelf that some solution-makers will draw from, so rumor over their potential incorporation will drive tremendous spikes that will mint more millionaires from the lower classes than any other time in history. Some of you reading this will be in that cohort, I guarantee it.
There is much more to be said about CBDCs, credit systems & lending, taxation changes, debt forgiveness, UBI/prebates, SWFs, and such - as all will fold into a new paradigm under programmable currency. It warrants another giant reddit thread that few will read, but you should have the right to know what neo-feudalists are planning with your money systems. From the Vineyard to the Hamptons to Jupiter Island, the dumb rich has become the dumb majority. Many of them will find out just how dumb the hard way.
Wouldn't it be nice to know ahead of time? To not be caught off guard for once? The cypherpunks designed crypto for a scenario like this. It's the failsafe for when fiat inevitably fails. You may very well be able to hold most of your liquid wealth in cryptocurrencies over CBDCs. Maybe it depends on the year of adoption, or maybe your countries policies. But doing nothing is the only bad option, and its the choice most will make.
Why take the flat risk of a programmable purgatory of software patches, invasive KYC, geofenced value, and conditionalized capital controls? Some of these CBDC solutions will not be sound, depending on your country. It's entirely possible they all lean authoritarian in implementation or inefficient and deflationary in practice. Don't comply without question. Thinking is still free. I'll give the same advice I'd give anyone in any era in any place on Earth: sound money = sound mind.
I started retail trading before most of you were born, back when Metatrader was an advanced piece of software and worked with an IP from the isle of Dominica. I understand the appeal. Doing your own research, "working" your own hours, drawing an income from anywhere in the world. Of only being responsible for your own wins or your own loses. You had the choice between life as a broke serf or a broke merchant, and you chose the latter. Historically speaking, some of you made a smart bet. Lifelong wagies will never know what a privilege this has been. Win or lose, you took your own risks - you set fear aside to try your hand at making a fortune. There's a big trillion dollar bank account floating around out there and you only need to press the right buttons to withdraw as much as you like. That's the trading market. How cool is that? It's the pirate's life and I sincerely hope it continues. I don't want to log on to this board 10 months from now and see one big cleanup on aisle 9. That's why I'm here to do the needful for free.
Thank you for reading my ZH parody.
See you on the margins.

BTCUSD Short: Dump Of Supply ZoneHello, traders! The price auction for BTC has been operating within a large ascending channel, a structure defined by key pivot points that have established the 109500 demand area as support and the 113200 supply area as resistance. This bullish framework has guided the price through a series of higher highs and higher lows, confirming the buyer's initiative and the strength of the current uptrend.
Currently, the auction is at a critical inflection point at the top of this channel. The price has rallied to directly test the channel's ascending supply line, which forms a confluence of resistance with the horizontal 113200 - 113600 supply zone. This is a key area where sellers are expected to become active and challenge the prevailing bullish momentum.
The primary scenario anticipates a corrective move from these highs. The expectation is that sellers will defend the supply zone and reject the price, initiating a downward rotation back towards the channel's support line. A failure to break out higher would confirm a short-term correction is underway. The take-profit for this rotational play is therefore set at 110100 points, targeting a key liquidity area above the primary demand zone. Manage your risk!

Euro will rebound from seller zone and then start to fallHello traders, I want share with you my opinion about Euro. The price action for the Euro has been methodically developing within the confines of a large upward channel for several weeks, creating a clear structure of higher highs and higher lows. This pattern has been anchored by the major buyer zone near the 1.1580 support level and capped by a dynamic resistance line. The market has just completed a full upward rotation within this structure and is now at a critical inflection point. Currently, the price of EUR is directly testing the upper boundary of the channel, which forms a powerful confluence of resistance with the horizontal seller zone located at the 1.1720 - 1.1740 area. The primary working hypothesis is a short, rotational scenario, based on the expectation that sellers will successfully defend this significant resistance confluence. A confirmed rejection from this seller zone would validate the integrity of the upward channel and likely initiate a new corrective swing to the downside. This move would first need to break the current support Level at 1.1720. Therefore, the TP for this scenario is logically placed at 1.16150, a target that aligns perfectly with the ascending support line of the channel and represents the most probable objective for this bearish rotation. Please share this idea with your friends and click Boost 🚀

AUDUSD LONG NEXT WEEK! |OSOK|Hello friends, this is Joe_Blaq here and I thank you for reading this bit about fundamental analysis + technical analysis.
FUNDAMENTAL ANALYSIS
AUD currently experiences an economic boost since the GDP came out positive last month, USD on the other hand experiencing a decline in their GDP as inflation surges high and interest rate too high, leaving manufactures not option than to raise prices of their goods. This has also caused companies to lay-off their workers as their they can't borrow money because of high intrest rate.
So if we are applying the principle of buying the rumour and selling the fact then we should be buying AUD and sell USD since it is anticipated that the FED is going to cut rate to stabilize the economy next 2 weeks.
TECHNICAL ANALYSIS
AUDUSD bounced of a monthly support level at 0.61350 signaling a move to take out the high at 0.69500.
On the weekly price has developed a bullish market structure . With this weekly outlook I am anticipating next week to continue the longs with a little contraction/accumulation on monday and tuesday and expansion during wednesday to friday as the inflation news are released.
Thanks for you attention.

Gold will continue to grow inside upward channelHello traders, I want share with you my opinion about Gold. The market context for Gold has been firmly bullish since the price broke out of its prior consolidation range, a move that originated from the deep buyer zone. This breakout shifted the market structure, initiating a new impulsive phase that has since been neatly contained within a well-defined upward channel. The price action for XAU has been respecting the boundaries of this channel, creating a clear sequence of higher highs and higher lows. Currently, after being rejected from the channel's upper resistance line, the asset is undergoing a healthy correction movement. This pull-back is guiding the price back towards a significant confluence of support, where the ascending support line of the channel converges with the horizontal support zone near the 3485 current support level. The primary working hypothesis is a long scenario, based on the expectation that buyers will defend this area and maintain the integrity of the uptrend. A confirmed bounce from this dynamic support would signal the end of the correction and the resumption of the primary bullish trend. Therefore, the TP is logically placed at 3610 points, representing a new structural high and a measured objective for the next impulsive wave. Please share this idea with your friends and click Boost 🚀

BTCUSDi am looking for 1 sharpe retest and quick short on btcusd, as on major higher and high 3 major attempt on weekly time frame. simple draw line you may understand the reason as trend line has a huge gap beetween market that gap considerd to be filed up... if btc continued go high by end of this year. let me know your opinion in the comment. trade with confirmation only.

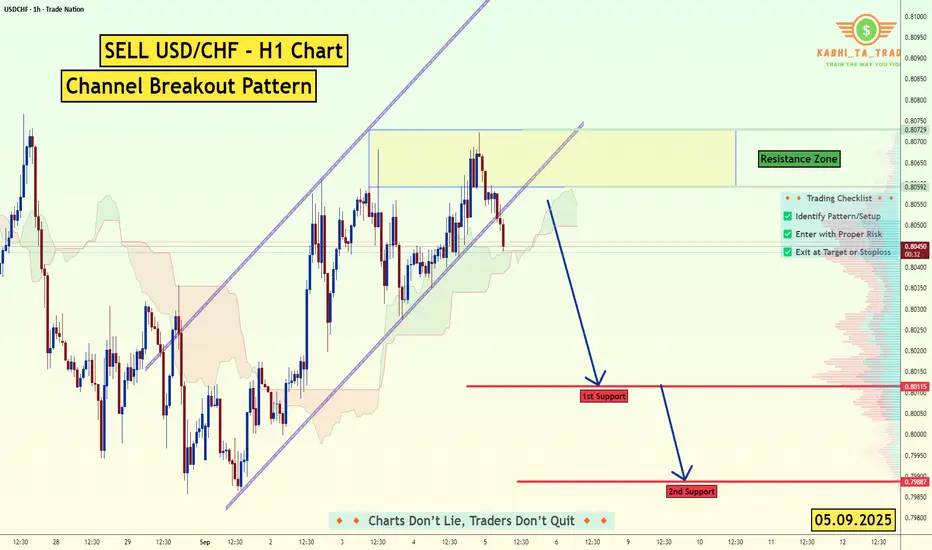
USD/CHF - H1 - Channel Breakout (NFP) (05.09.2025)The USD/CHF Pair on the H1 timeframe presents a Potential Selling Opportunity due to a recent Formation of a Channel Breakout Pattern. This suggests a shift in momentum towards the downside in the coming hours.
Possible Short Trade:
Entry: Consider Entering A Short Position around Trendline Of The Pattern.
Target Levels:
1st Support – 0.8011
2nd Support – 0.7988
🎁 Please hit the like button and
🎁 Leave a comment to support for My Post !
Your likes and comments are incredibly motivating and will encourage me to share more analysis with you.
Best Regards, KABHI_TA_TRADING
Thank you.
Disclosure: I am part of Trade Nation's Influencer program and receive a monthly fee for using their TradingView charts in my analysis.
The world gold price increase shows signs of slowing downThe global gold price rally has shown signs of slowing as short-term futures traders booked profits after gold hit an all-time high and silver hit a 14-year high on Wednesday.
“We are seeing some profit-taking, but gold remains in an uptrend. Expectations of interest rate cuts and concerns about the independence of the US Federal Reserve (FED) will continue to boost safe-haven demand,” said Brian Lan, director of GoldSilver Central.
While gold has yet to hit that target, analysts said they are taking profits on concerns about upcoming news risks. The bank also noted that market volatility related to global trade issues has cooled, and long positions are showing signs of “condensing” again, which could limit the upside in the short term.

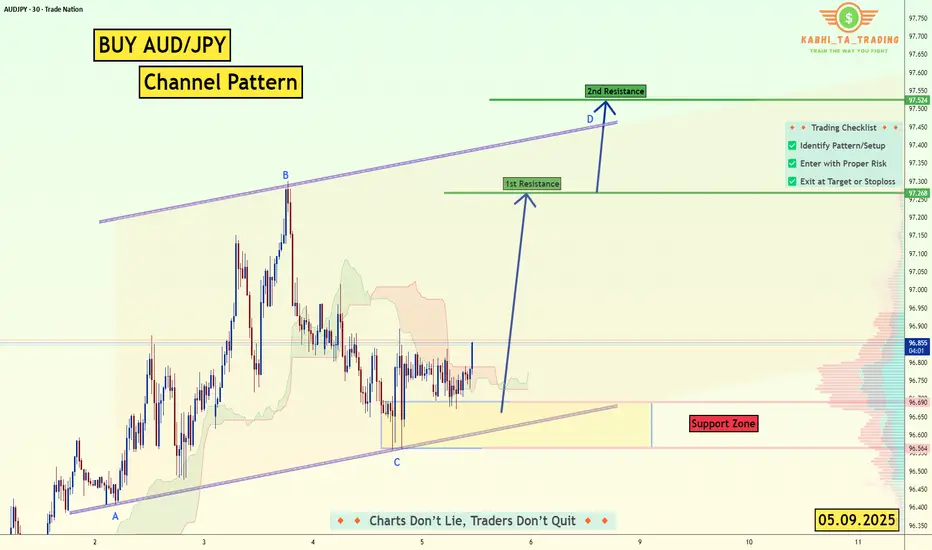
AUD/JPY - Channel Pattern (05.09.2025) The AUD/JPY pair on the M30 timeframe presents a Potential Buying Opportunity due to a recent Formation of a Channel Pattern. This suggests a shift in momentum towards the upside and a higher likelihood of further advances in the coming hours.
Possible Long Trade:
Entry: Consider Entering A Long Position around Trendline Of The Pattern.
Target Levels:
1st Resistance – 97.26
2nd Resistance – 97.52
🎁 Please hit the like button and
🎁 Leave a comment to support for My Post !
Your likes and comments are incredibly motivating and will encourage me to share more analysis with you.
Best Regards, KABHI_TA_TRADING
Thank you.
Disclosure: I am part of Trade Nation's Influencer program and receive a monthly fee for using their TradingView charts in my analysis.
This week’s main event: Non-Farm Payrolls – Friday at 15:30!This Friday, September 5, 2025 at 15:30 EET , the U.S. Department of Labor will release one of the most anticipated macroeconomic reports — the Non-Farm Payrolls (NFP) . This release could confirm whether hopes for a near-term Fed policy shift are justified — the very hopes that helped U.S. equities climb to historic highs in late August. Markets see this report as a checkpoint for both the ongoing rally and rate expectations.
NFP and the markets: 3 possible scenarios
Strong report: If job creation exceeds expectations, unemployment falls, and wages accelerate — markets may believe the Fed will stay cautious on cutting rates. Typically, this boosts the dollar and bond yields, while growth stocks and tech underperform. More traditional sectors like banking, industry, and energy tend to hold up better. Gold and crypto often dip under pressure from a stronger USD and rising yields.
Weak report: If job gains disappoint, unemployment rises, and wage growth slows — this strengthens the case for a faster Fed pivot. In this case, the dollar usually softens, yields fall, and growth stocks, gold, and major crypto (BTC/ETH) gain on expectations of lower rates.
Neutral report: If numbers align closely with forecasts and there’s no big surprise, markets may remain range-bound. Initial reactions fade quickly, and focus shifts to the details — such as wage data and revisions to past reports. Price action often becomes choppy and short-lived until the next key catalyst.
The September 5 NFP release is a crossroads moment before the Fed’s September 16–17 meeting. Volatility is almost guaranteed, and the market’s reaction will depend on the combination of headline jobs number, unemployment rate, wage growth, and revisions. According to FreshForex , this setup offers tactical trade setups across forex, metals, and crypto pairs.

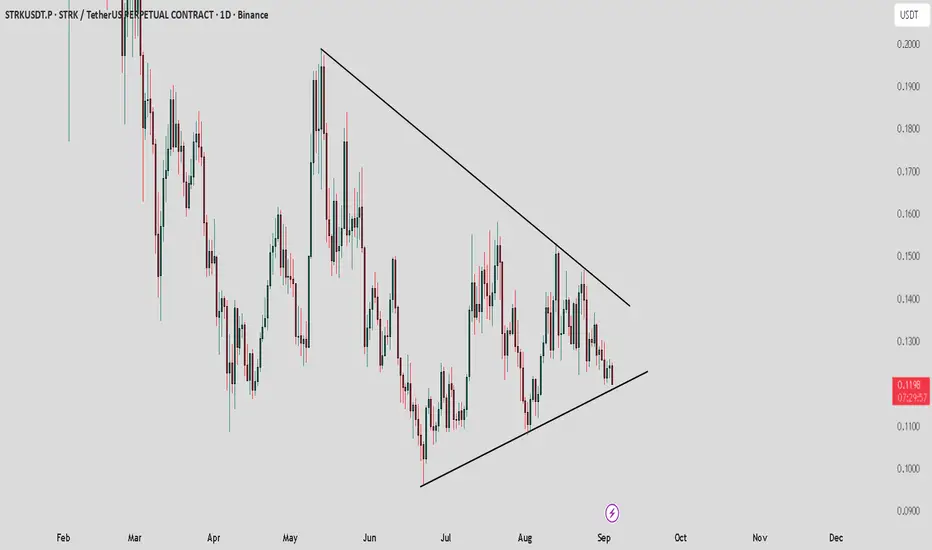
STRK / USDT : Near to support of symmetrical triangleSTRK/USDT is trading near the support of the symmetrical triangle.
Bullish scenario: If support holds, price could bounce toward the resistance at $0.13.
Bearish scenario: A breakdown from this support may drag price toward $0.096.
Always wait for confirmation before entering. Manage risk properly and trade according to market conditions.
USD/CAD - Bullish Pennant (04.09.2025)The USD/CAD pair on the M30 timeframe presents a Potential Buying Opportunity due to a recent Formation of a Bullish Pennant Breakout Pattern. This suggests a shift in momentum towards the upside and a higher likelihood of further advances in the coming hours.
Possible Long Trade:
Entry: Consider Entering A Long Position around Trendline Of The Pattern.
Target Levels:
1st Resistance – 1.3835
2nd Resistance – 1.3853
🎁 Please hit the like button and
🎁 Leave a comment to support for My Post !
Your likes and comments are incredibly motivating and will encourage me to share more analysis with you.
Best Regards, KABHI_TA_TRADING
Thank you.
Disclosure: I am part of Trade Nation's Influencer program and receive a monthly fee for using their TradingView charts in my analysis.

XAUUSD Long: Upward Trend ContinuesHello, traders! The prior market structure for XAUUSD was dominated by a large consolidation wedge pattern. This period of balance was resolved with a decisive bullish breakout, which was subsequently confirmed by a retest of the 3440 demand zone. This successful test of former resistance as new support confirmed a structural shift in control to the buyers and initiated the current bullish phase.
Currently, the price has entered an acceleration phase. Following the breakout, a strong, impulsive rally has developed, which is now being guided by a steep ascending trend line. This indicates that the bullish initiative is in full control and the market is in a clear expansion phase, having left the prior consolidation area behind.
The primary scenario anticipates a continuation of this bullish momentum. Any minor corrective pullback towards the ascending trend line is expected to be met with renewed buying pressure, providing an opportunity to join the trend. A successful hold of this dynamic support would be the trigger for the next leg higher. The take-profit for this trend continuation is therefore set at 3600 points. Manage your risk!

Fundamental Market Analysis for September 04, 2025 GBPUSDOn Thursday, during the Asian trading session, the GBP/USD pair fell to around 1.3430. The pound sterling (GBP) is weakening against the US dollar (USD) amid concerns about the UK's financial situation.
UK Finance Minister Rachel Reeves said on Wednesday that she would present the annual budget on November 26, insisting that the economy is not “broken” and that she would control spending to help reduce inflation and borrowing costs. However, concerns about the UK's ability to control its finances are weighing on sentiment and dragging the pound down against the US dollar.
According to the US Bureau of Labor Statistics (BLS), the number of job openings on the last working day of July was 7.181 million. This figure followed 7.357 million (revised from 7.437 million) job openings recorded in June and was below the market consensus of 7.4 million.
The weakening of the UK labor market, announced on Wednesday, reinforced expectations that the Federal Reserve (Fed) will cut rates this month. This, in turn, could undermine the dollar and help limit losses for the major currency pair.
Trading recommendation: SELL 1.3400, SL 1.3450, TP 1.3300

EURJPY: FakeoutEURJPY is currently undergoing an interesting transition. While the EMAs indicate that this pair is in an uptrend (where EMA20 is above EMA60), there's early indication that we might be seeing a downtrend soon.
Daily Timeframe:
Price attempted to cross above the daily level, but it failed to close above it. It's also a lower high after a strong run-up, which indicates to me that the upside momentum might be exhausting.
H1 Timeframe:
We see an intraday double top formation, which indicates that price is having a hard time pushing higher. Price also crossed below the intraday neckline.
While it tried to pull back above the intraday neckline, it quickly reverted below, indicating quite a bit of selling pressure.

#ARBITRUM #ARBUSDT #LONG #Eddy#ARBITRUM #ARBUSDT #LONG #Eddy
ARBUSDT.P SWING Long Setup
Important areas of the upper time frame for swing are identified and named.
This setup is based on a combination of different styles, including the volume style with the ict style.
Based on your strategy and style, get the necessary confirmations for this Swing Setup to enter the trade.
Don't forget risk and capital management.
The entry point, take profit point, and stop loss point are indicated on the chart along with their amounts.
The responsibility for the transaction is yours and I have no responsibility for not observing your risk and capital management.
By scratching the price and time bar, you can see the big picture of targets.
Buy Position "LONG" Spot & Future Details :
Entry : 0.4900
Stop : 0.4665 (( 4.80% )) "You can enter with a small stop by getting approval."
Target 1 : 0.5145 "5%"
Target 2 : 0.5390 "10%"
Target 3 : 0.5635 "15%"
Target 4 : 0.5880 "20%"
Target 5 : 0.6125 "25%"
Target 6 : 0.6370 "30%"
Be successful and profitable.

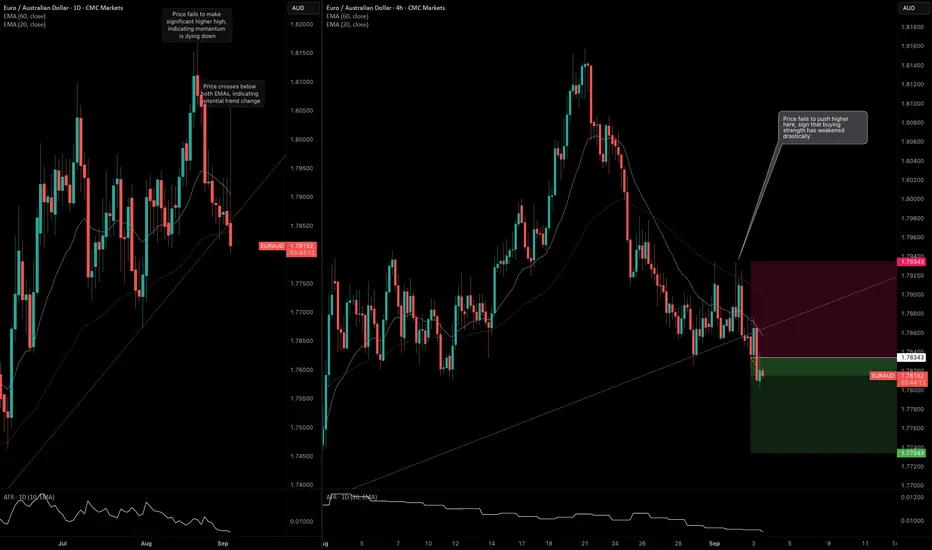
EURAUD: Ascending Trendline BreakThis is a counter-trend trade as I see exhaustion on the daily timeframe.
Daily Timeframe:
I plotted an ascending trendline on the daily timeframe. Price attempted to push to a new high on August 20th, but failed to hold. That was the first indication that the uptrend might be over.
The signal occurred when price crossed below the ascending trendline. Currently, the daily bar is active. If the current bar manages to close below the ascending trendline and tomorrow's daily bar does the same, it's safe to say that we can expect further downside.
H4 Timeframe
The bearish signal is also supported on the 4-hour timeframe. In the intraday timeframe, price made a "double top" indicating that it's not able to push higher to the upside. I'm anticipating that momentum will build up throughout the rest of the day and into tomorrow as well.
Fundamental Market Analysis for September 03, 2025 EURUSDThe euro remains under pressure as demand for the US dollar as a “safe haven” rises amid higher long-end Treasury yields and a broader risk-off tone. Today during Asian trading, the pair fluctuates around 1.16300–1.16500. Dollar inflows are supported by concerns over fiscal sustainability in advanced economies and a steeper US yield curve, which dampen risk appetite and reduce demand for the euro.
From a fundamental standpoint the setup is mixed: markets still price a chance of a Fed rate cut in September, yet the actual backdrop—firmer long-dated yields and cautious commentary on the US cycle—keeps the dollar supported. In the euro area, attention stays on inflation and signs of cooling domestic demand: soft PMI components and CPI expectations limit upside for the euro, while the differential in real rates continues to favor the USD.
Near-term drivers include the incoming US macro flow on employment (including advance gauges and Friday’s labor data) as well as fresh inflation pointers from the eurozone. Against this backdrop, the fundamental balance still tilts in favor of the dollar, keeping downside break risks elevated for EURUSD in case US releases surprise to the upside.
Trading recommendation: SELL 1.16300, SL 1.16800, TP 1.15800
