Zydus Lifesciences: Premium Valuation, Solid OutlookZydus Lifesciences Ltd. (NSE: ZYDUSLIFE), one of India’s most respected pharmaceutical giants, is at a crucial juncture where technical breakout signals align with solid fundamental strength. Let’s dive deeper into its techno-fundamental outlook.
🔹 Fundamental Snapshot
CMP (25 Aug 2025): ₹1,023
Market Cap: ~₹1 lakh crore
P/E Ratio: ~22.4 (slightly above historical average of ~21.6)
P/B Ratio: ~4.2–4.7
Dividend Yield: ~1.1%
ROE / ROCE: 21.2% / 24.3%
Debt-to-Equity: 0.13 (low leverage)
Current Ratio: 1.9 (healthy liquidity)
EPS (TTM): ~₹45.4
Growth Metrics:
Revenue CAGR (5Y): ~10%
Profit CAGR (5Y): ~26%
Profit CAGR (3Y): ~2% (showing a slowdown recently)
Valuation Insight:
Intrinsic value estimates range from ₹748–₹814, implying the stock trades 25–27% above fair value.
👉 Fundamentally, Zydus is financially strong and consistently profitable, but valuation is on the premium side.
🔹 Technical Analysis
The daily chart (shown above) highlights a large Inverse Head & Shoulders (H&S) formation, typically a bullish reversal pattern.
Left Shoulder: Nov 2024
Head: Apr 2025 (major bottom around ₹800.5)
Right Shoulder: Aug 2025
Neckline Breakout: Around ₹1,000–1,010
Key Levels
Reversal Zone (Support): ₹977–₹993
Immediate Resistance (R1): ₹1,100
Next Resistance (R2): ₹1,150
Major Resistance (R3): ₹1,240
📈 Technical Outlook:
The breakout above the neckline suggests momentum towards ₹1,100–₹1,150 in the short term, with the potential to test ₹1,240 in the medium term if volumes support it.
🔹 Techno-Fundamental View
Valuation: Trading at a premium, about 25% above intrinsic value, though supported by a strong balance sheet and product pipeline.
Profitability: ROE and ROCE remain strong, both above 20%.
Balance Sheet: Very low debt and solid liquidity provide financial strength.
Growth: Long-term CAGR is healthy, but recent three-year profit growth has slowed.
Technical Setup: Inverse Head & Shoulders breakout signals bullish momentum.
Upside Targets: ₹1,100 → ₹1,150 → ₹1,240.
Risk Zone: A breakdown below ₹977 would invalidate the bullish pattern.
🔹 Conclusion
Zydus Lifesciences presents a compelling techno-fundamental story:
Fundamentally strong with robust financial ratios, prudent balance sheet, and a global growth strategy.
Technically bullish, as the inverse Head & Shoulders suggests a strong reversal with clear upside targets.
However, with the stock trading above intrinsic value estimates, new investors should approach with caution—preferably on dips near the ₹977–₹993 support zone. For existing investors, this breakout could unlock the next leg towards ₹1,150–₹1,240.
Analysis

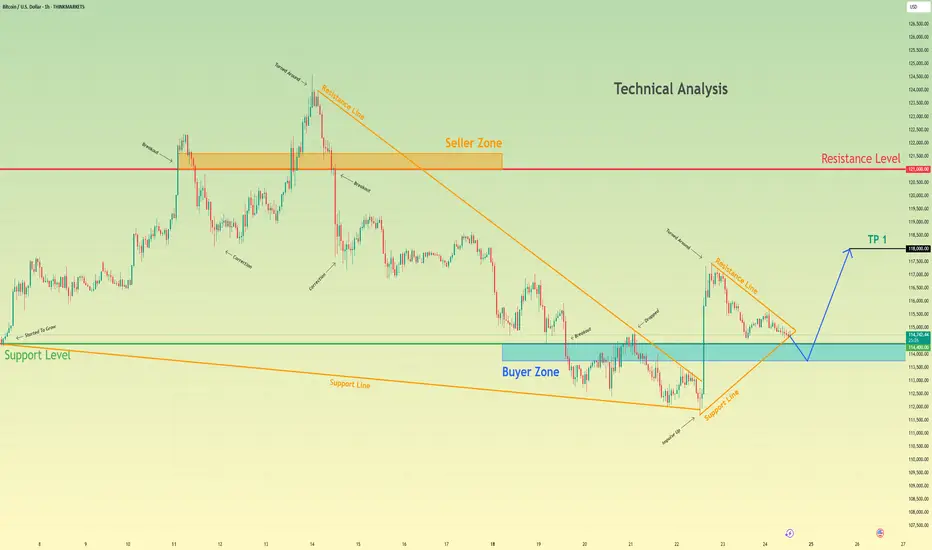
Bitcoin will exit of triangle and then bounce up from buyer zoneHello traders, I want share with you my opinion about Bitcoin. Following a decisive breakout from a prior downward wedge, Bitcoin entered a phase of balance and consolidation that is currently forming a symmetrical triangle. This new market environment signifies contracting volatility, with the price being methodically squeezed between a descending resistance line and an ascending support line. The asset has reached a critical juncture, as it is now at the apex of this formation, where the ascending support line converges with a strong horizontal support level at 114400. The primary working hypothesis is a long scenario, based on the expectation of a 'fake breakdown' or 'liquidity hunt'. It is anticipated that the price may briefly dip below the support line and into the buyer zone to trigger stops before staging a strong reversal. A swift reclaim of the 114400 level would be the ultimate confirmation of this bullish thesis, validating the original uptrend. This reversal is then expected to trigger a significant upward rebound. Therefore, the TP is logically placed at the 118000 level, as this represents a key area of prior price interaction and serves as a prudent first objective for a rally of this nature. Please share this idea with your friends and click Boost 🚀
Disclaimer: As part of ThinkMarkets’ Influencer Program, I am sponsored to share and publish their charts in my analysis.
EURCHF SELL SETUP SIGNAL Hello everyone, if we focus on the chart, we will see a possible head and shoulders formation, and we will also see a bullish flag indicating a decline. We also have a consolidation area at the top that was broken downwards to continue the decline, in addition to the German GDP (Sabe), which indicates a decline in the Eurozone, especially the selfish economy, the strongest economy in the Eurozone, which supports our analysis.

Fundamental Market Analysis for August 25, 2025 USDJPYFollowing dovish-leaning Fed rhetoric, demand for the dollar has eased and U.S. yields have retreated, reducing support for USDJPY. The pair has pulled back from recent highs as markets price a September Fed cut, narrowing the U.S.–Japan yield spread and making long USD positions against the yen less compelling.
Japan’s recent macro data in August has been more resilient than expected, and the Bank of Japan continues a cautious normalization with an emphasis on wages and sustained inflation at target. Against this backdrop, a modest domestic impulse in Japan and lower U.S. yields support the yen. Another factor is the market’s sensitivity to potential verbal interventions from Japan’s Ministry of Finance if the yen were to weaken again.
Near-term, risks for USDJPY are skewed lower: a softer Fed, steadier Japanese data, and the authorities’ intervention risk management create a fundamental case for the pair to decline. Barring a renewed jump in U.S. yields, the probability of further yen strength remains elevated.
Trading recommendation: SELL 147.250, SL 147.950, TP 146.500

EUR/USD Long Setup: Riding the Wave After Powell’s Dovish TalkEUR/USD Long Opportunity Post-Powell Speech
Following Jerome Powell’s dovish remarks at the 2025 Jackson Hole Symposium, the EUR/USD is showing strong bullish potential. With the pair currently trading at 1.16626, I’m looking to enter buy positions targeting a move up to 1.18295. Key Points: Trade Direction: Strictly bullish. I see no reason to sell given the USD weakness post-Powell.
Entry Zone: Buying opportunities around 1.16626 or on a confirmed breakout above 1.1700.
Target: Aiming for 1.18295 (key resistance level).
Stop Loss: Place below 1.1597 to manage risk.
Market Context: The dovish Fed outlook supports EUR/USD upside, making this an ideal week for capturing momentum and passing prop firm trading challenges.
Risk Management: Use 1-2% position sizing to navigate volatility and ensure a favorable risk-reward ratio (targeting at least 2:1).
This setup offers a high-probability trade for swing traders and those aiming to pass funding challenges this week. Stay disciplined and monitor price action around key levels. Disclaimer: Trading involves risk. Always conduct your own analysis and consult a financial advisor.

XAUUSD Short: Sellers to Maintain Control at 3380 SupplyHello, traders! The macro structure for the XAU price auction has been defined by two critical pivot points, establishing a wide and volatile consolidation range. A major pivot point high was formed at the 3390 supply zone, while a subsequent pivot point low anchored the market at the 3300 demand zone. All price action since has occurred between these two dominant control zones, transitioning the market into a state of balance.
Currently, the price action is contracting within a large symmetrical triangle, signaling a compression of volatility. The auction is now at a critical inflection point, as it is directly testing the upper boundary of this formation. This area represents a powerful confluence of resistance, where the descending supply line and the horizontal 3380 - 3390 supply zone intersect, providing a key battleground for market participants.
The working hypothesis is a short scenario, predicated on sellers successfully defending this resistance confluence. It is anticipated that the price will make a final push into the supply zone before being rejected. A confirmed failure to break higher would validate the triangle's integrity and initiate a full rotation to the downside. The take-profit is therefore set at 3330, targeting the high-liquidity area where the ascending demand line converges with the horizontal demand zone. Manage your risk!

XAUUSD Daily AnalysisWe expect correction to highlighted support levels.
based on ichimoku 3166.5 is an important one.
after reaction to these levels, analysis will be updated.

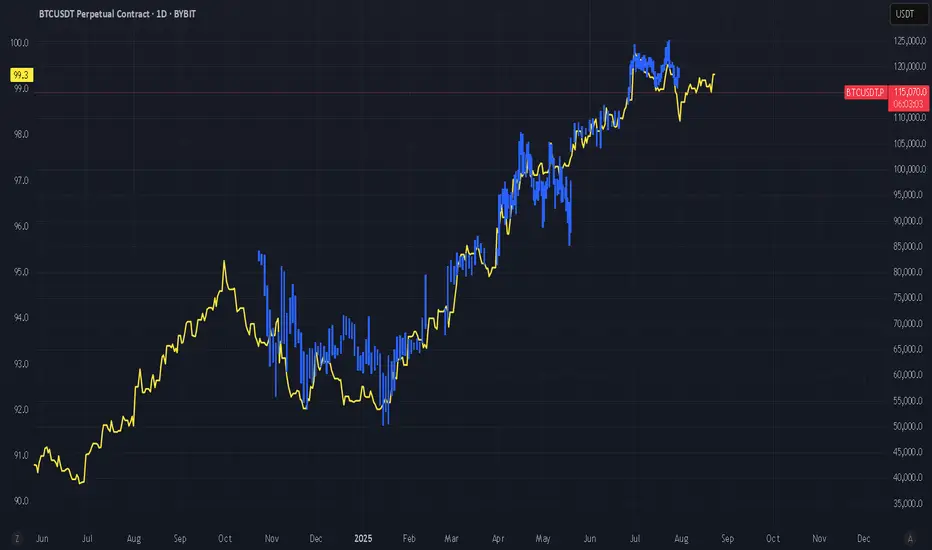
Is a Bitcoin correction still on the horizon?The chart below compares BTC price (blue) and US M2 money supply (yellow). Historically, Bitcoin’s movements have closely tracked changes in US money supply, often with a few months’ lag. With current trends suggesting a potential divergence, a market correction could still be on the table.
Curious to hear your thoughts, where do you see Bitcoin heading next?
#crypto #bitcoin #btc #trading #analysis
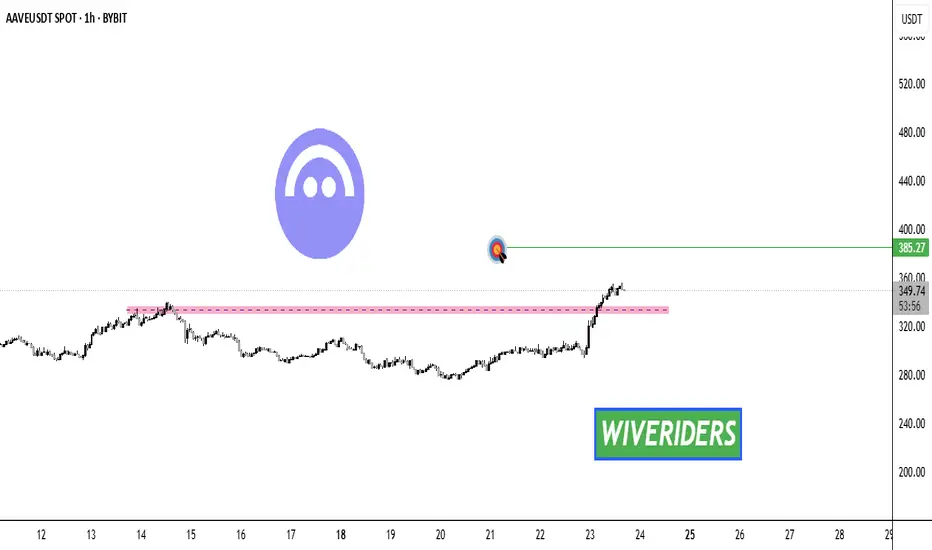
AAVE Breakout Alert! 🚨 CRYPTOCAP:AAVE Breakout Alert! 🚨
CRYPTOCAP:AAVE has broken out of the red resistance zone 🔴✅
The first target is the green line level 🎯
This breakout confirms bullish momentum and could drive further upside if buyers maintain control 💪
XAUUSD Long Thesis: Triangle Support Bounce to Target 3380Hello, traders! The recent history of the XAUUSD price auction has been defined by the establishment of two major pivot points, which have set the boundaries for the current market structure. A significant pivot point low was formed near the 3300 demand zone, which initiated a rally that was subsequently capped by a pivot point high at the 3390 supply zone. This sequence has transitioned the market from a directional phase into a period of balance and consolidation.
Currently, XAU is consolidating within a large symmetrical triangle, a pattern signifying equilibrium and contracting volatility. The price is being methodically squeezed between a descending supply line and an ascending demand line, indicating that energy is building for a significant move. The market is now in a corrective pullback, heading towards the ascending demand line for what is expected to be a critical test of buyers' resolve in this structure.
The working hypothesis is a long scenario based on a successful defense of the triangle's lower boundary. It is anticipated that the price will complete its corrective dip and test the ascending demand line, which originates from the 3315 demand zone. A confirmed bounce from this dynamic line would validate the pattern's integrity and trigger an upward rotation. The take-profit is therefore set at 3380. Manage your risk!

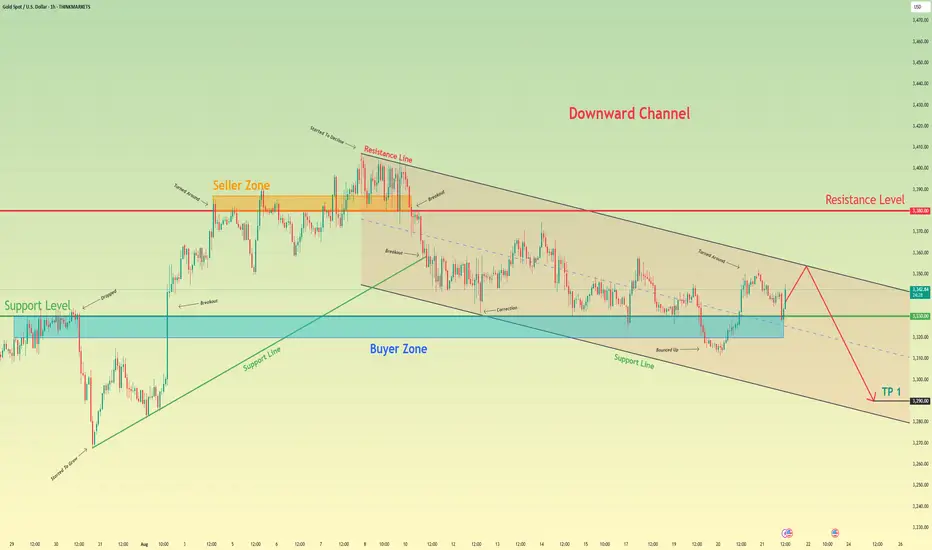
Gold can continue to decline inside downward channelHello traders, I want share with you my opinion about Gold. The price action for Gold has been dictated by a large downward channel since the last major peak was established at the 3380 resistance level. This bearish structure has effectively contained the market, guiding it through a series of impulsive declines and corrective rebounds between its well-defined support and resistance lines. After the most recent upward rebound originated from the lower boundary of the channel, the price has been in a corrective rally, now approaching a formidable confluence of resistance. This critical area is formed by the intersection of the channel's descending resistance line and the major horizontal seller zone around 3380. The primary working hypothesis is a short scenario, which is based on the expectation that this powerful resistance will hold and cause the current corrective rally to fail. A confirmed rejection from this zone would validate the integrity of the downward channel and signal that the dominant bearish trend is set to resume. This would likely trigger the next major impulsive fall, which is expected to break through the immediate support level at 3330. Therefore, the TP for this continuation scenario is logically placed at the 3290 level, a target that represents a new lower low within the channel's structure and a prudent objective for the anticipated move. Please share this idea with your friends and click Boost 🚀
Disclaimer: As part of ThinkMarkets’ Influencer Program, I am sponsored to share and publish their charts in my analysis.
DHI: Fundamental Analysis +45%With 2024 revenue of $ 36.80 billions, D. R. Horton is an american homebuilding company. EverStock identifies a fundamental revaluation potential of + 45 %.
Valuation at 10.1 x net earnings :
Currently valued at $ 48.26 millions in market capitalization, D. R. Horton posted a profit of $ 4.76 billions in its latest fiscal year (2024).
Balance sheet and debt :
In the company annual report, tangible net asset value stood at $ 25.15 billions, giving a market capitalization / tangible net asset value ratio of 1.92.
The gearing ratio is good, at 0.24. (Total financial debt / net tangible assets valuation).
Current share price: 161.87 $
Target price : 235.36 $
Upside potential : + 45 % (including dividende income)
Dividend : 1.60 $ (0.40 $ per quarter)
Yield : 0.99 %

Fundamental Market Analysis for August 22, 2025 GBPUSDSterling is under pressure as the dollar stays resilient on expectations of cautious Fed messaging at Jackson Hole. Stronger components in recent U.S. business surveys tempered hopes for aggressive easing, while U.S. Treasury yields held above recent lows—typically a headwind for lower-yielding currencies such as GBP. The market continues to prefer U.S. domestic assets until Powell’s stance becomes clearer.
The U.K. backdrop offers limited offset: signs of softer domestic demand and a cooling labor market raise doubts about the economy’s ability to shoulder restrictive rates. Attention today also falls on government debt auctions and European business activity prints, which can indirectly affect risk sentiment and cable through broader capital flows.
With these forces intersecting, GBPUSD retains a bearish bias within today’s “stronger-dollar” narrative: yield differentials, guarded Fed expectations, and the pound’s sensitivity to global risk keep upside contained. Unless an upside surprise emerges from U.K. data or a distinctly dovish signal from the Fed, selling rallies with moderate targets remains a prudent tactical stance.
Trade recommendation: SELL 1.34000, SL 1.34500, TP 1.33100

GBP/JPY - Breakout (22.08.2025)The GBP/JPY TRADENATION:GBPJPY pair on the M30 timeframe presents a Potential Buying Opportunity due to a recent Formation of a Breakout Pattern. This suggests a shift in momentum towards the upside and a higher likelihood of further advances in the coming hours.
Possible Long Trade:
Entry: Consider Entering A Long Position around Trendline Of The Pattern.
Target Levels:
1st Resistance – 200.02
2nd Resistance – 200.42
🎁 Please hit the like button and
🎁 Leave a comment to support for My Post !
Your likes and comments are incredibly motivating and will encourage me to share more analysis with you.
Best Regards, KABHI_TA_TRADING
Thank you.
Disclosure: I am part of Trade Nation's Influencer program and receive a monthly fee for using their TradingView charts in my analysis.

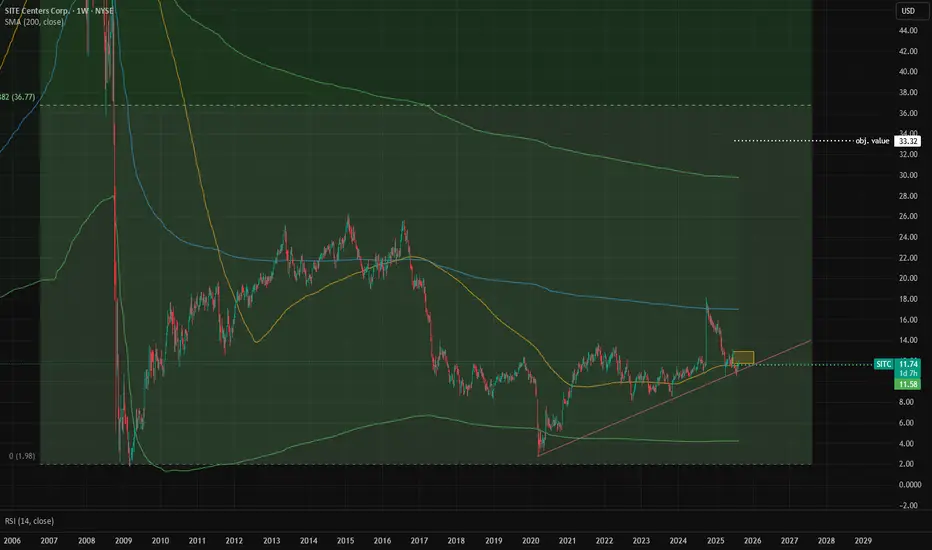
SITC: Fundamental Analysis +182%With 2024 revenue of $ 277 millions, Site Centers is an american owner and manager of open-air shopping centers. EverStock identifies a fundamental revaluation potential of +182 %.
Valuation at 1.2 x net earnings :
Currently valued at $ 622 millions in market capitalization, Site Centers posted a profit of $ 532 millions in its latest fiscal year (2024).
Balance sheet and debt :
In the company annual report, tangible net asset value stood at $ 505 millions, giving a market capitalization / tangible net asset value ratio of 1.23.
The gearing ratio is good, at 0.60. (Total financial debt / net tangible assets valuation).
Current share price : 11.83 $
Target price : 33.32 $
Upside potential : +182 % (including dividende income)
Dividend : Next dividende (special) 3.25 $ paid on 29 august
Yield : 27.47 % (special dividend)
Waiting for that next spark in Gold For now, TVC:GOLD price remains inside a couple triangle formations. We are waiting for the next big thing that could bring the precious metal out of its "shell" and send it upwards or downwards.
Let's dig in.
MARKETSCOM:GOLD
Let us know what you think in the comments below.
Thank you.
75.2% of retail investor accounts lose money when trading CFDs with this provider. You should consider whether you understand how CFDs work and whether you can afford to take the high risk of losing your money. Past performance is not necessarily indicative of future results. The value of investments may fall as well as rise and the investor may not get back the amount initially invested. This content is not intended for nor applicable to residents of the UK. Cryptocurrency CFDs and spread bets are restricted in the UK for all retail clients.

EURGBP short due to weak Euro area PMI and Strong UK PMI DataThe most recent Euro Area Services PMI data available is for August 2025, showing a value of 50.7, down from 51.2 in July 2025, and slightly below the forecast of 50.8. This indicates a slight slowdown in the services sector's expansion, as a reading above 50 still denotes growth, but the drop suggests a loss of momentum.
The most recent data for the UK Services PMI, specifically the S&P Global/CIPS Services PMI for August 2025, is 53.6, surpassing the forecast of 51.8 and improving from the previous reading of 51.8 in July 2025. This indicates a stronger expansion in the UK services sector, reflecting robust business activity.
Due to the above economic data result, we expect the Euro to weaken against the Pound.
This is a classic example of trading strong data vs weak data.

Fundamental Market Analysis for August 21, 2025 EURUSDThe euro is trading around 1.16500 and remains under pressure due to persistently higher yields on dollar assets and the divergence in rhetoric between the Fed and the ECB. In the U.S., a “higher for longer” rate scenario persists amid the slow decline in core inflation and still robust consumer demand, which supports inflows into Treasuries and the dollar. Remarks from some Fed officials indicate that premature easing could destabilize progress on inflation, so the market maintains a premium for dollar rates.
In the euro area, the picture is softer: weak German industrial dynamics and downward revisions to growth and inflation forecasts reinforce expectations of further ECB easing over the coming months. The growth and yield differential continues to work against the euro, especially against the backdrop of a widening negative real-rate spread. Additional pressure comes from sluggish credit demand and companies’ cautious investment stance amid geopolitical uncertainty and high energy costs.
Fiscal debates in key eurozone economies increase the risk premium, whereas the U.S. shows more resilient macro dynamics: retail sales and the labor market remain strong enough to support the dollar. Taken together, this cements a fundamentally bearish tilt for EURUSD in the short term until signs appear of an accelerated U.S. cooldown or more hawkish signals from the ECB.
Trade idea: SELL 1.16500, SL 1.16700, TP 1.15500

AUDUSD: Breaks Below ChannelThere's a very strong channel that formed on CMCMARKETS:AUDUSDU2025 originating since February 2025.
On the daily timeframe, price tested the lower channel boundary at the beginning of August. At that time, price respected this channel.
However, this wasn't the case more recently when price broke below this channel boundary and closed below it.
Moving over to the hourly timeframe, I'm monitoring the price action. I plotted an initial low that price traded post-breakout.
If price crosses below this initial low and makes a new lower low, that's an indication that momentum is picking up. If price reverts back, then it's a classic fakeout and then we'll hold off on this trade as price reverts back into the channel.

FR40: Resistance BreakoutOn the daily timeframe, price tested a resistance level twice. The first time was in mid-July, which resulted in a strong bearish reaction.
The second time price tested the resistance was last and current week. There was barely any reaction, which leads me to believe sellers do not see this as an overbought area.
On the hourly timeframe, price did pull back slightly after crossing above the daily level. However, this is not a clear false breakout since price crossed above the intraday high rather quickly.

Fundamental Market Analysis for August 20, 2025 USDJPYThe Japanese yen (JPY) recovered from a slight decline during the Asian session caused by mixed domestic data and on Wednesday showed positive dynamics for the second day in a row against the strengthening US dollar (USD). A government report showed that core orders for machinery and equipment in Japan unexpectedly rose in June. However, this was offset by a decline in Japanese exports in July for the third consecutive month, raising concerns about the outlook for the export-dependent economy. This added to uncertainty about the likely timing of the next interest rate hike by the Bank of Japan (BoJ) and triggered some intraday selling of the Japanese yen.
On the other hand, the US dollar is attracting some follow-up buying for the third day in a row amid a decline in the likelihood of more aggressive easing by the Federal Reserve (Fed). This is proving to be another factor providing some support for the USD/JPY pair. Nevertheless, traders still consider it more likely that the Fed will resume its cycle of rate cuts in September. In contrast, the Bank of Japan is expected to stick to its policy normalization course and raise interest rates before the end of the year. This, in turn, could limit the US dollar's gains and help contain deeper losses for the lower-yielding Japanese yen ahead of the FOMC minutes release.
Trade recommendation: SELL 147.10, SL 148.00, TP 146.20

EURGBP shorts due to higher than expected UK CPI y/y readingThe most recent UK Consumer Price Index (CPI) data for July 2025 indicates an annual inflation rate of 3.8%, an increase from 3.6% in June 2025, marking the highest level in 18 months. Key drivers include rising transport costs and food inflation hitting a 16-month peak. Core CPI, excluding volatile food and energy prices, climbed to 3.7% from 3.5% in May 2025. The CPI index stood at 138.90 points in June 2025, up from 138.40 points in May.
As a result of the above date, we expect the EUR to weaken against GBP.

AUDCHF: Breaks Below Ascending TrendlineMy observations across the Daily (D1) and Hourly (H1) timeframes.
D1 timeframe:
My EMA20 is below the EMA 60. Price has ranged a bit longer than I anticipated, but we are now getting the indication that the downtrend is continuing.
Price is also below EMA20, which helps to signal momentum is picking up.
H1 Timeframe:
After price crossed below the daily ascending trendline, it stalled and then pulled back up. To some, this is a fakeout. To others, this is a liquidity trap.
I remained patient and found an opportunity to enter on the longer bearish bar, which shows price is pushing below prior lows after this breakout lower.
