PUMPUSDT: Bullish Breakout and Retest - A Potential 34% Upside?Hello, traders!
Today we're looking at the PUMP/USDT pair on the 4-hour timeframe, and a very clean technical setup is unfolding that points towards potential bullish continuation. Let's break down the key elements of this analysis.
The Analysis
The chart presents a classic breakout and retest scenario, which is often a strong indicator of a trend reversal or continuation.
Descending Trendline Breakout: The most significant feature is the decisive breakout from a major descending trendline that had been capping the price for a considerable period. Breaking this trendline is a primary signal that the previous bearish momentum is weakening and buyers are starting to take control.
Break of Horizontal Resistance (S/R Flip): Following the trendline break, the price also successfully pushed through a key horizontal resistance zone, identified on the chart between approximately $0.002966 and $0.003044. This level has now, as expected, turned into a new support base.
The Retest: We are currently witnessing a pullback to this newly established support zone. This "retest" is a critical phase. A strong bounce from this level would confirm the breakout's validity and suggest that the market has accepted this price floor, paving the way for the next leg up.
Volume Confirmation: Notice the volume bars at the bottom of the chart. There was a visible spike in volume during the initial breakout candles, which adds conviction to the move. It indicates that the breakout was backed by significant buying interest.
The Trade Idea
Based on this structure, a potential long opportunity presents itself.
Entry: A favorable entry point could be found within the current support zone ($0.002966 - $0.003044), especially upon seeing confirmation of a bounce (e.g., a bullish engulfing candle or a hammer on the 4H or 1H chart).
Target: The analysis points to a primary target at the next major resistance level, located around the $0.004000 psychological mark. As measured on the chart, this represents a potential upside of over 34%.
Invalidation: This bullish outlook would be invalidated if the price fails to hold the current support and decisively closes back below the $0.002966 level. Placing a stop-loss below this zone is a prudent risk management strategy.
Conclusion
In summary, PUMPUSDT is displaying a textbook bullish setup. The combination of a trendline breakout, an S/R flip, and a live retest offers a compelling case for potential upside. As always, manage your risk carefully and wait for your preferred confirmation signals before entering a trade.
Disclaimer: This is not financial advice. The analysis provided is for educational and informational purposes only. Trading cryptocurrencies involves a high level of risk. Please conduct your own research and risk assessment before making any investment decisions.
Analysis

Nifty 24780 Pullback possible on next 1-2 days On 31 July, if someone watch closely price action he could capture Today up move coz Nifty gave almost same price action as 13 June let's try to find what is the Same thing: -
(A)31 July 2025: gap down is (-70%)
volume around 97 million
Bounce Back after gap down around +1%
(B) 13 June: gap down was (-80%)
Volume around 93 million
Bounce back after gap down around +1
On 13 June Nifty faced resistance of 24980 level then retraced. Due to such similarities, we can conclude that it could be pullback around 24780 level although I don't say market will behave same as before, I know every second of market is very dynamic and different from past days, but technical analysis always based on historical data. so, this is just assumption. take the trade on your own analysis & research.

Fundamental Market Analysis for July 31, 2025 GBPUSDGBPUSD:
The pound remains under pressure as consumer spending and the labor market in the UK are weakening, reducing the likelihood of an aggressive response from the Bank of England. Core inflation has dropped to 3.3% y/y – the lowest in two years – allowing the regulator to keep rates steady for longer.
External factors are also unfavorable: demand for the defensive dollar is strengthening ahead of the FOMC meeting, and the yield spread between 10-year gilts and USTs has narrowed to 115 basis points – the lowest since March, stimulating flows into the dollar.
Additional negative dynamics come from the rise in the UK current account deficit to 3.9% of GDP, amid higher prices for imported energy and declining exports of services. Expectations of tighter fiscal consolidation are increasing fiscal risks and encouraging investors to reduce long GBP positions.
Risks to the bearish outlook are limited: these would be a surprise in the form of hawkish Bank of England comments or a sharp deterioration in US macro data that could weaken the dollar.
Trade recommendation: SELL 1.32700, SL 1.32900, TP 1.31700

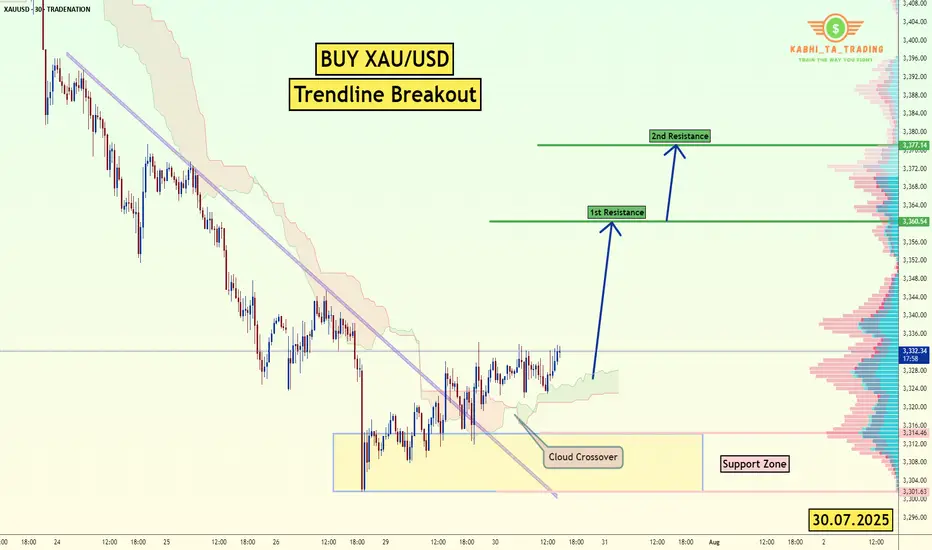
XAU/USD Trendline Breakout (30.07.2025)The XAU/USD pair on the M30 timeframe presents a Potential Buying Opportunity due to a recent Formation of a Trendline Breakout Pattern. This suggests a shift in momentum towards the upside and a higher likelihood of further advances in the coming hours.
Possible Long Trade:
Entry: Consider Entering A Long Position around Trendline Of The Pattern.
Target Levels:
1st Resistance – 3360
2nd Resistance – 3377
🎁 Please hit the like button and
🎁 Leave a comment to support for My Post !
Your likes and comments are incredibly motivating and will encourage me to share more analysis with you.
Best Regards, KABHI_TA_TRADING
Thank you.
Disclosure: I am part of Trade Nation's Influencer program and receive a monthly fee for using their TradingView charts in my analysis.
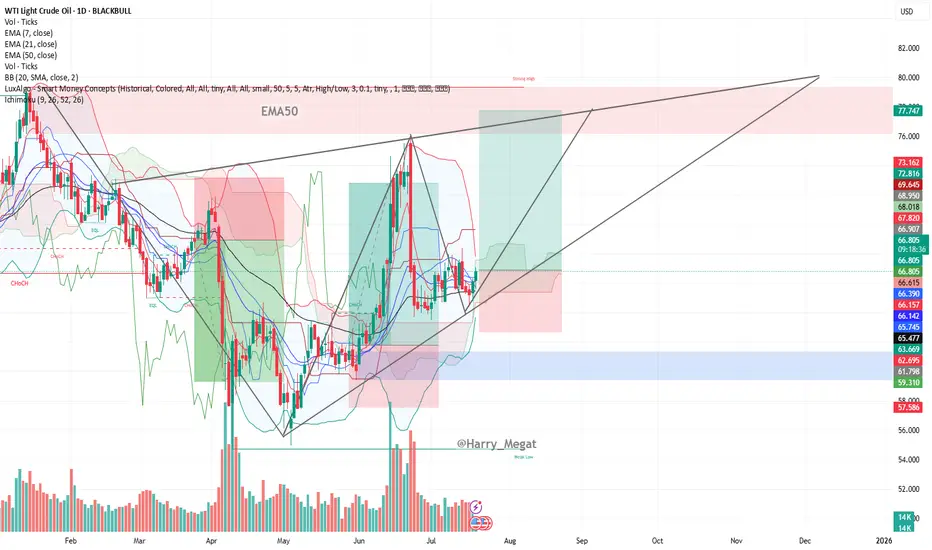
WTI Crude Oil Daily Chart Analysis (symmetrical triangle)WTI Crude Oil Daily Chart Analysis
**Trend & Structure:**
* The chart displays a **symmetrical triangle** formation, signaling a **potential breakout setup**.
* Price is currently trading around **\$66.78**, gradually rising from its recent consolidation.
* **Higher lows** and **lower highs** indicate a tightening range, which usually precedes a sharp move.
**Support & Resistance:**
* **Support Zone:** Around **\$65.47–\$66.15**, marked by the 50 EMA and prior price reactions.
* **Resistance Levels:**
* **\$68.95** – Short-term resistance and previous peak.
* **\$72.81** – Strong horizontal resistance.
* **\$77.75–\$80.00** – Projected upper trendline zone of triangle.
**Moving Averages (Bullish Setup):**
* EMA 7: **\$66.15**
* EMA 21: **\$66.14**
* EMA 50: **\$65.47**
* All EMAs are aligned in bullish order (7 > 21 > 50), confirming **bullish momentum**.
**Volume Insight:**
* Volume remains relatively steady; a spike in volume with breakout from the triangle would confirm trend continuation.
**Trade Setup Suggestion (based on chart):**
* **Breakout Buy Idea:** If price breaks above **\$68.95–\$70**, potential upside to **\$77–\$80**.
* **Invalidation:** A break below **\$65** would invalidate the bullish structure.
**Conclusion:**
WTI crude oil is trading within a symmetrical triangle, supported by bullish EMAs and tightening price action. A breakout above \$69 could trigger a bullish rally toward \$77–\$80. Keep an eye on volume confirmation and geopolitical headlines that can impact oil fundamentals.
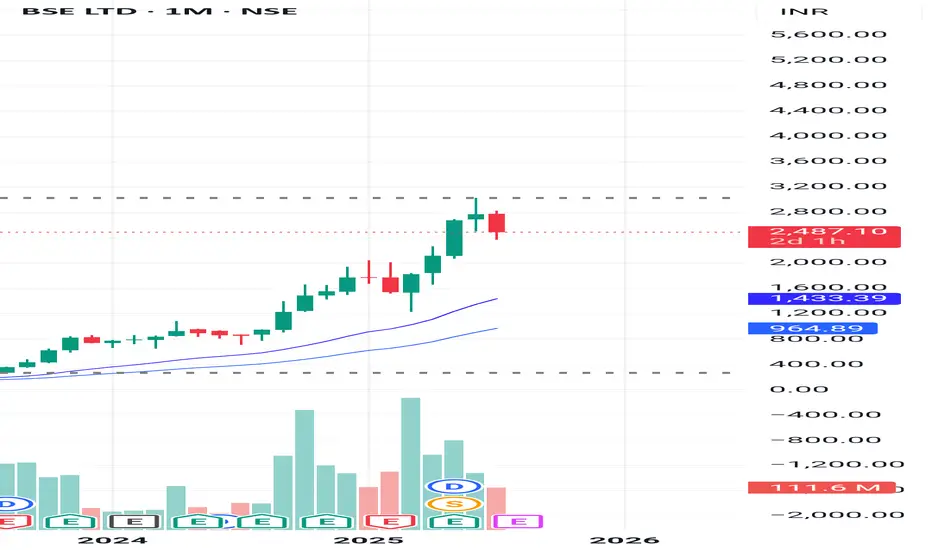
DCF VALUATION ANALYSIS OF BSEConclusion: OVERVALUED
:-OVERVIEW
BSE Limited has shown strong financial growth in recent years. Its revenue jumped from ₹924.84 crore in FY23 to ₹1,592.50 crore in FY24 (a 72% increase), and further surged to ₹3,212 crore in FY25, doubling year-on-year. EBITDA grew impressively to ₹1,779 crore in FY25 with a 60% increase, and EBIT reached ₹1,670 crore, up 56%. Net profit also rose significantly to ₹1,112 crore, with earnings per share increasing to ₹81. Dividend per share improved to ₹23, reflecting healthy returns
DCF:
-The valuation was performed using a Discounted Cash Flow (DCF) approach based purely on verified financial data and market risk parameters without relying on user-specific growth assumptions.
-The cost of equity was calculated using an adjusted risk-free rate plus equity risk premium multiplied by beta, resulting in a discount rate of approximately 13.58%. The terminal growth rate was conservatively taken as 4%. Using these reliable inputs and actual EBIT cash flows, the intrinsic enterprise value was estimated at around ₹36,839 crore, translating to an intrinsic value per share of approximately ₹1,364.
-Currently, BSE’s market price is around ₹2,480 per share, which is substantially higher than the intrinsic value derived from fundamentals, indicating the stock is trading at a significant premium. This valuation is grounded in audited company financials and globally accepted valuation methodologies, providing a trustworthy reference point for investors.
Fundamental Market Analysis for July 29, 2025 EURUSDThe pair is consolidating at 148.500, leaving behind a nearly 1% gain since the start of the week. High Treasury yields (10-year bonds — 4.34%) are supporting demand for the dollar, while the easing of the US-Japan trade conflict is reducing defensive demand for the yen. As part of yesterday's statement by the US Treasury, tariffs on Japanese cars are being reduced to 10%, which improves the outlook for export-oriented corporations, but at the same time reduces investors' need for safe-haven currencies.
Despite inflation of 3.7% y/y and rising food costs, the Bank of Japan is likely to keep its rate at 0.5% following its July 30-31 meeting and only revise its CPI forecasts upward. Former Deputy Governor of the Central Bank Hiroshi Nakaso acknowledges that further increases are only possible after assessing the effect of US tariffs, i.e., not before 2026. This scenario reinforces negative real interest rates and a widening yield differential with the US.
In addition, the inflow of Japanese investment into foreign bonds has resumed amid confidence in a gradual, rather than sharp, normalization of BOJ policy. Taken together, these factors point to the likelihood of a test of 150.00 in the coming days in the absence of verbal intervention by the Japanese Ministry of Finance.
Trading recommendation: BUY 148.500, SL 147.900, TP 150.500

USD/JPY(20250729)Today's AnalysisMarket news:
After gold prices soared to an all-time high of more than $3,500 an ounce in April, the latest report from the Commodity Futures Trading Commission (CFTC) showed that fund managers have increased their bullish bets to the highest level in 16 weeks.
Technical analysis:
Today's buy and sell boundaries:
148.19
Support and resistance levels:
149.23
148.84
148.59
147.78
147.53
147.14
Trading strategy:
If the price breaks through 148.59, consider buying, the first target price is 148.84
If the price breaks through 148.19, consider selling, the first target price is 147.78

USDJPY LONG setupsimply
we have demand
and the price can't lower low
end we have break of structure on low time frame
and we have more but i don't have enough time to tell you
Look the photo well
Potentially, A Safer Way To Long The EURUSDIn contrast to my previous outlook, the current price action suggests an increased probability of a deeper bearish move—potentially invalidating the buy zone marked out in the previous analysis. This sudden change is largely driven by the prospect of untapped liquidity residing beneath that zone, reinforcing the well-known market principle that price seeks out liquidity before committing to directional moves.
Given this development, the newly identified zone on the chart emerges as a more technically sound and reliable area from which to anticipate bullish interest. It aligns better with the broader liquidity profile and offers a stronger base for accumulation. Traders may opt to wait for confirmations within this zone or, depending on their risk appetite, consider executing buy positions upon price entry.
As always, patience and clarity are key as we allow price to reveal its intention.
Fingers crossed 🤞
Wishing you all a focused and profitable trading week.
Catch you on the next one. 🫡

Euro will rebound from support line of wedge to resistance levelHello traders, I want share with you my opinion about Euro. After breaking out decisively from a prior downward channel, the euro initiated a significant structural shift, moving from a clear downward trend into a new and more volatile market condition. This transition has led to the development of a large broadening wedge pattern, which is characterised by higher highs and lower lows, indicating an expansion in volatility as both buyers and sellers fight for control. The boundaries of this struggle are well-defined by a major buyer zone around 1.1650 and a formidable seller zone near 1.1750. Currently, the pair is in a corrective phase, moving downwards within the wedge after a recent upward rebound was rejected from the upper resistance line. The primary working hypothesis is a long scenario, which anticipates that this downward correction will find strong support at the confluence of the wedge's ascending support line and the horizontal buyer zone around 1.1650. A confirmed bounce from this critical area of support would validate the integrity of the broadening wedge pattern and likely trigger another powerful upward rotation. Therefore, the TP is strategically placed at the 1.1750 resistance level. Please share this idea with your friends and click Boost 🚀
Disclaimer: As part of ThinkMarkets’ Influencer Program, I am sponsored to share and publish their charts in my analysis.

Next Move On EURUSD: A Bullish ContinuationWith this 4H bearish impulsive move, it’s easy to assume a reversal is underway to break the previous daily swing low. However, this appears more like a liquidity grab—fueling the next leg to the upside.
Price has retraced into a key zone that previously performed a strong liquidation. With significant liquidity already swept and clean inducements now resting above, this level becomes crucial.
This zone is the last stand: a break downward may target the daily swing low, while a hold and reaction could propel price toward the swing high.
Fingers crossed 🤞 as we watch price play out.
Have a great trading week, traders.
Catch you in the next one. 🫡

EUR/USD Technical Analysis📈 EUR/USD Technical Analysis
🔍 1. Market Structure
⚙ Trend Context
• The overall trend since mid-July has been bullish, with higher highs and higher lows forming after a bounce from a key demand zone (around 1.15380).
• However, recent candles show indecision and a potential reversal, suggesting weakening momentum.
⸻
🧱 2. Volume Profile Insight (VRVP)
• High Volume Nodes (HVNs):
• Significant trading activity occurred between 1.172–1.176, now acting as resistance.
• Low Volume Gaps:
• Thin liquidity zones exist between 1.165–1.158, which could result in swift price movement if selling pressure increases.
📘 Educational Insight: Thin volume areas on a profile typically allow for faster price transitions due to lack of order density.
⸻
📊 3. Envelope Indicator – Nadaraya-Watson (8,3)
• A mean-reversion tool estimating dynamic overbought and oversold areas.
• Price recently rejected the upper boundary, reinforcing the bearish outlook.
• The lower envelope, around 1.158–1.160, aligns with the projected bearish target.
⸻
🟫 4. Demand Zone Analysis
• Labeled “DEMAND ZONE” at 1.15380–1.15830
• Previously caused a strong bullish reversal, marking it as an area of institutional interest.
• A re-test of this zone may attract buyers once again, presenting a key support area.
📘 Educational Insight: Demand zones reflect

Fundamental Market Analysis for July 28, 2025 GBPUSDThe pound is sliding to 1.34250, reacting to a fresh slowdown in UK inflation and reduced expectations of further tightening from the Bank of England. The annual CPI for June fell to 2.2%, the lowest since March 2022, allowing the regulator to keep rates unchanged at the August meeting.
Meanwhile, rising Treasury yields intensify capital inflows into dollar assets after a strong US Q2 GDP report (+2.4% q/q). The British economy remains close to stagnation: the services PMI fell to 49.8, indicating shrinking orders and wage pressure.
Political risks also weigh on the pound: the ruling party's parliamentary majority shrank after unscheduled by-elections, complicating the government's implementation of fiscal stimulus. Collectively, this increases the attractiveness of selling the pair ahead of the Fed meeting, where markets price in a possible rate hike by year-end.
Trade recommendation: SELL 1.34250, SL 1.34450, TP 1.33250

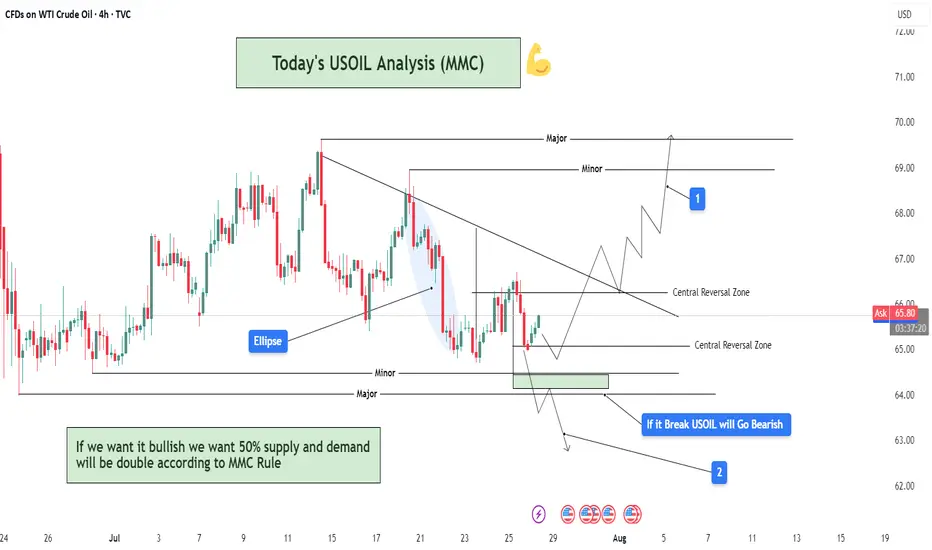
USOIL Analysis : MMC Bullish Setup Building on USOIL – Target🧠 Introduction & Trade Philosophy
In today’s 4H USOIL chart analysis, we are at a critical decision-making zone, where price action is preparing to make a major move in either direction, based on the response to a central demand zone. We are applying the MMC Rule, which emphasizes mirroring supply-demand behavior and validating market moves through structural confirmation.
The current price structure presents a classic MMC scenario, where price must either confirm a bullish double demand reaction or invalidate the setup by breaking the key zone and moving bearish.
📍 Chart Structure Explained
🔷 1. Central Reversal Zones (CRZs)
There are two CRZs highlighted:
The upper CRZ around 65.90–66.20, where price was previously rejected.
The lower CRZ, where price is currently consolidating, is around 64.80–65.50.
These zones are liquidity-rich areas where big players react—either by absorbing positions or driving directional moves.
🟢 2. Bullish Scenario – MMC Rule In Play (Path 1)
"If we want it bullish, we want 50% supply and demand will be double according to MMC Rule"
According to MMC, a bullish move must be confirmed by a strong reaction from demand, showing double the pressure of the last bearish move. Here's how that plays out:
Price respects the lower CRZ, bouncing near the 65.00 mark.
If this bounce gains momentum and breaks above the trendline resistance, the first target is the minor resistance at $69.00, followed by the major resistance zone near $70.50–$71.00.
A retest of broken structure, followed by bullish continuation, is expected. This is marked with the white zigzag projection labeled as “1” on the chart.
Watch for a clear higher high formation, which would indicate a shift in structure and validate bullish momentum.
🔻 3. Bearish Scenario – Breakdown Confirmation (Path 2)
"If it breaks, USOIL will go bearish"
If price fails to hold the current demand and closes below $64.80–64.50, it signals that demand has been absorbed, and MMC reversal has failed. In that case:
A clean breakdown below the demand zone will confirm bearish control.
The next downside target becomes $62.00, as labeled “2” on the chart.
The downward move is likely to follow a steep path as marked with the sharp downward trendline extension, especially if supported by volume and news catalysts.
🔄 Mirror Concept Highlight – Ellipse Area
The ellipse shape on the chart marks a previous compression zone followed by a breakout. This area represents an imbalance in supply that led to a sell-off. The MMC principle suggests the market tends to mirror these zones—if that was previous supply, and the current demand zone mirrors its positioning and structure, we can anticipate a similar reaction, but to the upside.
This is where the "50% double reaction" rule comes in—demand needs to show twice the strength to overcome the previous sell-side pressure.
🔧 Technical Levels Summary
Zone Type Price Range Notes
Major Resistance 70.50 – 71.00 Final target if bullish scenario plays out
Minor Resistance 68.80 – 69.20 First bullish checkpoint
Upper CRZ 65.90 – 66.20 Key structure to break for bulls
Lower CRZ (Support) 64.80 – 65.50 Demand base for bullish setup
Bearish Target Zone 62.00 – 61.80 Projected zone if support breaks
🧭 Trader’s Mindset & Risk Notes (MMC Style)
Wait for clear confirmation and price behavior near the CRZs before entering.
Use trendline breaks, candlestick confirmation, and volume to validate direction.
Avoid guessing the direction—let price tell the story.
Stick to MMC rules: No confirmation, no position.
✅ Bullish Criteria Checklist:
✔️ Price respects lower CRZ
✔️ Breakout above trendline
✔️ Closes above $66.20
✔️ Higher highs + strong bullish candles
✔️ MMC Double Demand Reaction Confirmed
❌ Bearish Breakdown Triggers:
❌ Breaks below $64.50
❌ Weak bounce + lower highs
❌ Volume increases on downside
❌ Clean breakdown structure
🚀 Trade Plan & Outlook
We’re now at a critical zone where market sentiment will soon be clear. Based on your MMC analysis, the bias remains bullish as long as price holds above $64.80. Be patient and let the setup complete with structure confirmation.
This is not just a technical play—it's a psychological zone, where institutional traders also make decisions. Follow the MMC logic and react with confirmation.