EURUSD Short Term Pullback ZoneQuick Summary
EURUSD rallied strongly at the start of the week and broke the H4 bearish trendline
A short term continuation higher is possible and the Price may reach the orderblock at 1.17215
This level will only be considered for sells if a clear rejection appears.
Full Analysis
Following the strong bullish move at the beginning of the week EURUSD managed to break the bearish trendline on the four hour timeframe
This break opens the door for a brief continuation to the upside before any further downside attempt
Price is expected to extend higher toward the orderblock around 1.17215
This area represents a potential reaction zone where the market may decide its next direction
The move toward this level is viewed as short term continuation rather than a full trend shift
For that reason sell positions should only be considered if price shows a clear rejection signal from this zone
Without strong bearish confirmation the level should not be traded blindly
Only a clear rejection would validate this area as a continuation point for the broader bearish direction
Analysis

EURUSD Liquidity Driven DownsideQuick Summary
EURUSD remains under a bearish view
After a strong rally that created a liquidity void price has started to move lower and The market is expected to fill this liquidity void and continue toward the low at 1.16324
This level represents a liquidity target and aligns with a retest of the broken bearish trendline
Full Analysis
In continuation of the bearish outlook EURUSD recently pushed higher aggressively which resulted in the creation of a clear liquidity void
Following that move price has now started to decline in order to rebalance this inefficiency
The expectation is for price to fully fill the liquidity void and then continue lower toward the low at 1.16324
This low represents a strong liquidity target as such levels are often revisited after liquidity voids created.
This type of structure where a liquidity void is followed by a nearby liquidity low is commonly targeted by the market
The probability increases further as this potential sweep also aligns with a retest of the previously broken bearish trendline
As long as price remains below the recent high the downside scenario stays valid
The focus remains on watching price behavior as it approaches the 1.16324 level and monitoring the reaction around the trendline retest

Fundamental Market Analysis for January 22, 2026 GBPUSDGBP/USD is trading near 1.34300 on January 22, 2026. The backdrop for sterling is mixed: UK inflation in December rose to 3.4%, and services inflation to 4.5%, making the market more cautious about pricing in rapid Bank of England rate cuts. However, weak economic growth and a cooling labor market keep expectations in place that the 3.75% rate will be reduced further over time.
On the US side, the dollar is supported by higher interest rates: the Fed’s target range is 3.50–3.75%, and the regulator is tying future decisions to incoming data. Today’s key releases include growth and inflation figures, as well as weekly jobless claims. If the reports confirm resilient demand and a gradual easing of inflation pressure, demand for the dollar may strengthen.
External trade headlines between the US and Europe remain a source of short-term volatility and affect investors’ appetite for risk. On such days, sterling tends to be vulnerable as market participants prefer to rotate into more liquid assets and currencies with a clearer yield advantage. If the dollar remains supported, the base-case scenario is pressure on GBP/USD and a move lower from current levels.
Trade recommendation: SELL 1.34300, SL 1.34500, TP 1.33500

BTC at a Decision Point — Relief Bounce or Lower High?On the BTCUSD H1 chart, price remains firmly in a short-term bearish structure following the sharp impulsive sell off from the 95,000 region. The breakdown from the prior consolidation occurred with strong momentum, slicing cleanly below the EMA and confirming a shift from balance to markdown. Since then, Bitcoin has been trading beneath a well-defined resistance zone around 93,200–93,500, where previous support has now flipped into supply a classic bearish market behavior.
The recent reaction from the support zone near 88,000–88,500 is technically a relief bounce, not a reversal. Structurally, the bounce is corrective: price is forming overlapping candles and shallow pullbacks, suggesting short covering rather than aggressive new demand. As long as BTC remains capped below 89,900–91,200, the probability favors a lower high forming before sellers reassert control.
If buyers can hold above the support zone and reclaim 89,900, a deeper corrective move toward 91,200–91,500 is possible, where the EMA and prior intraday structure align. However, this zone is expected to act as sell side re entry, not a breakout level. Failure to build acceptance above that area would likely trigger another leg down, reopening downside liquidity toward the lower 88,000 region and potentially below if support weakens.
Bitcoin is currently in a bearish retracement phase inside a broader intraday downtrend. The support zone is holding for now, but without a strong structural reclaim, upside moves should be treated as corrective pullbacks into resistance. Until BTC decisively breaks and holds above the resistance zone, risk remains skewed to the downside, with sellers still controlling market structure.

EURUSD Is Stalling at Supply — Distribution Pressure Is Quietly On the EURUSD H1 chart, price has completed a sharp impulsive rally and is now stalling directly inside a well-defined resistance zone, where upside momentum has clearly weakened. After the vertical push, the market failed to extend higher and instead transitioned into a tight sideways range, signaling acceptance rather than continuation. Candles inside this zone are overlapping, with repeated rejections near the upper boundary a classic sign of distribution, not consolidation for another leg up.
Structurally, this sideways behavior after an impulse suggests buyers are losing control, while sellers are gradually absorbing liquidity at premium prices. As long as price remains capped below resistance, the bias favors a range breakdown scenario. A clean loss of the lower boundary of the sideways zone would likely trigger a controlled bearish expansion, targeting the next liquidity pocket below, followed by a deeper continuation toward the lower demand region where profit-taking becomes logical.
This is no longer a breakout environment. EURUSD is in a sell-high, patience-required phase. Failure to reclaim and hold above resistance keeps the path of least resistance to the downside, with rallies into the zone serving as opportunities for distribution rather than continuation.

Will there be a correction today, January 22nd, 2026?1️⃣ Trendline
Main trend: BULLISH.
Price is still holding above the long-term ascending trendline → the Higher High – Higher Low structure remains intact.
The current move is a pullback / consolidation after a strong rally, with no confirmed trend reversal yet.
2️⃣ Resistance
4,855 – 4,888: Strong resistance zone (previous high + distribution area).
→ Profit-taking and false breakouts are likely in this zone.
→ Bullish continuation only if price breaks and closes clearly above 4,888.
3️⃣ Support
Ascending trendline: Key dynamic support, focus on price reaction here.
4,755: Strong support (structural low + demand zone).
→ Losing this level would break the short-term bullish structure, increasing the risk of a deeper correction.
4️⃣ Main Scenarios
Primary scenario: Price pulls back to the trendline → holds → rebounds to retest resistance.
Risk scenario: Break below the trendline and lose 4,755 → market shifts to sideways or short-term bearish.
👉 Strategy: Look for trend-following buys at support, avoid FOMO entries at resistance.
📈 Trade Plan
BUY GOLD: 4,755 – 4,757
Stop Loss: 4,747
Take Profit: 100 – 300 – 500 pips
SELL GOLD: 4,854 – 4,856
Stop Loss: 4,866
Take Profit: 100 – 300 – 500 pips

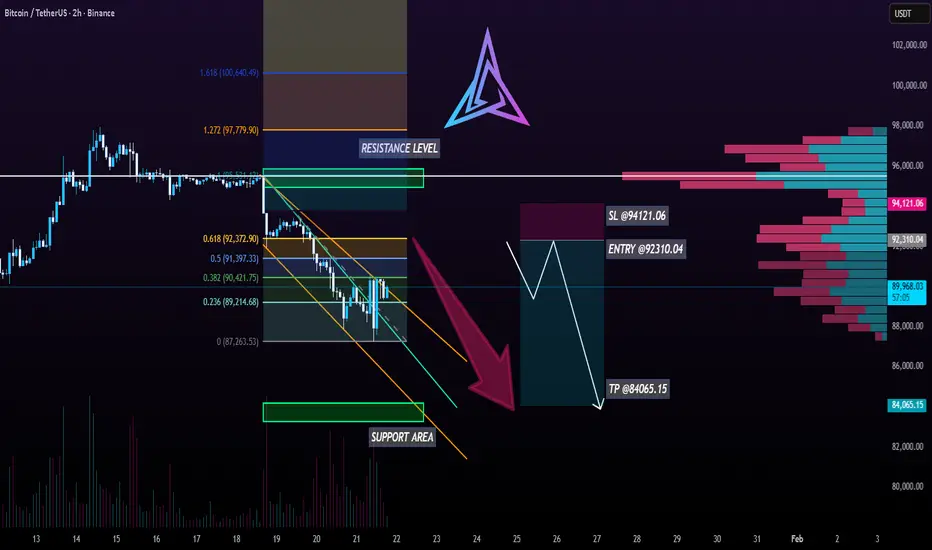
BTCUSDT 2H | Rejected at 0.382 Fib – Bearish ContinuationHello everyone,
BTC 2H chart shows clear rejection at 0.382 Fib retracement ($90,421) after brief rally attempt. Price now back below it (~$89,987 area), maintaining the descending channel structure with lower highs intact.
Key Technicals:
📌 Fibonacci Retracement (Swing High ~$95.5k → Low $87.3k):
0.236 broken, 0.382 rejected multiple times → strong overhead resistance.
📌 Next barriers: 0.5 ($91,397), 0.618 ($92,372).
📌 Descending Channel: Upper trendline capping rallies, lower highs pattern holding.
📌 VRVP: Heavy selling supply stacked $90k–$96k (dominant pink/red bars) → exhaustion on up moves.
Bearish Confluences:
✅ Multiple rejections at Fib + channel resistance despite momentum attempts.
✅ Low-volume zone = increased volatility risk on downside.
✅ Overhead supply from VRVP confirms selling pressure dominant.
SHORT Setup (High-Probability Wait):
Entry: ~$92,310 (confirmed rejection at 0.618 Fib $92,372) – look for long upper wicks, declining volume on approach.
SL: $94,121 (above key resistance) – Risk ~1.962%.
TP Range: $84,065 (1.272 to 1.618 Fib extension confluence + psychological support zone).
Why Wait for Confirmation?
Patience for rejection at resistance → tighter stop, higher probability. No clear signal = no trade.Invalidation: Clean close above $94,121 + volume breakout → bullish flip, reassess higher.
Monitoring next 24–48h for rally to $92k rejection or direct breakdown below $89k. Technical structure holds priority.
DISCLAIMER
Educational analysis documenting my trading process. Not financial advice. Crypto markets are volatile. Use proper risk management. Trade at your own risk!
XAUUSD Long: Uptrend Holds as Price Respects Rising Trend LineHello traders! Here’s a clear technical breakdown of XAUUSD (1H) based on the current chart structure. Gold is trading within a well-defined bullish structure after forming a clear pivot low earlier on the chart. From this pivot point, a rising trend line has been established, highlighting consistent buyer participation and a gradual shift in market control toward the upside. This trend line has been respected multiple times, confirming it as a key dynamic support guiding the bullish move. Following the pivot, price advanced and broke above a descending supply line, signaling a structural change from corrective pressure to bullish continuation. This breakout was impulsive, indicating strong demand entering the market. After the breakout, XAUUSD transitioned into a consolidation range, where price moved sideways as buyers and sellers reached temporary equilibrium. This range acted as a continuation structure rather than distribution.
Currently, price eventually broke out of the range to the upside, confirming renewed bullish momentum. After the breakout, gold pulled back and successfully retested the former resistance area, which is now acting as a Demand Zone around 4,700. This retest appears corrective, not impulsive, suggesting healthy price action and continued buyer dominance rather than trend exhaustion. On the upside, the next key level is the Supply Zone near 4,770, where previous selling pressure is expected to reappear. The current structure shows higher highs and higher lows, and price remains firmly above both horizontal demand and the rising trend line, keeping the bullish bias intact.
My scenario: as long as XAUUSD holds above the 4,700 Demand Zone and continues to respect the ascending trend line, the bullish structure remains valid. I expect buyers to defend this area and potentially push price toward the 4,770 Supply Zone (TP1). A clean breakout and acceptance above this level would confirm further bullish continuation. However, a decisive breakdown below the demand zone and trend line would weaken the bullish bias and signal a deeper corrective move. For now, market structure clearly favors buyers. Manage your risk!

BTCUSDT Long: Rising Trend Line and Demand Supports Bullish BiasHello traders! Here’s a clear technical breakdown of BTCUSDT (2H) based on the current chart structure. Bitcoin is trading within a developing bullish structure after forming a clear pivot low, from which a rising trend line has been established. This trend line reflects increasing buyer participation and gradual strength returning to the market. Following the pivot, price moved higher and transitioned from consolidation into an impulsive bullish leg, confirming a structural shift. After the upside move, BTC reached a clearly defined Supply zone around 94,500, where selling pressure stepped in. This reaction led to a range formation just below supply, indicating temporary consolidation after the impulsive rally. This range reflects short-term equilibrium rather than a trend reversal, as price remains structurally supported.
Currently, BTC is reacting from a strong Demand zone around 91,900, which aligns closely with the rising trend line. This confluence between horizontal demand and dynamic support strengthens the level. The recent pullback into demand appears corrective rather than impulsive, suggesting that sellers are losing momentum and buyers continue to defend structure.
My scenario: as long as BTCUSDT holds above the 91,900 demand zone and respects the ascending trend line, the market structure remains bullish. A sustained reaction from demand could lead to another attempt toward the 94,500 supply zone, and a confirmed breakout above this level would open the door for further upside continuation. A decisive breakdown and acceptance below demand would invalidate the bullish bias and shift focus toward deeper corrective levels. For now, price remains compressed between demand and supply, with buyers maintaining structural control. Manage your risk!

Gold prices continue to set all-time highs (ATH).1️⃣ Trendline
Main trend: BULLISH
Price remains above the ascending trendline → the Higher High – Higher Low structure is still valid.
The current move is a consolidation / technical pullback, with no signs of a structural breakdown yet.
2️⃣ Resistance
4,900 – 4,905: Strong resistance (target peak + confluence with the upper trendline) → profit-taking pressure is likely.
Condition for continuation: A clear break and close above 4,900.
3️⃣ Support
4,816 – 4,814: Near-term support (consolidation / pullback zone).
4,766 – 4,768: Strong support (Higher Low + demand zone). Holding above this area keeps the bullish trend intact.
4️⃣ Main Scenario
Priority: BUY with the trend as long as price holds above 4,768, target 4,900.
Warning: A break below 4,766 increases the risk of a deeper correction and requires close price action monitoring.
Trading Plan
BUY GOLD: 4,816 – 4,814
Stop Loss: 4,804
Take Profit: 100 – 300 – 500 pips
SELL GOLD: 4,900 – 4,902
Stop Loss: 4,912
Take Profit: 100 – 300 – 500 pips

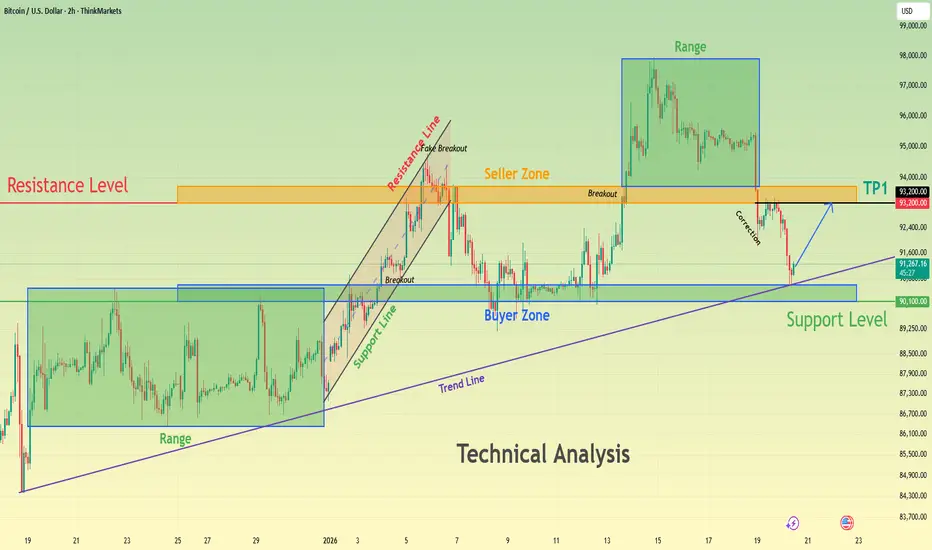
BTCUSD Holds Above Demand - Next Move Toward 93,200 ResistanceHello traders! Here’s my technical outlook on BTCUSD (2H) based on the current chart structure. Bitcoin is trading within a clear bullish environment after transitioning from a prolonged consolidation phase into an impulsive upward move. Earlier on the chart, price was moving inside a well-defined range, indicating balance between buyers and sellers and a period of accumulation. This range was eventually resolved to the upside, confirming a shift in market control in favor of buyers. Following the breakout, BTCUSD accelerated higher and successfully established acceptance above the former range highs. Currently, price is trading above the Support Level around the 90,100 area, which aligns with a clearly defined Buyer Zone and a previous structural level. This area is now acting as a key demand zone after the breakout and is reinforced by the rising trend line, strengthening its importance. The recent pullback into this support appears corrective rather than impulsive, suggesting healthy profit-taking instead of aggressive selling pressure. Buyers are actively defending this zone, keeping the bullish structure intact as long as price remains above support. If buyers continue to defend the 90,100 Buyer Zone, BTCUSD could resume its upward move toward the 93,200 Resistance Level, which serves as the next key objective. A clean continuation and acceptance above this resistance would confirm further upside momentum and open the door for continuation toward higher targets (TP1 and beyond). However, a decisive breakdown and acceptance below the support zone and rising trend line would signal a deeper correction and weaken the bullish setup. For now, the overall structure favors buyers while price respects support. Please share this idea with your friends and click Boost 🚀
GOLD – 4H | Bearish Divergence – Pullback or Continuation?Gold ( OANDA:XAUUSD ) remains in a broader uptrend on the 4H timeframe, printing higher highs and higher lows while respecting the ascending channel structure. However, recent price action suggests the upside momentum may be weakening near a key resistance zone at 4640.
Price is currently consolidating between 4640 and 4570, showing clear signs of accumulation. At the same time, a bearish divergence on RSI is visible, indicating declining momentum despite price holding near highs. This divergence aligns with a rising wedge formation, which often precedes corrective or reversal moves when it appears late in an uptrend.
From a structure perspective, the market is approaching a decision point.
A clean break and 4H close above the 4650 zone would invalidate the immediate bearish setup and could open the path toward the 4700 area.
On the downside, a 4H close below 4570, accompanied by a clear breakdown from the accumulation range, would confirm weakness and expose 4500, with room for further downside.
Adding to the confluence, the higher-timeframe structure also shows a bearish harmonic AB=CD pattern, reinforcing the idea of a potential pullback or corrective phase..
Fundamentally, gold remains strong overall, but from a technical standpoint, a pullback within the trend appears increasingly likely.
Watching price action closely for confirmation.
Bias remains short-term bearish unless invalidated.

EURJPY - Market is at Overbought Zone, Expecting Correction..!The image provided is a forex trading chart for the EUR/JPY currency pair, illustrating a technical analysis strategy.
The analysis identifies a "daily resistance" level where traders are advised to "look for shorts" (sell positions), anticipating a price decline.
Technical Analysis Overview 📊
Currency Pair: Euro / Japanese Yen (EUR/JPY). 💴
Strategy: The chart highlights a resistance level (the upper horizontal line around 185.5 JPY per Euro) where selling pressure has historically increased.
Actionable Insight: The text "LOOK FOR SHORTS" suggests implementing a trading strategy to profit from an expected downward price movement, often used when a market is considered overbought. ⬇️
Market Context: As of recent data (January 2026), the EUR/JPY pair has been trading near record highs, with some analyses noting potential bearish divergence in technical indicators, which could support the short-selling idea. ⬇️

BANK OF MAHARASHTRA - DAILY CHART MY VIEW The Structure looks good to us, waiting for this instrument to correct and then give us these opportunities as shown on this instrument (Price Chart).
Note: Its my view only and its for educational purpose only. Only who has got knowledge about this strategy, will understand what to be done on this setup. its purely based on my technical analysis only (strategies). we don't focus on the short term moves, we look for only for Bullish or Bearish Impulsive moves on the setups after a good price action is formed as per the strategy. we never get into corrective moves. because it will test our patience and also it will be a bullish or a bearish trap. and try trade the big moves.
We do not get into bullish or bearish traps. We anticipate and get into only big bullish or bearish moves (Impulsive Moves). Just ride the Bullish or Bearish Impulsive Move. Learn & Know the Complete Market Cycle.
Buy Low and Sell High Concept. Buy at Cheaper Price and Sell at Expensive Price.
Please keep your comments useful & respectful.
Keep it simple, keep it Unique.
Thanks for your support
Tradelikemee Academy
Saanjayy K G

EURUSD Breakout Confirmed: From Bearish Control to Bullish On the EURUSD H1, the market has just delivered a clean and technically meaningful breakout, marking a clear transition from a prolonged bearish phase into an early-stage bullish expansion. For several sessions, price was respecting a descending trendline, with lower highs and consistent rejection from the EMA a textbook sign of seller control. That structure has now been decisively invalidated.
The breakout is not a weak grind. Price impulsively pushed through the descending trendline, reclaimed the EMA, and continued straight into the prior supply/resistance zone around 1.1700. This sequence is critical: trendline break → EMA reclaim → expansion candle. That alignment strongly suggests this move is driven by real demand, not just short-term stop hunting.
The former resistance zone around 1.1680–1.1700 now becomes the key decision area. If price accepts above this zone and holds it as support, the bearish structure is officially broken and the market shifts into a bullish continuation framework. In that scenario, upside targets open toward 1.1740, 1.1780, and ultimately 1.1805, where higher-timeframe liquidity and previous highs reside.
From a price action perspective, the projected pullbacks shown on the chart are corrective paths, not reversal signals. Shallow retracements into reclaimed structure would likely act as re-accumulation, offering continuation opportunities rather than short setups. Only a sustained failure back below the breakout base would invalidate the bullish thesis.
EURUSD has exited bearish compression and entered a range-expansion phase. As long as price holds above the breakout zone and the EMA remains supportive, bulls control the narrative, with momentum favoring continuation toward higher liquidity targets.

Bitcoin Breakdown Complete: Accumulation or Just a BounceOn the BTCUSD H1 timeframe, price action has officially shifted into a post-breakdown environment, and the structure on this chart is very clear from a professional market-structure perspective. Bitcoin previously spent a significant amount of time rotating inside a tight accumulation/balance range around 93,000 – 93,500, with price holding above the EMA 89. However, that range was distribution, not accumulation. The decisive bearish impulse candle sliced cleanly through the range, the EMA, and prior intraday support confirming acceptance below value, not a fake break.
After the breakdown, price attempted to stabilize briefly, but sellers maintained control and forced continuation lower. This behavior tells us two things:
1. Buyers failed to defend the range, and
2. The market is now actively searching for real demand, not resting.
The current move into the 91,800 – 90,800 support zone is structurally logical. This zone aligns with a prior demand base and represents the first area where responsive buyers may step in. The green projected path on the chart reflects a technical rebound scenario, but it should be viewed strictly as a corrective reaction, not trend continuation.
As long as price remains below the broken accumulation range (~93,000), any upside move is classified as a lower-high pullback within a bearish intraday structure. A clean reclaim and acceptance back above that range would be required to shift bias bullish again. Until then, rallies are vulnerable to selling pressure.
This is not a dip-buy environment yet, it is a range failure followed by a liquidity run. If price reacts strongly from the support zone, short-term bounces are tradable. But structurally, Bitcoin remains weak below value, and patience is required to see whether this support produces real accumulation or simply fuels the next leg down.
Smart traders wait for confirmation not hope.

ETH Liquidity Sweep Complete: Accumulation or Trap On the ETHUSD H1 timeframe, the market has just completed a clean liquidity sweep below value, and the structure now transitions into a very sensitive decision zone.
Ethereum previously traded inside a high-volume liquidity range around 3,280 – 3,350, where price repeatedly stalled and failed to expand higher. The sharp bearish impulse candle slicing through this range was not random it was a distribution break, confirmed by strong momentum and a decisive loss of the EMA 89. Once price accepted below that EMA, upside continuation was structurally invalidated.
Following the breakdown, ETH rotated briefly inside a lower accumulation zone (~3,160 – 3,220). However, this was not true accumulation it was bearish acceptance, evidenced by overlapping candles, weak bounces, and failure to reclaim the EMA. The final sell-off flushed liquidity directly into the major support zone around 3,050 – 3,080, where reactive buyers are now expected to appear.
From a professional market-structure perspective, the current price action suggests sell-side liquidity has been largely cleared. This opens the door for a technical rebound, but context is critical: any bounce from this support should be treated as corrective, not trend-confirming, until price can reclaim and hold above the broken accumulation range near 3,220 – 3,240.
The projected upside path on the chart reflects a mean-reversion scenario a bounce from support, followed by a retest of prior value. If ETH fails at that retest, it would confirm the move as a classic liquidity grab + lower-high setup, increasing the probability of another downside leg. Only sustained acceptance back above the liquidity range would flip bias bullish again.
Key takeaway:
ETH is currently trading in a post-distribution environment. The dump was structural, not emotional. Support may produce a bounce, but until value is reclaimed, rallies are reactions not reversals. Smart traders now wait for confirmation at the reclaim, not at the bottom.

Vertical Breakout Into Resistance — Exhaustion or Just a Pause EURUSD has just printed a strong impulsive bullish leg, accelerating sharply out of its prior consolidation and driving straight into a higher-timeframe resistance zone around the 1.1740 area. This move was fast, clean, and largely one-directional a classic momentum-driven expansion, often seen when liquidity is swept and late buyers chase price higher. However, such vertical moves rarely sustain without a pause. When price reaches resistance in this manner, the probability of short-term exhaustion increases significantly.
🟥 Resistance Zone Reaction
Price is currently reacting directly at a clearly defined resistance zone, where previous selling pressure has emerged. The lack of consolidation below resistance and the immediate hesitation suggest that buyers may be losing momentum, rather than building acceptance above the level.
From a price action perspective:
- The move into resistance was impulsive.
- Any move away from resistance is likely to be corrective first.
This creates an environment where pullbacks and mean reversion become the dominant expectation.
🔄 Pullback & Target Logic
The projected path on the chart outlines a step-by-step corrective rotation lower, not an immediate collapse. This is important.
Key levels to watch:
- First pullback target: ~1.1660 area a prior intraday structure level where price may pause.
- Secondary take-profit zone: ~1.1620 aligns with previous consolidation and liquidity.
- Extended target: ~1.1590 — a deeper mean-reversion level and prior demand area.
These levels represent logical areas for profit-taking, not guaranteed destinations.
🧠 Scenario Breakdown
Primary scenario (Corrective pullback):
- Price rejects from resistance.
- Forms lower highs.
- Gradually rotates lower toward prior structure levels.
Invalidation scenario:
- Strong bullish acceptance above the resistance zone.
- Consolidation above 1.1740 would invalidate the short-term bearish pullback bias and reopen upside continuation.
🎯 Final Takeaway
EURUSD has completed a textbook impulsive run into resistance. At this stage, the market is no longer offering high-probability continuation longs instead, it is entering a reaction phase, where correction and profit-taking are statistically favored.
Strong moves invite reactions. Resistance is where decisions are made.
Patience and confirmation remain key. Let price show whether this level holds or fails.

ETH Is Testing Major Demand After BreakdownETH Is Testing Major Demand After Breakdown – Bounce Is Likely, But Context Still Matters
On the H1 timeframe, Ethereum has just completed a sharp impulsive sell-off, breaking down from the prior consolidation and accelerating straight into a well-defined support zone around 3,070–3,090. The nature of this move is important: price did not drift lower gradually, but instead sold off aggressively after failing at the 3,220–3,240 resistance zone, confirming that sellers were firmly in control at higher prices.
The rejection from resistance occurred directly beneath the descending EMA cluster, which acted as dynamic resistance throughout the pullback. This alignment between horizontal resistance and EMA pressure created a high-probability sell zone, and once price failed to reclaim it, bearish momentum expanded rapidly. Structurally, this confirms that the prior consolidation was distribution rather than continuation.
Now that ETH has reached the support zone, downside momentum is beginning to slow. Long lower wicks and reduced follow-through suggest sell-side exhaustion, opening the door for a technical bounce. In bearish or corrective environments, this type of reaction is common once price reaches a higher-timeframe demand area.
However, any upside from this level should be treated as corrective by default. The first upside objective sits near 3,150–3,170, followed by the more critical 3,220 resistance zone, which now represents the key decision area. A move back into this zone would be a mean-reversion rally unless price can reclaim it with acceptance and strong follow-through.
As long as ETH remains below the former resistance and under the EMA, the broader bias stays bearish to neutral, despite the likelihood of a short-term bounce. Only a clean reclaim of resistance would invalidate the downside continuation thesis and suggest that the sell-off was a false move.
In summary, Ethereum is currently reacting at demand after an impulsive breakdown. A relief bounce is technically justified, but unless structure is reclaimed, this move should be read as a pause within bearish control rather than the start of a new bullish trend.

Gold Is Breaking Price Discovery – Pullbacks Are Fuel New ATHOn the H1 timeframe, Gold has just delivered a clean impulsive breakout, pushing the market into price discovery territory. The strength of this move is evident not only in the vertical expansion, but also in how decisively price has left prior value behind. This behavior signals aggressive institutional participation rather than short-term speculation.
The breakout leg has already respected key Fibonacci expansion levels, with price reacting near the 0.618 and pressing toward the 1.618 extension zone around 4,768. Importantly, this is occurring without any meaningful distribution a strong sign that buyers remain firmly in control. In trending markets, this type of structure often leads to continuation rather than reversal.
That said, after such a sharp impulse, a corrective pullback is both healthy and expected. The highlighted demand zone around 4,660–4,680 represents the first high probability area where price may rebalance. This zone aligns with prior breakout structure and unfilled demand, making it a logical level for buyers to defend.
Below that, the large price gap acts as a deeper liquidity magnet in the event of an extended correction. However, unless Gold decisively breaks and holds below the demand zone, any retracement into this area should be viewed as re-accumulation, not weakness. Strong trends often revisit demand only to reload before the next expansion leg.
If buyers successfully defend demand and price reclaims momentum, the path toward new all-time highs above 4,768 opens quickly. In price discovery environments, resistance is psychological rather than technical, and extensions can travel further and faster than most expect.
In summary, Gold is not topping it is transitioning into a new expansion phase. Pullbacks are part of the process, not a threat to the trend. As long as demand holds, the dominant bias remains bullish, with higher highs and continued price discovery firmly on the table.

GBPAUD - END OF THE RANGE THE SELL OF BEGINS?As per previous posts - GBPAUD is struggling to hold within the range above - we can see yesterdays daily candle reject the of the support now turned resistance, todays price action we made a second attempt to break higher but failed and are continuing to trade out of the range.
I am expecting a huge drop in the pair towards TP - 1.97831

Gold Continue Bullish?Last week, the bearish configuration on Gold was not complete, and eventually the bearish setup was invalidated. This week, we are looking for potential buy opportunities. On the H1 timeframe, a minor whipsaw configuration has already formed, serving as a signal for trend continuation.

EURUSD Short: Supply Holds, Bears in Control, Move To 1.1550Hello traders! Here’s a clear technical breakdown of EURUSD (3H) based on the current chart structure. EURUSD initially traded within a consolidation range, where price moved sideways after a prior decline, indicating temporary equilibrium between buyers and sellers. This range acted as a base for the next directional move. A confirmed breakout from the range triggered a bullish recovery, shifting short-term control to buyers. Following the breakout, price developed a well-defined ascending channel, marked by consistent higher highs and higher lows. Pullbacks during this phase were corrective and respected the channel structure, confirming sustained bullish momentum. However, as EURUSD approached the upper boundary of the channel, upside strength began to fade. A fake breakout above channel resistance signaled buyer exhaustion and increasing sell-side pressure at higher prices. Near the highs, price formed a clear rounding top pattern around a key pivot point, reflecting a gradual loss of bullish momentum rather than an impulsive reversal. This topping structure was followed by a breakdown below internal support, confirming a short-term shift in market control. After losing the ascending structure, EURUSD transitioned into a descending channel, establishing a bearish corrective phase characterized by lower highs and lower lows.
Currently, EURUSD is trading within the descending channel and moving toward a key Demand Zone around 1.1550, which aligns with previous structural support and historical reactions. This zone represents the next important area where selling momentum may slow and buyers could attempt a defensive response.
My primary scenario remains bearish as long as EURUSD stays below the 1.1680 Supply Zone and continues to respect the descending channel structure. Pullbacks into supply that show rejection can be viewed as potential continuation opportunities, with 1.1550 Demand Zone acting as the first downside target (TP1). A clean breakdown and acceptance below 1.1550 would open the door for a deeper bearish continuation toward lower demand levels. However, a strong bullish breakout and sustained acceptance above 1.1680 would invalidate the short bias and signal a possible transition back into consolidation or bullish recovery. Until such a breakout occurs, market structure favors sellers, and upside moves are considered corrective. Manage your risk!
