ANKR 6.72 RRTook a way too speculative trade a couple of days earlier and lost it.
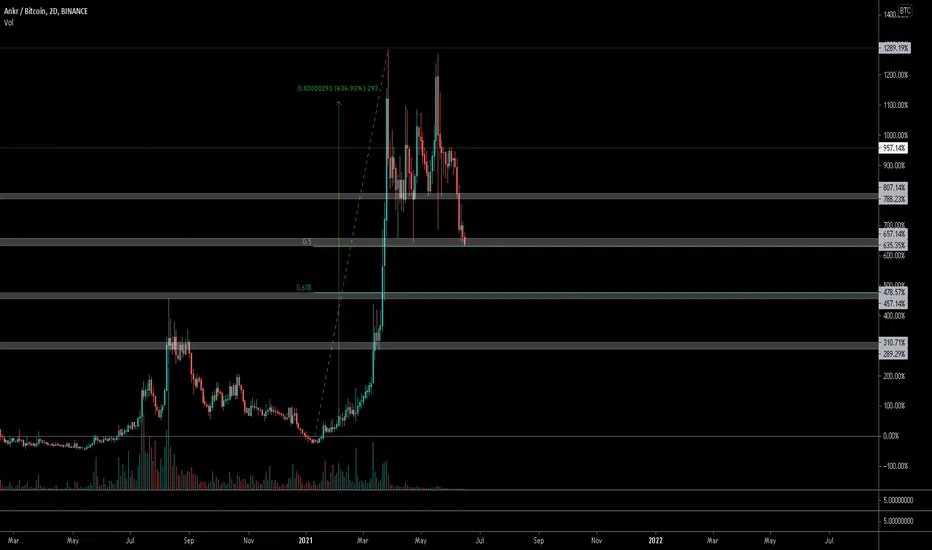
Took a deeper look at ankr and the way it moves up it does it through bull flag like behaviour. If this is the case right now then Ankr has done it 3 waves inside the flag. Time to break it. Took a look on btc pair and it suggests that at least a counter move up is incoming which should be enough to get to the other side of neckline. Target ir HS my fibs are saying there is a confluence as well. VPB suggest if we get it up and running it might run to the target pretty fast as there is just air between neck and target. Normally I wouldnt take this but BTC D chart kinda gives us a hint that alts will keep running in the near future. A bet more about alts will run in general.
Ankr

ANKR stuck...ANKR is stuck in range for 14 days... It could break explosively... set alarms, don't miss it

ANKR Closes Above Key Month Long Level of Resistance on Daily ChANKR has finally closed above a key level of resistance on the daily chart. This is most likely a signal that bullish prices are in the future. Only level of resistance left to tackle is the 20 week SMA. Will update this idea as time goes on.

40% possible opportunity !Strong Fundamentals in the next few days are coming for $ANKRUSDT!
Possible scalping, buy zone from 0.098500 and sell on 0.137367$


ANKRConditions are quite bullish.
Shopping for short-term target looks very appealing
Be sure to monitor

ANKR News AnalysisI predict with the best probability the future trends, my ideas are reserved for the experienced trader. #UniversTrader

ANKR possible up trendI've been studying ANKR movements and doing my analysis.
This is the short story about it.
Good luck to all.
This is not an investment advise, is just my analysis, i'm not a financial adviser, u should do your own research about it. COINBASE:ANKREUR


Ankr/Usdt long term as we see we break above the ema ribbon and we are staying above it and we expecting a macd bullish crossover " the last time we had one it pulled a +x10 move" and we bottomed in the stoch rsi and that means that we are oversold
for me i expect for ankr/usdt to break the resistance and make an new all time high and pull a x10 move

$ANKR - Will we see 15cents again?!BINANCE:ANKRUSDT
$ANKR looks bullish again, will we see 15cents again ?!
NOT Financial advise

ANKR/BTC buy opportunityHi followers,
ANKRBTC Formed beautiful double bottom, which followed by structure breakout with higher low.
We may be ready for the next big move up, let me know what do you think?
Don't forget to manage your risk! 👌
Good luck and trade with care 🙏
If you like my content - 👍 Like, 💬 comment, 👆 follow and 👉 share!
❗❗❗
Disclaimer: This information is not a recommendation to BUY or SELL. It is to be used for educational purposes only!

ANKR - Are We Ready To Break Out??ANKRUSDT has been in a descending channel since late February. It appears to be respecting the channel as we've seen rejections on both extremes of the channel.
Recently we've seen a double bottom which is often a reversal pattern. This could indicate that we may be breaking out very soon. Watching this one closely to see if we can break the structure level and channel.

Bullish Sign if ANKR can Close Above 1.618 Fib LevelOur July Monthly Candle will be close in a little under 6 days. If the crypto market and ANKR specifically can continue the current bullish march and close the month candle above this key Fibonacci level then that will be a signal for a bullish continuation!
Will post updates!


great buying opportunities in crypto market comingAnkr, with 5 waves up, I am looking for pull backs in wave c to buy Ankr
Invalidation level comes in at 0.045, as long as this level hold I am bullish
Blue box is the buying box where I will be looking to add to my position

MATIC/TRY-Expect breakout with arrow.
*Please share your opinion on it, write in the comments.
Teşekkürler.

ANKR/USDT- 200EMA hold well.
- Cross below 200 EMA.
- Descending Triangle.
*Please share your opinion on it, write in the comments.
Teşekkürler.

ANKR is ready to rip hard (~840% upside potential)Reason:
Big symmetrical triangle daily chart.
Bullish market sentiment.
New upside cycle.
Please like & share.

Short - ANKRShort,
Reasons
Supply zone touched (grey box) confluent bearish trend in HTF
Targets and invalidation point in the chart
Risk 2%

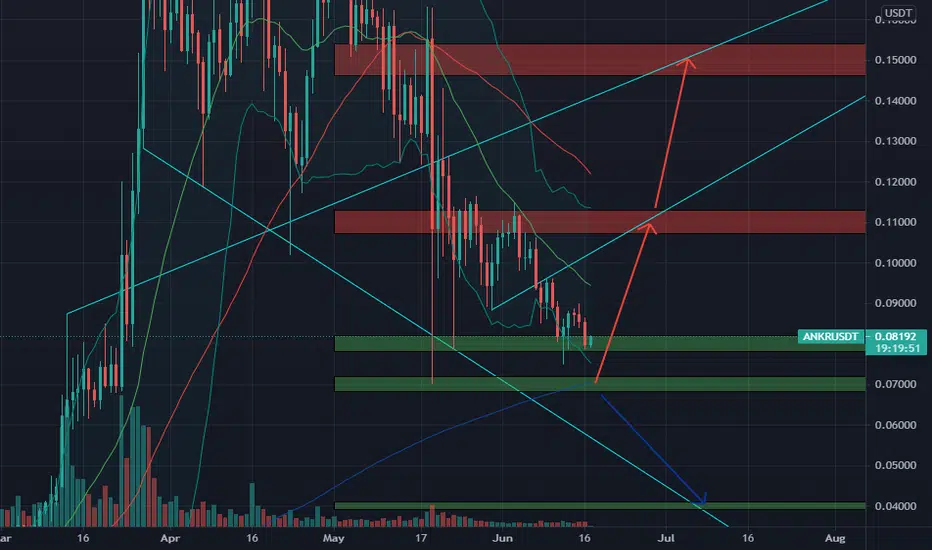
🆓Ankr (ANKR) June-17 #ANKR $ANKR$0.07 and $0.08 are reliable support zones of ANKR so that a strong buying force can appear and create a strong rally for ANKR to $0.11 and $0.15 zones in June and early July. The risk is quite low, but if ANKR loses the $0.07 zone, it will continue a strong downtrend to the $0.04 zone.
📈BUY
🔴Buy : 0.078-0.082$
🔴Buy : 0.068-0.072$. SL if B
📉SELL
🔴Sell : 0.107-0.113$. SL if A
🔴Sell : 0.146-0.154$. SL if A
♻️BACK-UP
🔵Sell : 0.068-0.072$ if B. SL if A
🔵Buy : 0.039-0.041$. SL if B
❓Details
🕯Timeframe : 1 Day
📈Red Arrow : Main Direction as BUY and SELL section
📉Blue Arrow : Back-Up Direction as BACK-UP section
🟩Green zone : Support zone as BUY section
🟥Red zone : Resistance zone as SELL section
🅰️A : The Close price of candlestick is Above the zone
🅱️B : The Close price of candlestick is Below the zone

$ANKR, Just chilling regarding Alts till its time to play..$ANKR
Just chilling regarding Alts till its time to play with them again..
Looking for next UCTS Buy here but 1st I think we will see some more downside (+/- .618 fib)
#ANKR