Upward Resistance Still At Play, A Taste Of Something DifferentP action is back in the consolidation zone rising 0.69% but that is hardly the bulls taking control... Although they’ve had two positive days which leads to momentum as volume with orders dropped for the last two days has considerably increased since a pathetic 18,000,000,000 over the weekend. Take note of this past and where P action transpires, this still needs to see more orders drop if price gets to the 9800-9900 to blast through 10k, once again a lot of resistance and see the last write up.
Inner Perspective (4hr Chart)
I don’t show all of what I look at on the charts as there is too much to list and point out, what you see is about 5% of the overall plan, yet it gives an outer perspective before I dive into define levels to take profit and stop placement when trailing (dependant on strategy) Thus I think it’s unfair to the reader to assume too much and this is simply a guide from one traders perspective relative to all the others playing in this market.
That being said ,the following is different from my usual trend lines. When certain areas of focus come out I’ll define them and see how they play out, as per what’s on the screen as seen here with the triangle that price could flow within and apex. The lower trend line is much stronger here than the above only having two touches at present. I’m not saying this is going to play-out, just something I’m watching with everything else.
At present we are back in the consolidation zone and like Monday’s write up, this maker needs to push $200 out of it before I consider anything new off interest.
See above published picture
Happy Trading :)
Bitcoin to Date
Daily
Current Price: $9499.8 USD
Daily Change %: +0.69%
Market Cap: $175,421,313,445.63 USD
24 Hour Volume: $26,614,854,328 USD
Population of the World: ~7,791,832,800+ humans
Today’s Bitcoin Total / World Population: ~ 0.002362142927686 Satoshi’s / $22.31 USD per person
Overall
Approximate Bitcoin in Circulation: 18,406,694 BTC
Approximate Bitcoin Mined Last 24hr: ~ 900 BTC
Approximate Bitcoin Left to Mine: 2,593,306 BTC
Road to 21,000,000 Bitcoin Mined: 87.65%
Current Bitcoin Dominance: 66.44%
📈Support & Resistance📉*
Support Levels
1st Support Zone: 9170.7
2nd Support Zone: 8666.7
3rd Support Zone: 7840.4
Resistance Levels:
1st Resistance Zone: 9889.2
2nd Resistance Zone: 10285.8
3rd Resistance Zone: 10781.2
Price Level Consideration
Approximate Days Until Halving: 1423 Days (Pending Timezone / Blocks Mined)
All Time High Half Way Point: 9942.5
Prominent High: 13767.4
Prominent Low: 3994.1
🐃 Bulls Verse Bears 🐻
🐃 Bullish Above: 10485.8
🐻 Bearish Below: 6474.1
Monthly & Weekly Opens
Monthly Open: 9447.2
Weekly Open: 9349.8
Current Price Zone: ACCUMULATION ZONE
Biggest Bitcoin Transaction of the Day**
1. 🚨2,963 BTC ($28,184,743 USD) transferred from Binance ➡️ Unknown wallet 🚨
2. 🚨1,100 BTC ($10,508,601 USD) transferred from OKEx ➡️ Binance🚨
3. 🚨1,099 BTC ($10,412,141 USD) transferred from Unknown wallet ➡️ OKEx 🚨
Largest Cryptocurrency Transaction Today:
🚨 🚨29,999,999 USDT ($29,982,469 USD) transferred from Poloniex ➡️ Tehter Treasury 🚨 🚨
Gold***: $1,727.51 USD -0.09 -0.01%
Silver***: $17.47 USD +0.05 +0.30%
——————————————————————————————————
*📈Support & Resistance📉: These are typically zones & not exact price levels depicted by the lines. Keep in mind that price may respect and repeatedly touch several times on smaller time frames.
**What you won’t see on exchanges: This is purely to reference that traders watching the charts are neglecting the ‘Transaction Sentiment’ of large (🐳 WHALE) transactions from wallet to wallet and OTC execution send transactions (new/old wallets). TIP: The amount/s transferred daily tells a story of flow to potential market dynamics that may transpire.
*** Personally I HODL Gold/Crypto over having a majority of Fiat currency 💸. Previously before trading crypto in 2015, Gold was one of my main charts thus I look at the price regularly comparative to Bitcoin.
Created & published by Des Landen
Landen International
Playlist: Daft Punk - Alive 2007
Apex

IOTXBTC | Descending Triangle | Apex | Trade Setup Todays chart – IOTXBTC – testing resistance of the descending triangle formation as it nears the apex.
Points to consider:
- support and resistances converging (apex)
- Trend bearish (consecutive lower highs)
- Bullish Price action (testing resistance)
- Support confluence
- RSI above 50
- Low volume
IOTX has formed a mature descending triangle (typically considered a bearish formation) however price action is showing strength with multiple breakout attempts as it nears the apex.
Structural support and the 200 EMA being in confluence puts a strong emphasis on the level being a strong support zone.
RSI trading above 50 showing strength in the market supporting the bullish bias.
The volume is clearly declining, an indication that an influx is imminent coinciding with the probable breakout
Overall, in my opinion, IOTX needs to break and retest structural resistance with volume follow through for a valid long trade to structural resistance.
What are your thoughts? Let me know in the comments below!
Be sure to leave a like and follow me for daily chart updates.
As always, focus on you - and the money will too!

DASHUSDT | Impending Breakout | Apex | Symmetrical Triangle Todays Analysis – DASHUSDT – Consolidating in a symmetrical triangle, nearing its apex where a breakout is probable.
Points to consider:
Multi-confluence resistance cluster
Support and resistance converging (Apex)
Declining volume
RSI showing weakness
DASHUSDT has been in a multi-week no trend scenario, trading within a contracting range where resistance is being held by the 200 EMA and .5 Fibonacci retracement.
Volume has also been on a steady decline, indication of an influx being imminent, possibly coinciding with the breakout.
RSI is also below 50 showing weakness in the market.
Overall, in my opinion, a break in either direction is impending. The break needs to be backed with increasing volume to solidify legitimacy and avoid any fake outs.

ETHBTC Double Bottom| Apex| Lower Highs|Break Imminent Evening Traders,
Today’s Analysis – ETHBTC – Trading at key structure, daily structural support is in confluence with down the down sloping resistance, ETHBTC is in its Apex.
Points to consider,
- Double bottom trend
- Trend line resistance (Lower highs)
- Daily Structural Support
- Stochastics overextended
- Apex (break imminent)
ETHBTC is trying to establish a trend chance by putting in a valid double bottom . Breaking resistance will further solidify the double bottom as the neckline will be breached.
This will also negate the lower high projection
Daily structural support is in confluence with resistance, hence why ETHBTC is coiled up in its apex.
This is an indication of a break being imminent.
The stochastics is in the upper regions, a lot of stored momentum to the downside. ETHBTC usually has an impulse move down with stochastic momentum from current resistance.
Overall, in my opinion, ETHBTC is at pivotal point in the chart, price is coiled up in its Apex , indicating a volatile move being imminent. Break in either direction will give a direction bias for a long
or short.
Breaking bearish will be a sign of a possible larger pattern being at play, the Descending Triangle
What are your thoughts?
Please leave a like and comment,
And remember,
“The desire for constant action irrespective of underlying conditions is responsible for many losses in Wall Street.” – Jesse Livermore

SNTBTC | Apex Zone | Healthy Trend | Low Volume Todays chart - SNTBTC – Respecting a healthy uptrend, impending the apex zone where a breakout is most probable.
Points to consider:
- Nearing its Apex
- Volume Declining
- RSI breaking 50
- 55 EMA (visual support)
SNT BTC trading into trend resistance, historically leading to impulsive breakouts.
Volume has clearly subsided, indicating an influx being imminent, this will coincide with the possible breakout.
The RSI is attempting to cross above 50, trading beyond this level will indicate increasing strength in the market.
The 55 EMA will act as a visual guide; price trading above this indicator will support the bullish bias
Overall, in my opinion, SNT needs to respect the local trend where a bullish breakout is expected validating technical targets above.

BTCUSD | Bull Trap| Resistance Cluster| Apex| Low Volume Evening Traders,
Toady’s Analysis – BTCUSD – establishing a bull trap, now trading back into its apex where a breakout is probable
Points to consider,
- Strong resistance cluster (Bull trap)
- Support and resistances converging (Apex)
- RSI and Stochastics showing weakness
- Volume declining
BTCUSD has had a sharp sell off at resistance cluster, trapping long buyers. The significance of this resistance cluster has now been solidified three times.
The local support and resistance are converging; a price break in either direction will be imminent.
The RSI and stochastics are both below 50, showing immediate weakness in the market.
Volume is clearly declining, indication of an influx being imminent, this will coincide with the possible breakout.
Overall, in my opinion, a break in either direction is imminent; the probability down is greater due to the recent impulse sell. The break needs to be backed with increasing volume to avoid any fake outs.
What are your thoughts?
Please leave a like and comment,
And remember,
“People normally describe this kind of internal mental shift as an “ah, ha” experience, or the moment when the light goes on. Everyone has had these kinds of experiences, and there are some common qualities associated with them. First, we usually feel different. The world even seems different, as if it had suddenly changed. Typically, we might say at the moment of the breakthrough something like, “Why didn’t you tell me this before?” or, “It was right in front of me the whole time, but I just didn’t see it” ― Mark Douglas

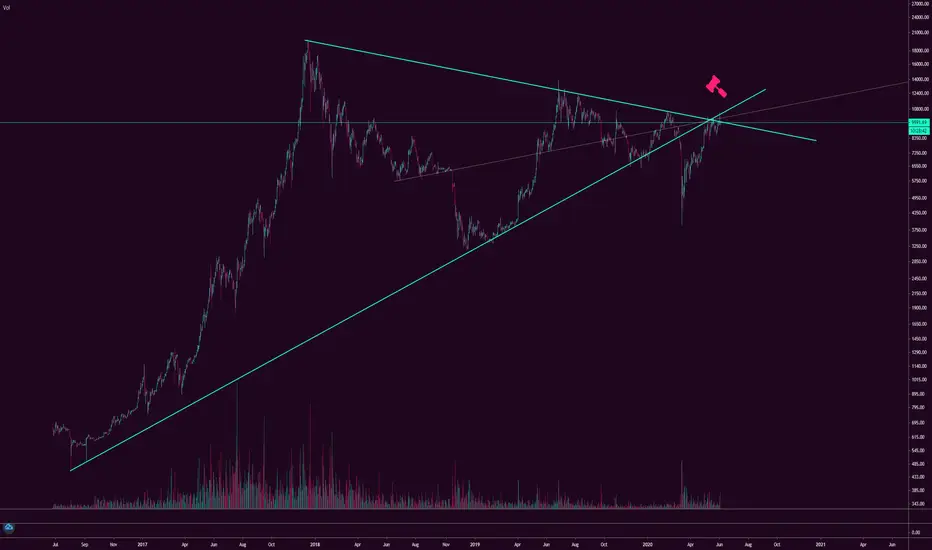
Back to the basics again.Trend line broken, retest of the trendline from below right on the apex of 3 important trend lines.
Sentiment is abnormally bullish for this kinda price action, so I have to act exactly opposite of the herd.
BTCUSD Falling Wedge Breakout|Local Resistance|Declining VolumeEvening Traders,
Today’s Analysis – BTCUSD – forming a falling wedge pattern that is YET to be confirmed. A break of resistance needs to come to fruition before a long trade.
Points to consider,
- Bullish falling wedge
- Apex approaching
- Demand Zone (Strong support cluster)
- RSI below 50
- Stochastics projecting higher lows
- Volume Declining
The local trend is in a falling wedge formation that will break in either direction as the immediate support and resistance converge.
The formation is bullish so the probability of breaking up is higher.
BTC has a strong demand zone, a historic cluster where price is likely to wick down if the wedge breaks bearish.
The RSI is currently below 50; bias is still bearish in the market, however the stochastics is projecting higher lows.
Initial indication of momentum shifting in the shorter term
The volume is clearly declining; indication of an influx being imminent which further solidifies that BTCUSD is in a true pattern.
Overall, in my opinion, a break will occur, leading to a trade opportunity. A break bullish needs to be back with increasing volume. The technical target of the falling wedge is in confluence with the current local resistance.
What are your thoughts?
Please leave a like and comment,
“There is no single market secret to discover, no single correct way to trade the markets. Those seeking the one true answer to the markets haven’t even gotten as far as asking the right question, let alone getting the right answer.” – Jack Schwager

Learn The APEX Thursday Trading SystemThe APEX Thursday trading system. Is so simple to do, and yet so
powerful. Thursday hold such power if you know what to look for.
This video teaches you the in and outs of The APEX Simple System:
- 3 days uptrend or downtrend.
- We always break last weeks high/low at latest Wednesday
- Add a line of Wednesday body high/low
- Wait for the shop to drop on Thursday
- Wait for your engulf from London and onwards.
- Partial close or take 50 pips for FX. (Modify on Index / Commodities)
...rinse and repeat.

BTCUSD Breakout Trade|Watch Price Action| Apex| Low Volume Evening Traders,
Today’s Technical Analysis – BTCUSD – a breakout is imminent as support and resistances converge.
Points to consider,
- $10,000 Psychological Resistance
- Up sloping support
- Declining volume (Apex)
- Range Median
- RSI above 50
- Stochastics equilibrium
BTCUSD’s current price is above its range median, .50, currently trading under the all important $10,000 Psychological resistance. BTCUSD is respecting its up sloping support; price is being pushed into its apex where a break will occur.
The RSI is above 50, indication of a bullish bias in the market, however NOT confirmed, we need further development.
Stochastics is coiling in equilibrium; momentum for the break is stored in both directions.
BTCUSD volume nodes are declining, an indication of an influx being imminent, this will be more likely when price breaks either key technical level, the $10,000 Psychological resistance and or up sloping support.
Overall, in my opinion, BTCUSD will have a break in the coming hours; a trade will be validated upon the direction of the break. It is important to monitor price action and volume leading up to the break as this will help avoid fake outs.
What are your thoughts?
Join me on twitter for live market updates!
And remember,
“Remember our definition of a winning attitude: a positive expectation of your efforts with an acceptance that whatever results you get are a perfect reflection of your level of development and what you need to learn to do better.”
― Mark Douglas

USDCHF Equilibrium| Structural Resistance| Declining Volume Today’s Technical Analysis – USDCHF- trading in equilibrium where a break is imminent
Points to consider,
- Structural resistance (bearish retest)
- Declining volume
- Apex
- RSI at 50
A break in USDCHF will be imminent as price continues to reach its apex. The support and resistance lines will converge leading into a break in structure.
The structural resistance is a key level, a bearish retest will allow for a valid short. It is important to monitor how price action forms at the level as weakness will indicate a possible liquidity grab.
Volume is clearly declining, which is an indication of a true equilibrium. A breakout needs to be backed with increasing volume; this will decrease the probability of a false breakout.
Overall, in my opinion, if USDCHF breaks bullish, its immediate target will be structural resistance. If price action shows weakness and confirms a bearish retest, lower level will then be likely.
What are your thoughts?
Please leave a like and comment,
And remember,
“Do not anticipate and move without market confirmation—being a little late in your trade is your insurance that you are right or wrong.” -Jesse Livermore

Oil To APEX After breaking out of price consolidation (yellow rectangle) it’s crucial that the bulls keep oil above this price point and move to the apex depicted in the chart. A break of the inner upward Trend line will see oil back into the consolidation point so its imperative that the Bulls keep at these levels or above. A Rise to 32 (R1) will see some bears to contend with. This P action will show strength and solidify the second point to maybe see a parallel channel upward form/ing.
📈Support & Resistance📉*
Support Levels
1st Support Zone: 23.41
2nd Support Zone: 17.80
3rd Support Zone: 12.94
Resistance Levels:
1st Resistance Zone: 28.71
2nd Resistance Zone: 37.62
3rd Resistance Zone: 42.11
Price Level Consideration
ATH: 147.27
All Time High Half Way Point: 73.64
Prominent High: 65.53
Prominent Low: ZERO
🐃 Bulls Verse Bears 🐻
🐃 Bullish above: 77.04
🐻 Bearish below: BEARISH at the moment
Monthly & Weekly Opens
Monthly Open:18.86
Weekly Open: 29.78

APEX FROZEN - OBSERVE PRICE ACTION NEAR 175-170 levelsAPEX FROZEN - OBSERVE PRICE ACTION NEAR 175-170 levels
The structure of stock still looks weak, so currently its better to avoid any trading in it, though it has created a good support zone near 170 levels, hence any pullback towards this level has to observe carefully to find any trading opportunity in the stock


USDCHF Symmetrical Triangle|Low Volume|Apex|Breakout Imminent Evening Traders,
Today’s Technical Analysis – USDCHF- a clear symmetrical triangle at pay, price is approaching its apex before an imminent break.
Points to consider,
- Trend Bullish (Consecutive higher lows)
- Support and Resistances converging
- RSI neutral (Above 50)
- Stochastics in upper regions
- Volume declining
The immediate trend is bullish with consecutive lower highs from local bottom. Price is finding its equilibrium in this larger symmetrical triangle as support and resistance converge.
The RSI is neutral above 50 whilst the stochastics is in the upper regions, an indication of buy momentum still being present.
Volume is clearly declining as price is reaching its apex of the symmetrical triangle; this is an indication of an influx in volume.
Overall, in my opinion, a breakout is imminent, very tradeable, price is coming close to its apex as support and resistance converge.
What are your thoughts?
Telegram Link in Bio – Please Join :)
And remember,
“You become fearful the moment you identify with fear. But once you begin seeing it as an impersonal changing phenomenon, you become free.” ― Yvan Byeajee

S&P 500 futures pending supply, intraday trading is the planS&P 500 futures ( CME_MINI:ES1! ) slide more than 1% in the Asia session after OPEC plus reached a deal in record oil production cut of 9.7 million barrels per day.
On the hourly timeframe, S&P 500 futures dropped sharply at the opening candle to below the support level at 2750. Subsequently it is forming an apex formation during London session, suggests indecisiveness among the participants.
Just 2 hours before the opening of the US markets, ES broke out from the apex formation and currently testing the resistance zone around 2770 and the opening candle today.
If the price action fails to commit above 2770 and broke below 2750, it is likely to swing down to test the next support level at 2700.
Should the supply emerge, this could be a start of a larger down move to test the support at low levels or even the selling climax low at 2174.
Bias - neutral to slightly bearish.
Key levels - Resistance: 2800 Support: 2750, 2700, 2630
Potential setup for S&P 500 futures -pay attention to how the price interacts with the apex formation. Either direction be traded. Always judge the market by its own action.


Diamond Continuation Pattern| Low volume| Bullish Continuation?Hello Traders,
Today’s chart update will on BTC’s immediate projection- we have a probable diamond formation which serves as a bullish continuation pattern.
Points to consider
- Trend travelling into apex
- .382 Fibonacci as local support
- RSI respecting trend
- Stochastics in lower regions
- Volume declining
- VPVR area being tested
BTC is closing in on its apex signalling a break from this formation is imminent as local support and resistances converge. Local support is the .382 Fibonacci; BTC has been respecting this level as buy pressure is evident.
The RSI is respecting its trend line, must hold for a bullish bias as this is in confluence with the stochastics being in lower regions. It can stay trading there for an extended period of time, however lots of stored momentum to the upside.
Volume is clearly declining; increase is highly probable upon breaking out of the Diamond formation. The VPVR confirms the .382 being a strong trade location for buy pressure.
Overall, in my opinion, a break bullish is probable as the Diamond Pattern serves as a bullish continuation pattern. BTC may have one more leg up before a proper correction as this trend is getting more extended.
What are your thoughts?
Please leave a like and comment,
And remember,
“The big ones take the psychology out of the game. Have a game plan, and stick to it.” Tim Erber

BTCUSD OVER 10K! Parabola | Blow of top?| .618 Fibonacci!Hello Traders!
Today’s chart update will be on BTCUSD where we have a parabola forming, closing on a key Fibonacci retracement level indicating a probable blow of top.
Points to consider,
- Trend broke key resistance - .382 Fibonacci
- Structural resistance in confluence with .618 Fibonacci
- Strong support from 20 week MA
- RSI entering overbought
- Stochastics in upper regions
BTC managed to break key resistance with a valid retest confirming the S/R flip on the .382 Fibonacci level before taking of further. The structural resistance can be the potential target for the parabola as this level is in confluence with the .618 Fibonacci.
The RSI has broken key resistance and now has entered overbought conditions on the daily timeframe. The Stochastics is currently in the upper regions, it can stay trading here for an extended period of time, however lots of stored momentum to the downside.
The 20 week Moving Average as a very good visual guide as it has held significance as support since bitcoins initial bull move, a break will essentially indicate a probable reversal.
Overall, in my opinion, BTCUSD is in the latter part of the parabola, its apex ends exactly at the .618 Fibonacci where the potential reversal may occur. The 20 week MA is a strong indication of the current direction of this trend, a break of this will greatly increase the probability of a correction, which is imminent at some point.
What are your thoughts?
Please leave a like and comment,
And remember,
“Trading mastery is a state of complete acceptance of probability, not a state of fight it.”
― Yvan Byeajee

Nearing Apex, high insider buying & a HEMP playArcadia Biosciences, Inc.
Highlights:
Insider Trans 324.51%
Market Cap 49.80M
Shs Float 7.01M
Consensus Price Target: $17.00 / 195.65% upside
Plenty of catalyst for this kid,
Hemp, soybean, wheat & Nitrogen fertilizer is the name. Easing trade tensions could play a factor in better prices for soybeans and wheat. Already seeing a high demand for Hemp, an end to the cannabis slump could help fuelling RKDA's ascend even further.
Increasing awareness of Sustainibility and interest from investors could be another factor.
* GoodHemp varieties improve plant quality, productivity & reduces waste.
* Their Nitrogen fertilizer is created to significantly reducing fertilizer use which will decrease greenhouse gas emission and chemicals in the ground water.
* HB4 Drought Tolerant Soybeans. These proprietary varieties hold great promise for bringing better yield stability to agriculture in areas that experience chronic water stress problems
Recently launched GOODHEMP, a commercial pipeline of superior non-GMO hemp seed varieties.
USDA guidelines requiring the destruction of “hot crops” with more than 0.3% THC, unstable seeds can lead to huge losses for hemp farmers.
GoodHemp meets compliance requirements because of their ultra-low THC profiles. On top of that, some GoodHemp varieties are also tolerant to a variety of diseases. Resulting in more stable, cost-effective crop and higher profit margin.


Short term view : Consolidation Hello fellas, let's make it a very quick and detail analysis about current bitcoin's condition which is crucial once again. This analysis will cover the bitcoin's potential movement for short term time frame. So, let's enjoy this technical analysis.
Looking at lower time frame which is the 4 hours chart, I see that currently the price is trending closer to the strong area of support which is the golden pocket zone. And this area however is becoming point of interest for most of the long position for bitcoin. This is because at the past performance, we see this area coincides with the previous unbroken support that always produced the huge wick to the downside (Although we saw a drop below it for about 1 day to form inverse head pattern). On the other hand, since the height on November 29th, 2019 , we can see that the price always formed a lower high which means a lot of pressure is coming from the bear.
So, the conclusion is that although the price trends just slightly above the strong support in short term, I don't think that there will be a huge rally in near future, simply because the lower high structure is still holding strong and the price must respect the resistance trend line as potential upper line that could be the candidate of triangle. I do believe, we will see a losing in volatility of bitcoin's movement at least in the next 1 or 2 days until the price can breaks the APEX of the triangle.
So, for now just enjoy your profit from shorting bitcoin!

ZOOMING OUT BTC (W)Zooming out to see a little bigger picture and fun ideas for BITFINEX:BTCUSD
Weekly
Daily is below
