Apple remains bullish, but consolidation/pullback likelyApple stock continues to trade in a ascending channel that has been intact since 2019. The stock has continually made higher highs; however, RSI bearish divergence has deepen, warning of larger pullback or at least a period of consolidation. Last time we saw similar divergence in the stock, the asset fell $50. All in all, traders should watch short term support at $250, before a potential larger pullback.
Appleanalysis

Apple Next MoveApple Index
- Rising Wedge as an corrective pattern in Short Time Frame
- Change of Characteristics
- Completed " 12 " Impulsive Waves
- Break of Structure
- Fibonacci Level - 261.80%

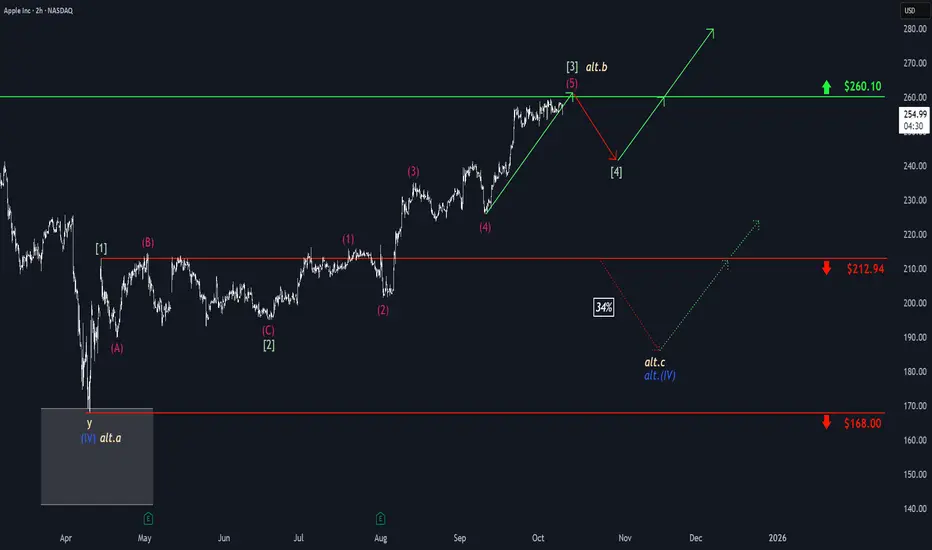
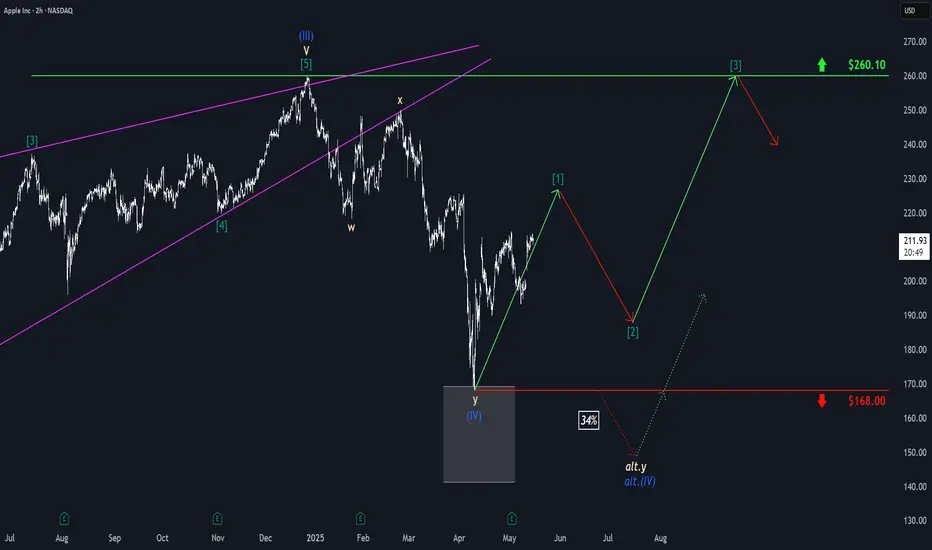
Apple: New All-Time High as Low Is Adjusted Apple has recently seen a period of heightened volatility, marked by sharp gains and notable pullbacks. In response to the latest price action, we’ve made a slight adjustment to our wave count and revised the low for magenta wave (4). We’re now allowing for magenta wave (5) to break above the $260.10 resistance level, which would complete green wave . Our alternative scenario, which carries a 34% probability, still calls for a new corrective low in blue wave alt.(IV). In this case, Apple would have just finished beige wave alt.b slightly above $260.10 and would next decline in wave alt.c, falling below support at $212.94. Even so, the alternative corrective low would remain above the $168 level.

Apple: Rally Has a Bit More Room to RunApple’s upward momentum has clearly slowed at the $260.10 resistance level, though the stock has already come very close to this mark. As a result, we’re allowing for a bit more room for green wave to run in the near term, with the possibility that AAPL could slightly surpass the $260.10 level. However, a sustained breakout above this resistance is likely only after a pullback in wave . At the same time, there remains a 34% probability that the next peak will mark the end (or has already marked the end) of the corrective upward move in the beige wave alt.b . In this case, we would expect significant sell-offs, with a new corrective low for blue wave alt.(IV) forming between the two support levels at $212.94 and $168.
Apple: Pulling Back, but Uptrend Still IntactApple has recently faced substantial downward pressure, retracing enough to erase the gains made in the first week of September. Our primary outlook is that the stock will soon rebound and, during green wave , rise toward resistance at $260.10. Following a moderate pullback in wave , shares should ultimately break through this level in wave , further advancing the broader upward trend. However, we continue to monitor our 37% likely alternative scenario. In this case, AAPL would have completed beige wave alt.b with its recent peak and could next target a new major low for blue wave alt.(IV) via wave alt.c . Here, the price would fall below support at $201.50 but ideally rebound above the lower mark at $168.

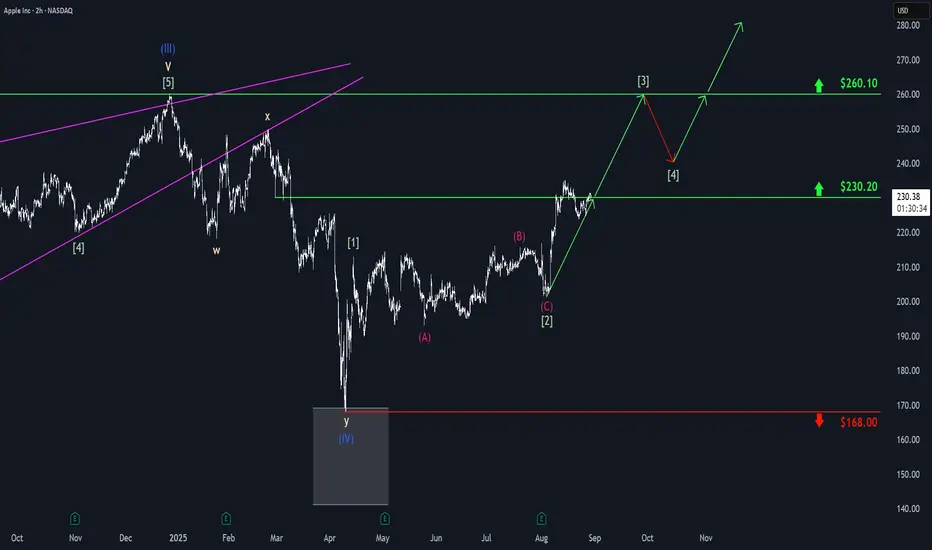
Apple: Another Run at Key ResistanceApple shortly dipped back below the $230.20 mark but has since begun another push higher. We expect the stock to soon break through the $230.20 level sustainably and – as part of the green wave – move up toward the next major resistance at $260.10. The following wave pullback should remain above $230.20, allowing the broader green upward trend to continue gaining momentum.
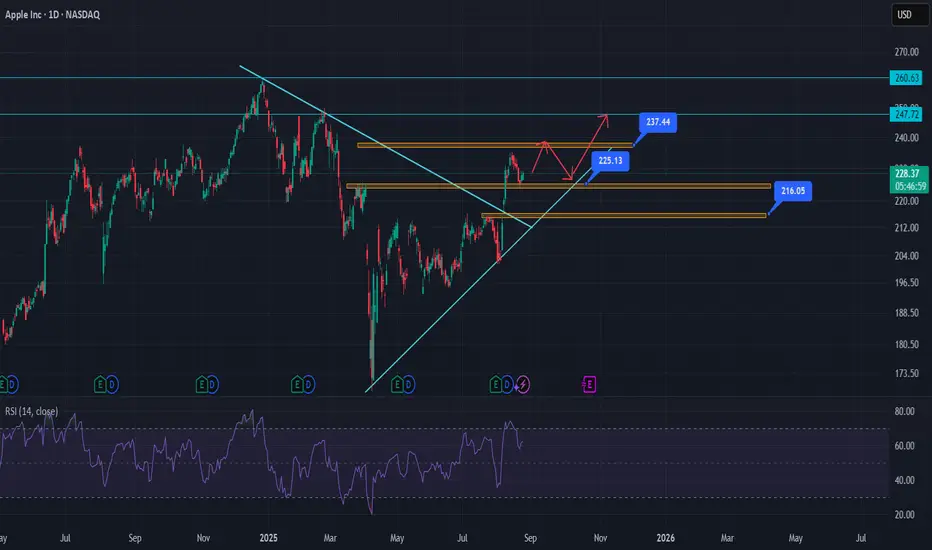
APPL striking for 247$; First 237$ must be brokenAfter breaking the top line of symmetrical triangle, APPL has surpassed 225$ and is heading toward the next resistance line at 237$. As it can be seen on the chart, It's probable that 237$ can be broken and APPL can reach 247$ on daily timeframe.
But first I believe it will bounce back from 237$ to 225$ and its bullish trendline to start the major bullish trend.
AAPL Eyeing \$240 Breakout — Don’t Miss This Move
🚀 **AAPL Eyeing \$240 Breakout — Calls Lined Up for 100%+ Move** 📈
💎 Weekly sentiment: **STRONG BULLISH** (Call/Put = 1.86)
📊 RSI: Daily 77.7 | Weekly 59.8 | Volume 1.3x ↑ (Institutional Buying Confirmed)
🔥 VIX: 15.15 (Low Volatility = Green Light)
🎯 **Trade Setup**
* Type: **Call** (Long)
* Strike: **\$240.00**
* Expiry: **2025-08-15**
* Entry: \$0.65 | PT: \$1.30 | SL: \$0.32
* Confidence: **85%** | Timing: Open
Apple: More Room to RunWe still allow more room for Apple’s magenta wave (B) to extend upward before wave (C) takes over, pulling the stock toward the low of green wave . Thereafter, green wave should start (above $168) and initiate the next advance, lifting the stock toward resistance at $260.10. A break below $168, however, would activate our alternative scenario, in which blue wave alt.(IV) targets a deeper low (32% probability).
📈 Over 190 precise analyses, clear entry points, and defined Target Zones - that's what we do.

Apple: Wave [1] IntactDespite a significant setback, Apple managed to gather new momentum on the upside and continue its work on the green wave . The impulse structure remains intact, and we expect a new high imminently before the next countermovement with wave follows. The stock should not breach the support at $168 to enable wave to initiate the next upward phase. If the price does fall below the $168 mark, our 34% likely alternative scenario will allow for a new low of wave alt.(IV) in blue, though the rise would also continue after this lower low.
Apple Shares (AAPL) Drop Below $200Apple Shares (AAPL) Drop Below $200
Late last week, Apple released a quarterly report that beat analysts’ expectations:
→ Earnings per share: actual = $1.65, forecast = $1.63
→ Revenue: actual = $95.36bn, forecast = $94.5bn
However, today AAPL stock price is below the psychological $200 mark, over 7% lower than last week’s high (point E).
Why did AAPL shares fall?
According to media reports, investors were concerned about weaker-than-expected services revenue and disappointing sales in China. These factors have renewed fears that the ongoing US–China trade tensions could have a deeper impact on Apple going forward.
Bearish sentiment may also have been amplified by Warren Buffett’s decision to step down as head of Berkshire Hathaway — as we noted yesterday — since his company is one of Apple’s major shareholders.
Technical Analysis of Apple Shares (AAPL)
Key AAPL price action patterns (marked) show a sequence of lower highs and lows, forming the basis for a downward channel. Fibonacci ratios reinforce bearish characteristics in price movements:
→ The rise from B to C is approximately 50% of the decline from A to B
→ The rise from D to E is around 50% of the decline from A to D
This technical picture suggests a potential bear market, where rallies may be corrective rebounds following impulsive drops. This strengthens the scenario in which AAPL shares could continue falling within the established descending channel.
This article represents the opinion of the Companies operating under the FXOpen brand only. It is not to be construed as an offer, solicitation, or recommendation with respect to products and services provided by the Companies operating under the FXOpen brand, nor is it to be considered financial advice.

APPLE, will we see 200$ again ?Hello traders, Hope you're doing great. What are your thoughts about NASDAQ:AAPL ?
for upcoming weeks, I expect an upward correction at first and after that I expect a SELL OFF situation in the market that causes a huge drop in stock market, my first Target is 200$.
This post will be Updated.
Trade Safe and have a great week.

Apple: Top and DropAs part of Apple's ongoing wave (2) correction, we assume that the subordinate turquoise wave X still needs to conclude in the short term before the price can drop into our magenta Target Zone between $209.57 and $196.05. There, we anticipate a bullish reversal, which should offer trading opportunities for the long side and mark the starting point for the next major upward move. Alternatively, there is a 37% chance that the low of wave alt.(2) has already been reached, which will be confirmed if the price surpasses $260.10.

Apple Breaks Downtrend and Key Resistance Ahead of Earnings...!APPLE has broken the downtrend as well as the important resistance level of 237-238 dollars and currently trying to sustain above it just before the earning report. As investors/traders, we should wait till the earning report which will be available on 30 JAN before taking the trade.

Apple: As Expected…Apple has made progress as part of our primary scenario, gradually edging lower toward our magenta Target Zone between $209.57 and $196.05. In this price range, we anticipate the low of the magenta wave (2) and, subsequently, a reversal to the upside. On the other hand, we consider it 37% (previously 40%) likely that AAPL will stage an immediate breakout above the resistance at $260.10 without first reaching our Target Zone.

AAPL Daily: Are We Heading to $272 or Taking a Detour?Hey Mindbloome Family, let’s talk about Apple (AAPL). Here’s what I’m seeing—it’s easy to follow, I promise:
1️⃣ Straight to $272:
If Apple breaks above $258–$260, we could see it head straight to $272.
2️⃣ Pullback, Then Up:
Apple might touch $258–$260, pull back to $253 or $236, and then move up toward $272.
3️⃣ Deeper Drop, Then Recovery:
If we fall to $236–$230, I still think there’s a good chance of bouncing back to $272.
4️⃣ Breakdown Scenario:
If $230 doesn’t hold, we’ll pause, reassess, and come back with a new game plan.
Wellness Tip: Don’t forget to move around! Sitting for too long can drain your energy. A quick walk or stretch can work wonders for your focus.
What do you think—is Apple heading to $272, or will we see a dip first? Let me know! If you want to chat more about this, hit me up in the DMs or check out my profile.
Kris/Mindbloome Exchange
Trade What You See

Apple in ascending triangle, up to 280$ or down to 200$?Apple had a great move up from 165$ to 237$ in only 3 month, but since then price has been oscillating between 200$ and 237$, this oscillation seem to form an ascending triangle.
Since the stock has been moving up in long and short term, the probability that this triangle breaks out to the upside is higher than breaking out to the down side.
Currently the price is sitting at lower level of this triangle and if the pattern holds, we should see the price move up to 237$ in short term. If the price breaks out from there to the upside, then we will be looking at the price target of 280$. On the other hand, if the price breaks out to the down side, the price target is at 200$ where we have a-formerly resistance-support line.
We should also notice that after the April-July bull run we have already seen a retracement to 0.5 level, and the current movement of the price could be seen as the uptrend after the retracement.

APPLE Stock 22% Gain - Profit Target 2 Reached!The APPLE stock price crosses over the Risological swing trader dotted line on on May 3, 2024 giving us a clear bullish trade setup.
LONG Trade Setup
Entry 185.5
Current trailing stop loss at : 203.6
Overall gain from the entry: 22%
Last profit target is at 254.5
Congratulations, who made profit!

Apple - Caution at the all time high!NASDAQ:AAPL just created a new all time high, however we have to be quite careful now.
Trading cycles in an overall uptrend is one of the most profitable trading approaches. You are trying to capitalize on the major upswings and missing out on the major downswings. Apple is currently retesting resistance and probably creating the top of the previous cycle. I am waiting for a move back to support before we will then see the next major bullish cycle on Apple.
Levels to watch: $240, $170
Keep your long term vision,
Philip - BasicTrading

Triple Top Apple going down - ultimately a head and shouldersApple will pierce the 50 and go back to it's latest accumulation area due to coming out with nothing new besides a crappy calculator and hitching it's failing stock (Buffett sold) to the latest bubble fad: AI.
I see Apple ultimately failing because the future will get rid of free business models for "stake holders" - if Biden gets reelected because we will have DIGITALID after the election and CBDC's shortly after that. If Trump gets in we'll morph to a gold standard, and Apple will have one last gasp of an idea that completes the right shoulder before the global economy is lost to global depression because of The Great Reset which is unavoidable due to currencies being ticking time bombs due to the coming sovereign defaults.
This will ultimately push up the dollar to 160+ before imploding itself.
I don't see ANY reason to hold Apple here. Fear and Greed is turning on the Weekly and Greed is losing momentum, RSI turning down and MACD is forming a crossover soon.
I'd buy puts on this: September 130 going for .25, this will return 20x.
NOT FINANCIAL ADVICE

APPLE (AAPL) STOCK ANALYSIS Hello, traders here is an analysis of APPLE as you can see the price has been in a bullish form and it created an ascending triangle pattern that signals a bullish move so now I will wait for the price to break the upper structure of the pattern and retest it (as shown in the chart) then I will look for the long opportunities.

AAPLPair : Apple Index
Description :
Completed " 12345 " Impulsive Waves
Break of Structure
RSI - Divergence
Fibonacci Level - 161.8%
Rising Wedge in Short Time Frame

Testing Vix Cheat Sheet on Apple, 5 days + 4.11%The Viz cheat sheet indicator reveals that if the Vix closes above the upper Bollinger band ($19.01) during the next 5 days that means the Apple stock price will increase by 4.11% to $174. Currently the Vix is around $18.
I've tested this indicator the Vix cheat sheet before with quite impressive results.
