Apple - Going DeeperIt looks like a full five-wave structure has formed.
Waves 1 and 5 are almost equal in size.
We may still see a short push higher, back toward 288 , and then the move down begins.
Alternatively, the decline could start from the current level.
Potential targets:
260 -> 243 -> 229
---
Please subscribe and leave a comment.
You’ll get new information faster than anyone else.
---
Appleinc

Asset Sold: Apple IncAsset Sold: Apple Inc
Symbol: AAPL
Exchange: US
Sold at Market Value: US $259.15
Date: 10-Jan-2025

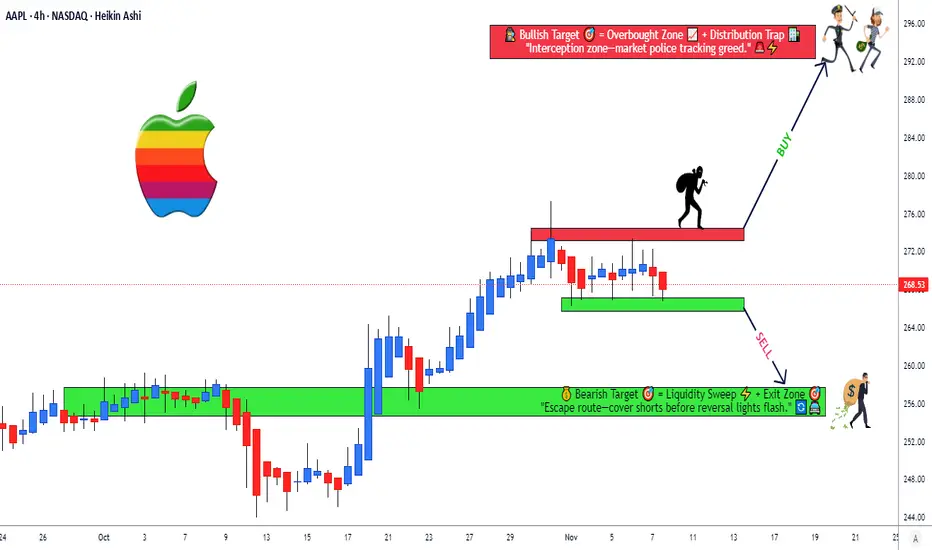
$AAPL Two-Way Plan: Sell Strength, Buy Structure🍎 ASSET OVERVIEW
Asset: NASDAQ:AAPL — Apple Inc.
Exchange: NASDAQ
Style: Swing Trade
Market Context: Extended price action near resistance with overbought signals, followed by potential mean reversion toward moving average structure.
🧠 MARKET PLAN (PROFESSIONAL + FUN VIBE)
📉 PHASE 1 — SHORT-TERM BEARISH BIAS
Price is currently overextended, sitting near a strong resistance zone with signs of buyer exhaustion.
Overbought conditions ⚠️
Resistance + liquidity trap potential
Expectation: Pullback toward the moving average
📈 PHASE 2 — STRUCTURED BULLISH PULLBACK
After the retracement, trend continuation is possible if price respects the dynamic moving average support near 267.00.
This is a two-scenario plan, not prediction — react, don’t predict.
🎯 EXECUTION LEVELS
🔴 Entry (Bearish Leg)
Sell: Current price zone (into resistance / overextension)
🟢 Buy Zone (Bullish Pullback)
Buy: Near Moving Average Support @ 267.00
🛑 RISK MANAGEMENT (ADJUSTABLE)
Bearish Stop Loss: @ 278.00
Bullish Stop Loss: @ 260.00
⚠️ Dear Ladies & Gentlemen (Thief OGs)
These stop levels are reference points only.
Risk management is personal — adjust position size and stops based on your own strategy and risk tolerance.
🎯 TARGETS
📉 Bearish Objective
Target: Near Dynamic Moving Average Support @ 267.00
📈 Bullish Continuation Objective
Target: 288.00
🚨 Strong resistance + prior overbought zone suggests partial profit booking is smart.
Market gives, market takes — protect gains.
⚠️ Dear Ladies & Gentlemen (Thief OGs)
These targets are not mandatory — manage profits at your discretion.
🔗 RELATED PAIRS & CORRELATED WATCHLIST
Keeping an eye on correlated instruments can confirm or invalidate this setup:
NASDAQ:NDX / PEPPERSTONE:NAS100 📊
Apple is a heavyweight — weakness or strength here directly impacts AAPL momentum.
SP:SPX / AMEX:SPY 🏦
Broad market risk sentiment helps confirm pullback sustainability.
NASDAQ:QQQ 🚀
Tech ETF correlation — divergence may signal early reversal or continuation.
NASDAQ:MSFT & NASDAQ:NVDA 🧠
Relative strength comparison within mega-cap tech.
🧩 KEY TAKEAWAYS
Trade the reaction, not emotions
Respect moving average dynamics
Scale wisely, protect capital
No single bias — adapt with structure
✨ “If you find value in my analysis, a 👍 and 🚀 boost is much appreciated — it helps me share more setups with the community!”
⚠️ DISCLAIMER
This is a thief-style trading strategy just for fun 🎭
Educational & entertainment purposes only — not financial advice.
Always do your own analysis and manage risk responsibly.
#AAPL #Apple #NASDAQ #SwingTrading #Pullback #MovingAverage
#PriceAction #MarketStructure #RiskManagement #TraderCommunity
#TechnicalAnalysis #Stocks #USMarkets #TradingView

Apple Next MoveApple Index
- Rising Wedge as an corrective pattern in Short Time Frame
- Change of Characteristics
- Completed " 12 " Impulsive Waves
- Break of Structure
- Fibonacci Level - 261.80%

Apple Inc. Swing Setup – Breakout or Breakdown Ahead?🍎 AAPL | Apple Inc. - Swing Trade Profit Blueprint 💰
NASDAQ: AAPL | Breakout Pattern Setup ⚡
Master the Swing Trade Game 🎯
📊 TECHNICAL OVERVIEW
Currently trading at $268.47 with strong momentum indicators aligning for a breakout scenario. Apple is positioned in a critical decision zone with defined technical levels offering professional risk/reward opportunities.
🎲 Market Structure: Tight consolidation phase with multiple confluences at key resistance and support zones.
📈 SWING TRADE SETUP - DUAL SCENARIO ANALYSIS
SCENARIO 1: BULLISH BREAKOUT 🚀
Entry Signal: Price breaks above resistance with volume confirmation
Entry Zone: Above $272.00 (Daily Close Confirmation)
Initial Target: $290.00 TP1 🎯
Extended Target: $295.00 TP2 (Ultimate Profit Zone) 🏆
Stop Loss: $264.00 (Risk Management Point) 🛑
SCENARIO 2: BEARISH BREAKDOWN 📉
Entry Signal: Price breaks below support with selling pressure
Entry Zone: Below $266.50 (Daily Close Confirmation)
Target 1: $262.00 TP1 🎯
Target 2: $256.00 TP2 (Profit Protection Zone) 🏆
Stop Loss: $276.00 (Risk Management Point) 🛑
🔍 KEY TECHNICAL FACTORS
✅ Momentum Alignment: Multiple timeframe convergence detected
✅ Volume Profile: Above average volume supporting breakout potential
✅ Support/Resistance: Well-defined levels from historical price action
✅ RSI Positioning: Neutral to strong momentum setup
✅ Moving Averages: Key dynamic support levels in play
🎯 SCENARIO CORRELATION PAIRS TO MONITOR
Primary Correlations:
🔗 NASDAQ:MSFT (Microsoft) - Tech sector strength indicator | Tech giants move together | Watch for divergence signals
🔗 NASDAQ:QQQ (Nasdaq-100 ETF) - Broader market direction | If QQQ breaks down, AAPL pressure increases | Use as macro confirmation
🔗 AMEX:VGT (Vanguard Info Tech ETF) - Sector sentiment gauge | Tech rotation plays | Confirms sector health
🔗 AMEX:IVV (iShares S&P 500 ETF) - S&P 500 correlation | Broad market support/resistance | Risk-on/risk-off indicator
🔗 AMEX:GLD (Gold) - Risk sentiment inverse correlation | Gold up = Risk-off = Tech pressure | Macro economic climate
📍 IMPORTANT REMINDERS FOR TRADERS
Your Entry Is Your Choice ✓ Only enter when YOUR checklist is complete
Your Stop Loss Is Your Decision ✓ Set it where YOU feel comfortable with risk
Your Take Profit Is Your Call ✓ Exit when your profit target is achieved or thesis breaks
Every trader's risk tolerance differs. These levels are technical reference points, not personal recommendations.
🎓 STRATEGY NOTES
✨ Best used on 1H-4H timeframes for swing trading
✨ Volume confirmation is CRITICAL before entries
✨ Wait for candle closes above/below levels - no wick trading
✨ Use this alongside your own technical analysis
✨ Market conditions can invalidate setups rapidly - stay flexible
✨ The breakout zone is where patience rewards traders
💡 CORRELATION SUMMARY
Green Lights ✅: When MSFT, QQQ, and VGT all confirm uptrend = Stronger AAPL bullish case
Yellow Caution ⚠️: When divergence appears between AAPL and QQQ = Possible reversal warning
Red Lights 🔴: When GLD spikes & IVV breaks support = Risk-off environment = Tech pressure incoming
✨ If you find value in my analysis, a 👍 and 🚀 boost is much appreciated — it helps me share more setups with the community!
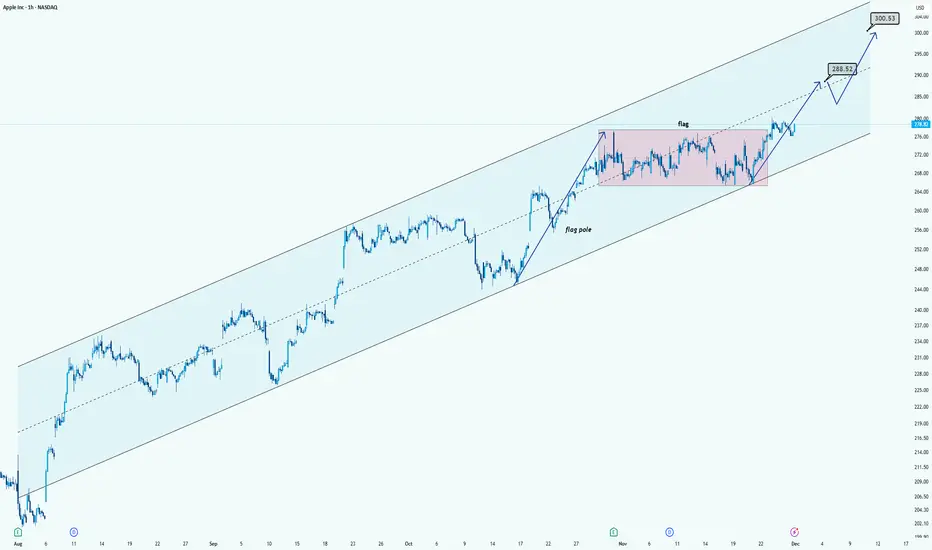
AAPL Chart AnalysisHi!
AAPL is trading inside a clean long-term ascending channel, showing a strong uptrend. Recently, the price formed a bullish flag (pink zone) after a sharp move up. The breakout above the flag signals continuation of the trend.
The chart projects two key upside levels:
$288.52 as the first target (flag breakout objective / mid-channel resistance)
$300.53 as the second target (upper channel boundary + psychological level)
As long as price stays above the flag range and respects the channel, the bullish structure remains intact.
Apple - This stock will collapse!🥊Apple ( NASDAQ:AAPL ) is reversing right now:
🔎Analysis summary:
Starting back five years ago, Apple established a major rising channel pattern. Following this channel, Apple recently created a textbook +40% move higher. But with the current retest of resistance, we will certainly see another pullback of -30% in the near future.
📝Levels to watch:
$250
SwingTraderPhil
SwingTrading.Simplified. | Investing.Simplified. | #LONGTERMVISION

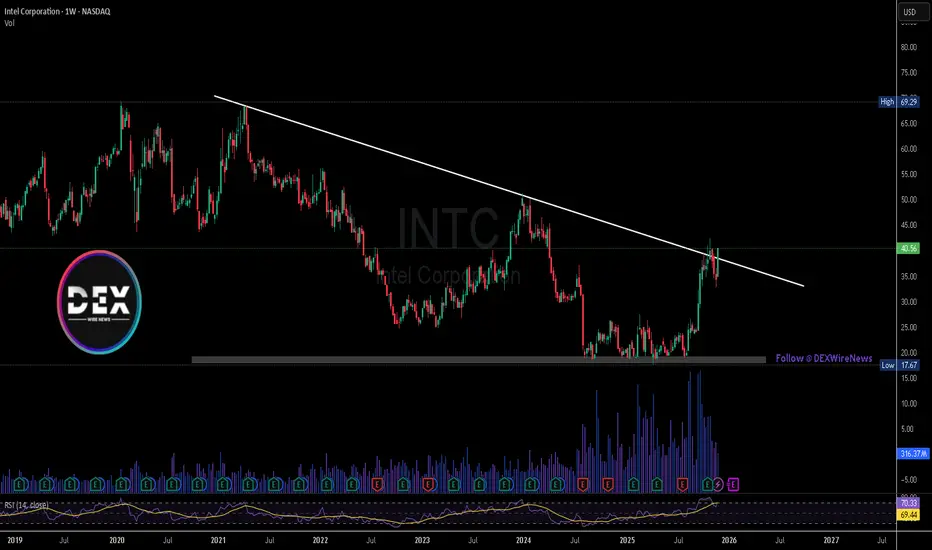
Intel Corporation and Apple Rumors Ignite a Bullish SurgeIntel Corporation (NASDAQ: NASDAQ:INTC ) jumped more than 10% on Friday as fresh speculation pointed to Apple potentially becoming a major new customer. The rally followed a social media post by TF International Securities analyst Ming-Chi Kuo, who suggested industry surveys indicate Apple could begin sourcing processors from Intel as early as 2027. The possibility marks one of the most meaningful shifts in Intel’s long-term manufacturing prospects in several years.
Investors reacted quickly because a deal with Apple would strengthen confidence in Intel’s turnaround strategy. Despite a strong year—where shares have doubled in value—Intel continues to face questions about its ability to secure durable, high-volume contracts. Apple, known for its vertically integrated chip ecosystem, would represent a major validation of Intel’s foundry ambitions. While neither company has publicly commented, the speculation alone has reinforced bullish sentiment surrounding Intel’s expanding customer pipeline.
Intel’s recent performance is underpinned by several high-profile partnerships, including collaborations with Nvidia (NVDA) in advanced chip manufacturing. These deals, combined with ongoing restructuring efforts, have pushed investor confidence higher. Yet the company remains far from its historical highs, and long-term execution remains the central focus for the market.
Technical Analysis
Intel trades in a strong bullish structure, now pressing against a key descending trendline that has acted as resistance for months. Price is breaking above this level with clear momentum, signaling a possible shift into a broader upward continuation. The next resistance sits at $50, followed by a major level at $68 if bullish pressure sustains. On the downside, support rests at $32, with deeper support at $25 if the trend cools. Current momentum favors the bulls as long as price holds above the breakout zone.
Apple: Pause - but New Highs Likely Ahead Apple has recently shown signs of sluggishness, trading mostly sideways. For now, we expect this pause to give way to renewed gains, allowing the green wave to reach a new high. However, there is also a 31% chance that the current consolidation could break to the downside, leading to imminent sell-offs below the $212.94 support level. In that scenario, we would view the previous advances as merely corrective and anticipate a new, broader corrective low in the blue wave alt.(IV), although this would still form above the lower $168 mark.

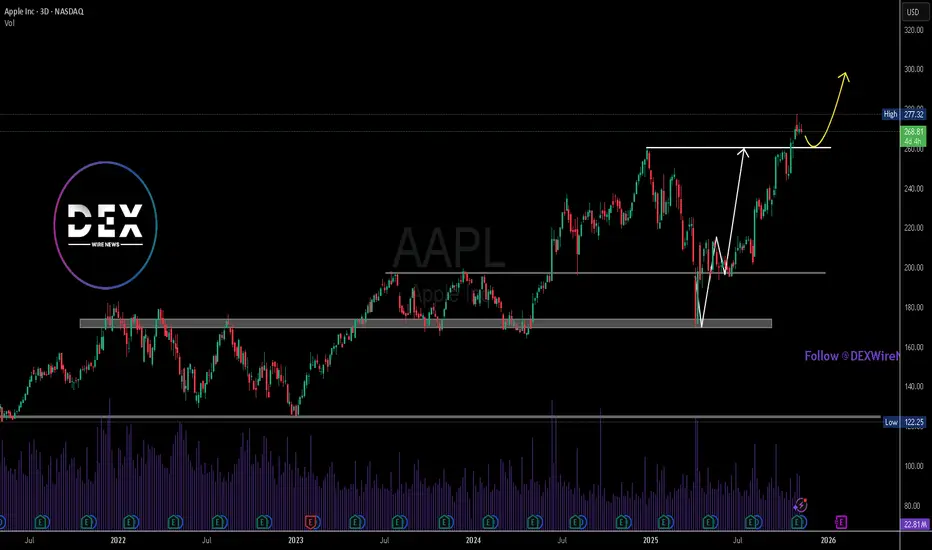
Apple Inc.($AAPL): Morgan Stanley Sees $130B Robotics Potential Apple Inc. (Nasdaq: NASDAQ:AAPL ) stock dipped 0.52% to $268.37 on Friday despite bullish long-term projections from Morgan Stanley. The investment bank’s new report suggests that Apple’s emerging robotics division could generate as much as $130 billion in annual revenue by 2040.
According to the analysts, including Apple specialist Erik Woodring, the company’s early robotics efforts could evolve into a major growth pillar alongside the iPhone, Mac, and wearables. The report envisions humanoid robots and robotic home assistants as part of Apple’s long-term strategy, powered by its AI and hardware integration strengths.
Morgan Stanley based its estimates on Apple’s track record of dominating premium consumer technology segments. With the company’s existing ecosystem—spanning devices, software, and services—Apple is seen as well-positioned to commercialize robotics on a massive scale. The analysts expect the robotics segment to capture roughly 9% of the total global market over the next 15 years.
The potential opportunity builds on Apple’s continued investment in AI and advanced sensors, technologies that would be essential for functional and safe humanoid robots. Analysts note that while Apple has not officially disclosed a robotics project, recent patent filings and talent acquisitions hint at serious development in the space.
Technical View
The AAPL chart indicates a bullish breakout above the $260 resistance level, confirming upward momentum following months of consolidation. Price action suggests a possible retest of this breakout zone before extending higher toward $290 and $300. With strong fundamentals and growing speculation about its next frontier in innovation, Apple’s long-term outlook remains constructive, even as short-term volatility continues.
Apple: New All-Time High as Low Is Adjusted Apple has recently seen a period of heightened volatility, marked by sharp gains and notable pullbacks. In response to the latest price action, we’ve made a slight adjustment to our wave count and revised the low for magenta wave (4). We’re now allowing for magenta wave (5) to break above the $260.10 resistance level, which would complete green wave . Our alternative scenario, which carries a 34% probability, still calls for a new corrective low in blue wave alt.(IV). In this case, Apple would have just finished beige wave alt.b slightly above $260.10 and would next decline in wave alt.c, falling below support at $212.94. Even so, the alternative corrective low would remain above the $168 level.

Apple: New All-Time High!Apple has recently seen a period of heightened volatility, marked by sharp gains and notable pullbacks. We’re allowing for magenta wave (5) to break above the $260.10 resistance level, which would complete green wave . However, our alternative scenario, which carries a 34% probability, calls for a new corrective low in blue wave alt.(IV) . In this case, Apple would have just finished beige wave alt.b slightly above $260.10 and would next decline in wave alt.c , falling below support at $212.94. Even so, the alternative corrective low would remain above the $168 level.

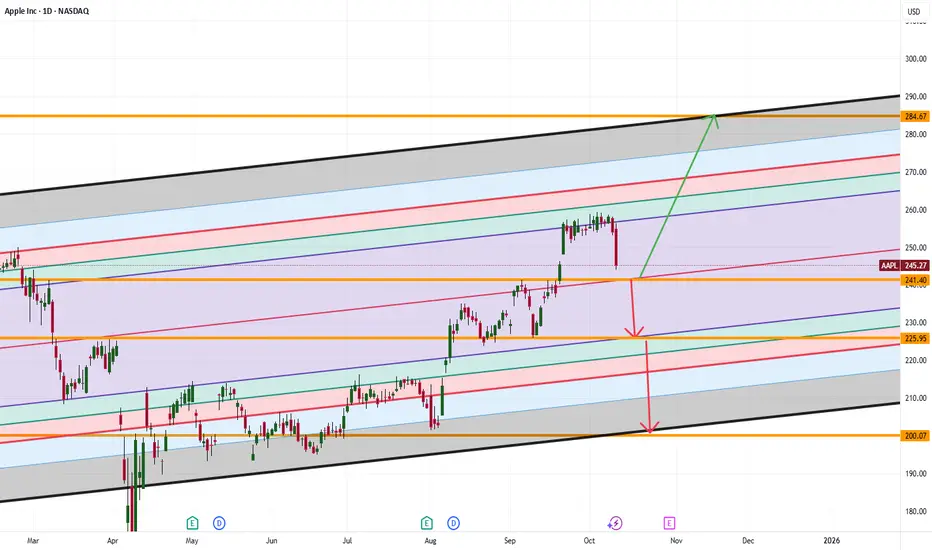
APPLE/AAPL Stock: Movement Scenarios and Key Reaction PointsThese are all the key stock levels for Apple that are fully and precisely displayed in the image – including supports, resistances, and potential reaction points for traders NASDAQ:AAPL

Apple’s $241 Bounce or Breakdown: Is This the Next Big Move?Apple’s stock price is moving down toward $241. This is an important zone. If Apple can stay above $241, it could jump up to $284. But if it falls below $241, the price might drop even more; maybe to $225 or even $200.
What do you think will happen next? Would you buy Apple if it drops to $241, or would you wait for a bigger move?
If you’re not sure what to do or have questions, ask me! Sometimes asking the right question gives you the answer you need to trade smarter. What’s your question about Apple right now?
Mindbloome Exchange
Trade Smarter Live Better
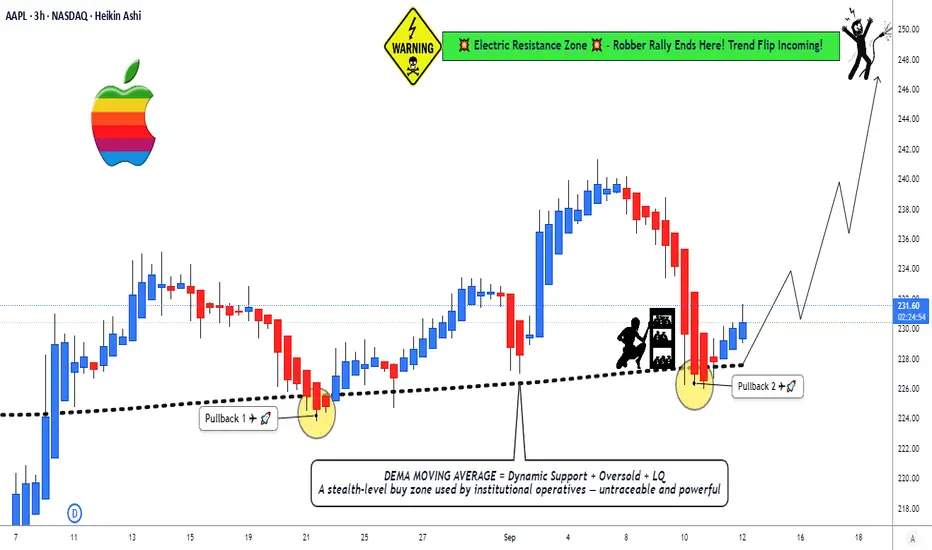
AAPL at Dynamic Support: Trade the Bounce!🍎 AAPL Swing/Day Trade: The Great Apple Heist Plan 🚨
Asset: AAPL (Apple Inc. Stock)
Market: US Stock
MarketVibe: Bullish, sneaky, and ready to loot some profits! 💰
📜 The Master Plan: Bullish EMA Pullback Heist
🎯 Strategy: We're pulling off a slick Double Exponential Moving Average (DEMA) pullback plan, targeting a breakout at dynamic support levels. Think of it as a high-stakes caper where we sneak in, grab the profits, and escape before the market knows what hit it! 😎
🔑 Key Setup Details:
Chart Setup: AAPL is showing a bullish setup with a DEMA pullback, signaling a potential swing or day trade opportunity.
Dynamic Line: We’re eyeing the DEMA as our guiding star 🌟 for entries and exits.
🚪 Entry: The Sneaky Thief Layering Strategy
🔍 How to Enter: Deploy the Thief Layering Strategy with multiple buy limit orders to maximize your entry precision:
🤑 Buy Limit Layers: Place orders at $227, $228, $229, $230 (or add more layers based on your risk appetite — you’re the mastermind here!).
💡 Pro Tip: Feel free to adjust entry levels to suit your style. The market’s your playground, so pick your spot!
🛑 Stop Loss: Protect Your Loot!
⚠️ Thief SL: Set your stop loss at $224 post-breakout to guard your stash.
Note: Dear Ladies & Gentlemen (Thief OGs 🕵️♂️), this SL is a suggestion. Adjust it based on your strategy and risk tolerance. You’re in charge of your heist, so protect your loot your way!
🎯 Target: Hit the Jackpot & Escape!
💥 Profit Target: Aim for $248, where a high-voltage resistance wall ⚡️ awaits, potentially paired with overbought conditions and a sneaky trap. Grab your profits and vanish before the market catches on!
Note: Dear Thief OGs, this target is a suggestion. Set your TP based on your goals and risk management. Take the money and run at your own discretion! 😏
👀 Related Pairs to Watch (Correlations & Opportunities)
To boost your heist, keep an eye on these correlated assets:
NASDAQ:MSFT (Microsoft): Tech giant with similar market moves to AAPL. If AAPL’s bullish, MSFT might follow suit. Watch for parallel DEMA pullbacks.
NASDAQ:QQQ (Invesco QQQ ETF): Tracks the Nasdaq-100, where AAPL is a heavy hitter. QQQ’s trend can confirm AAPL’s bullish momentum.
AMEX:SPY (SPDR S&P 500 ETF): Broad market index. If SPY’s trending up, it supports AAPL’s bullish case.
Key Correlation Insight: AAPL often moves in tandem with tech-heavy indices like QQQ. A bullish QQQ or MSFT can reinforce confidence in this trade setup.
⚡ Why This Setup Rock
Bullish Momentum: DEMA pullback signals a strong continuation pattern.
Layered Entries: Multiple limit orders reduce risk and increase flexibility.
Clear Risk Management: Defined SL and TP keep your heist disciplined.
Market Context: Tech sector strength (check QQQ/MSFT) supports AAPL’s upward move.
⚠️ Risk Disclaimer
Dear Thief OGs, this is not financial advice. The market’s a wild place, and you’re the master of your trades. Set your SL and TP based on your own risk tolerance and strategy. Steal profits wisely! 😎
✨ “If you find value in my analysis, a 👍 and 🚀 boost is much appreciated — it helps me share more setups with the community!”
#Hashtags: #AAPL #SwingTrading #DayTrading #StockMarket #ThiefStrategy #TechnicalAnalysis #Bullish #TradingView
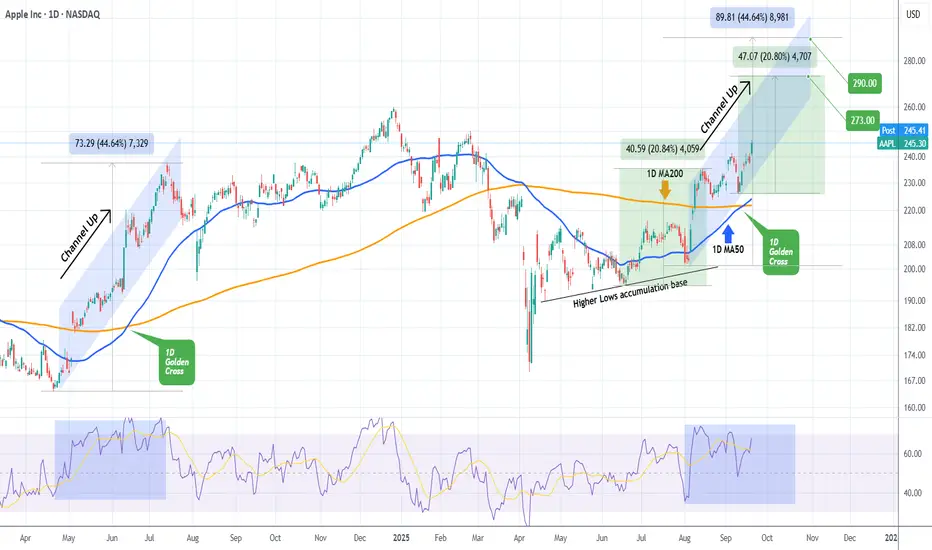
APPLE made first 1D Golden Cross in over a year!Apple Inc. (AAPL) completed this week its first 1D Golden Cross in over 1 year (since June 13 2024). The price has posted a strong 1D candle today on positive iPhone 17 fundamentals and it appears that the price is extending the very same Channel Up it had in May - July 2024.
If the current pattern ends the same way eventually as the 2024 fractal, expect a +44.64% rise with a $290.00 Target.
However the rally may stop a little lower at $273.00 if it follows the previous +20.80% Bullish Leg of the more recent June 18 - August 13 2025 run.
We will be more than satisfied with the less optimistic scenario nonetheless.
-------------------------------------------------------------------------------
** Please LIKE 👍, FOLLOW ✅, SHARE 🙌 and COMMENT ✍ if you enjoy this idea! Also share your ideas and charts in the comments section below! This is best way to keep it relevant, support us, keep the content here free and allow the idea to reach as many people as possible. **
-------------------------------------------------------------------------------
💸💸💸💸💸💸
👇 👇 👇 👇 👇 👇
Apple: Pulling Back, but Uptrend Still IntactApple has recently faced substantial downward pressure, retracing enough to erase the gains made in the first week of September. Our primary outlook is that the stock will soon rebound and, during green wave , rise toward resistance at $260.10. Following a moderate pullback in wave , shares should ultimately break through this level in wave , further advancing the broader upward trend. However, we continue to monitor our 37% likely alternative scenario. In this case, AAPL would have completed beige wave alt.b with its recent peak and could next target a new major low for blue wave alt.(IV) via wave alt.c . Here, the price would fall below support at $201.50 but ideally rebound above the lower mark at $168.

AAPLE Inc. High Probale Plummet To Be TriggeredAAPL which has been on a quite an ecstacy in the past few weeks might have its Joy short-lived due to activities its did below. Activities being 'The change of character"
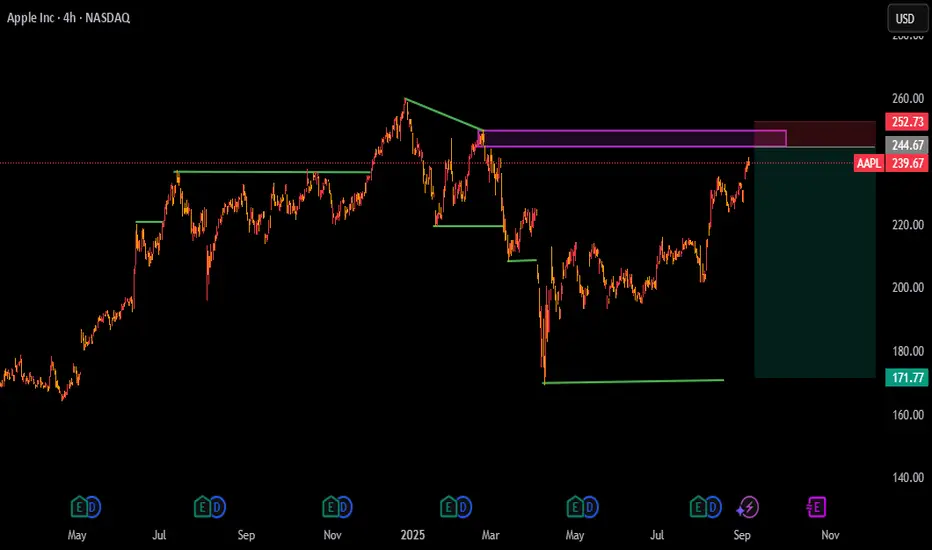
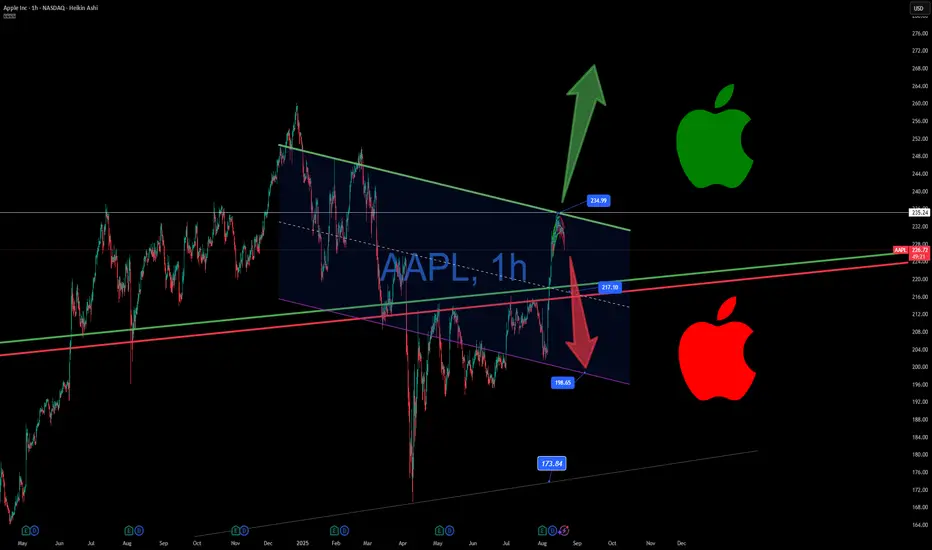
Apple Hits the Ceiling – Breakout or Rejection Next? 🍏📉 Apple Hits the Ceiling – Breakout or Rejection Next? ⚖️🚀
Apple just tagged the top of a long-standing descending channel — 234.99 was the technical ceiling, and price has paused right beneath it. The bulls have done the work to push it here… but confirmation is still missing.
📊 Here's what I’m watching:
🟢 Breakout zone: Clean move over 235 = trigger for continuation
🔴 Rejection risk: Failure here opens downside toward 217, then 198
⚠️ Big picture: This range has been in play for nearly a year — high stakes now
Apple is not just another stock — it's a pillar of U.S. markets, ETFs, and passive portfolios. And in the current Trump-era macro chaos, every breakout or breakdown carries systemic implications.
So while Bitcoin reclaims structure and S&P 500 flirts with resistance, AAPL sits at the edge of a decision.
🧠 My plan?
No FOMO.
✅ Long only on confirmed breakout
❌ Avoid chasing inside the range
We wait, we watch, we act — when price confirms.
One Love,
The FXPROFESSOR 💙
AAPL US production lines. Politics or honest long-term strategy?NASDAQ:AAPL is investing into the US. Is it a short-term political move, or an actual genuine intention to "make America great again"?
Let's take a look.
NASDAQ:AAPL
Let us know what you think in the comments below.
Thank you.
75.2% of retail investor accounts lose money when trading CFDs with this provider. You should consider whether you understand how CFDs work and whether you can afford to take the high risk of losing your money. Past performance is not necessarily indicative of future results. The value of investments may fall as well as rise and the investor may not get back the amount initially invested. This content is not intended for nor applicable to residents of the UK. Cryptocurrency CFDs and spread bets are restricted in the UK for all retail clients.

Apple Stock Falls Despite Strong EarningsApple stock is down more than 4% in the final session of the week, following the company’s earnings release yesterday. Apple reported earnings per share of $1.57, beating expectations of $1.43, while total revenue reached $94.04 billion, surpassing the $89.53 billion forecasted by the market.
However, despite the strong results, the stock is once again facing a notable short-term bearish bias as investor concerns grow. The primary issue is the perception that Apple is falling behind in the race for artificial intelligence, especially compared to its main competitors. In addition, shortly after the earnings announcement, it was noted that the company may face challenges in sustaining growth throughout the remainder of 2025, which has fueled additional downward pressure on the stock.
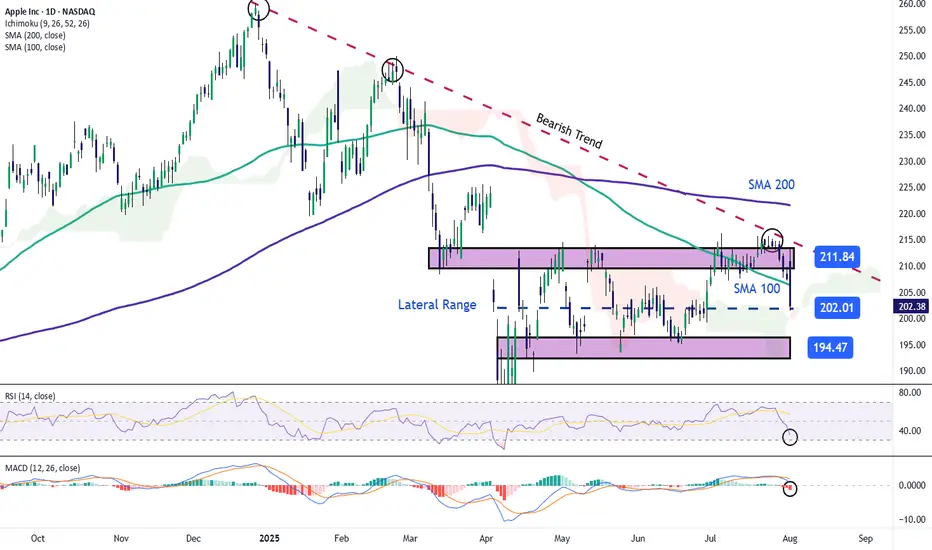
Sideways Range Emerges
In recent weeks, Apple’s price action has consolidated within a clear lateral range, with resistance around $211 and support near $194. So far, price fluctuations have not been strong enough to break this structure, and the latest bearish candlestick has reinforced the validity of the channel. For now, this sideways range remains the most relevant technical formation to watch in the upcoming sessions.
Technical Indicators
RSI:
The RSI line is falling rapidly and is now approaching the oversold zone at the 30 level. If the indicator reaches that threshold, it could suggest a technical imbalance, opening the door to a short-term bullish correction.
MACD:
The MACD histogram has moved into negative territory in recent sessions, suggesting a clear dominance of bearish momentum in the moving average structure. If this persists, selling pressure may continue to build in the near term.
Key Levels to Watch:
$211 – Main Resistance: Upper boundary of the current range. A breakout above this level could trigger a stronger bullish trend.
$200 – Psychological Support: Round number zone, a breakdown here could activate an immediate bearish bias for the next sessions.
$194 – Key Support: Corresponds to recent weekly lows. A move below this level would likely confirm a more extended bearish trend.
Written by Julian Pineda, CFA – Market Analyst
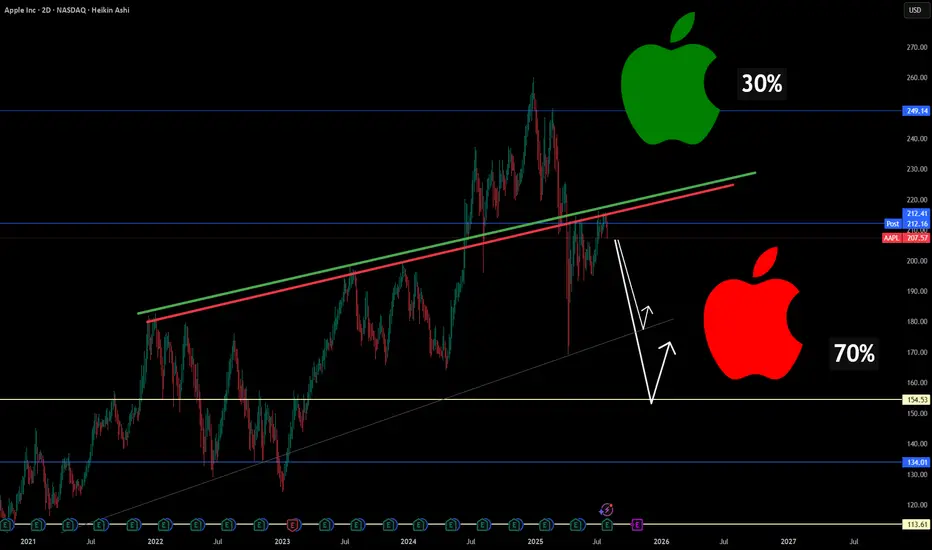
Why Apple Could Be Entering a Structural Correction🍎📉 Why Apple Could Be Entering a Structural Correction ⚠️🔍
After scanning major tech names today, one stock stood out— for all the wrong reasons : NASDAQ:AAPL .
Technically, Apple has broken below long-standing trendline support , and my chart now assigns a 70% probability(roughly guys...roughly and rounded) of further downside vs only 30% upside . But it's not just about the chart...
Here’s the macro storm Apple is walking into:
🧭 1. Trade War Revival
New tariffs on Chinese electronics could cost Apple up to $1.1B/quarter , even as it tries to diversify production. India and Vietnam are promising, but not mature enough to offset risk.
🤖 2. Lagging in the AI Arms Race
While Nvidia, Google, and Microsoft pour $30B+ into AI, Apple is spending less than half that. Analysts weren’t impressed with “Apple Intelligence.” Siri still isn’t leading.
🇨🇳 3. China: Flatlining Growth, Rising Risk
~18% of Apple’s revenue still comes from China. With Huawei resurging and tightening regulations, Apple’s dominance is being chipped away.
🛑 4. Innovation Pipeline: Empty?
There’s no iPhone super-cycle ahead. Vision Pro remains niche. Apple now looks like a mature tech stock without a breakout catalyst —risky when valuation is still premium.
⚖️ 5. Legal Pressure on Both Sides of the Atlantic
The DOJ and EU are targeting Apple’s App Store dominance. If changes are enforced, the service revenue moat weakens.
🔽 Summary: This Isn’t Panic. It’s Repricing.
The market is re-rating Apple based on real structural risks.
Downside levels I’m watching:
📉 177.65 (first support)
📉 154.53 (next key level)
❗️134–113 zone if macro pressure escalates
Chart = structure. Narrative = pressure. Both are aligned.
Let me know your thoughts—still long NASDAQ:AAPL , or hedging this weakness?
One Love,
The FXPROFESSOR 💙
Disclosure: I am happy to be part of the Trade Nation's Influencer program and receive a monthly fee for using their TradingView charts in my analysis. Awesome broker, where the trader really comes first! 🌟🤝📈
Apple - The next major push higher!🍎Apple ( NASDAQ:AAPL ) will head for new highs:
🔎Analysis summary :
Apple has been underperforming markets for a couple of months lately. However technicals still remain very bullish, indicating an inherent and substantial move higher soon. All we need now is bullish confirmation and proper risk management and this setup looks very decent.
📝Levels to watch:
$200, $300
🙏🏻#LONGTERMVISION
Philip - Swing Trader
