APPLE Massively oversold RSI. Short-term buy??Almost 2 months ago (December 05 2025, see chart below), we gave a massive long-term Sell Signal on APPLE (AAPL) as it hit the top of its 4-year Channel Up and the 1.236 Fibonacci extension:
The price immediately dropped and we are now on a strong weekly selling streak that is approaching the 1W MA50 (red trend-line), which is generally the first technical Support during corrections.
However, the 1D RSI turned massively oversold as it hit 20.00 and this is technically the first Buy Signal but only on a short-term basis. In fact, every correction within this Channel Up pattern, always rebounded around the same point we are at today, to test the 1D MA50 (blue trend-line) and then resumed the long-term downtrend to test the 1W MA50. This 1D MA50 test may take place at $265.
Whether that's a traditional Bear Cycle (like in 2022) or a shorter correction, the deciding factor will be the 1W MA50 test. We expect that to be at $236, which is also where the 0.382 Fib is (tested previously on the October 26 2023 low). A break below it, will technically open the way for further downside towards the 1W MA200 (orange trend-line).
In that case, we will maintain a long-term target/ Buy Zone within $210 - $200, whose bottom will still be marginally less than the -32.00% of 2022 or the -35.00% of early 2025.
---
** Please LIKE 👍, FOLLOW ✅, SHARE 🙌 and COMMENT ✍ if you enjoy this idea! Also share your ideas and charts in the comments section below! This is best way to keep it relevant, support us, keep the content here free and allow the idea to reach as many people as possible. **
---
💸💸💸💸💸💸
👇 👇 👇 👇 👇 👇
Applesignals

Apple Next MoveApple Index
- Rising Wedge as an corrective pattern in Short Time Frame
- Change of Characteristics
- Completed " 12 " Impulsive Waves
- Break of Structure
- Fibonacci Level - 261.80%

Apple Inc. Swing Setup – Breakout or Breakdown Ahead?🍎 AAPL | Apple Inc. - Swing Trade Profit Blueprint 💰
NASDAQ: AAPL | Breakout Pattern Setup ⚡
Master the Swing Trade Game 🎯
📊 TECHNICAL OVERVIEW
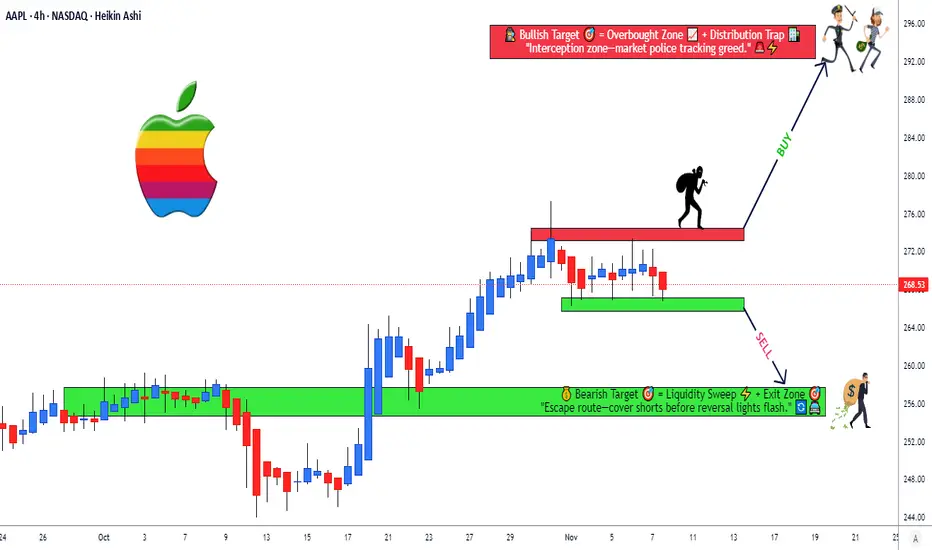
Currently trading at $268.47 with strong momentum indicators aligning for a breakout scenario. Apple is positioned in a critical decision zone with defined technical levels offering professional risk/reward opportunities.
🎲 Market Structure: Tight consolidation phase with multiple confluences at key resistance and support zones.
📈 SWING TRADE SETUP - DUAL SCENARIO ANALYSIS
SCENARIO 1: BULLISH BREAKOUT 🚀
Entry Signal: Price breaks above resistance with volume confirmation
Entry Zone: Above $272.00 (Daily Close Confirmation)
Initial Target: $290.00 TP1 🎯
Extended Target: $295.00 TP2 (Ultimate Profit Zone) 🏆
Stop Loss: $264.00 (Risk Management Point) 🛑
SCENARIO 2: BEARISH BREAKDOWN 📉
Entry Signal: Price breaks below support with selling pressure
Entry Zone: Below $266.50 (Daily Close Confirmation)
Target 1: $262.00 TP1 🎯
Target 2: $256.00 TP2 (Profit Protection Zone) 🏆
Stop Loss: $276.00 (Risk Management Point) 🛑
🔍 KEY TECHNICAL FACTORS
✅ Momentum Alignment: Multiple timeframe convergence detected
✅ Volume Profile: Above average volume supporting breakout potential
✅ Support/Resistance: Well-defined levels from historical price action
✅ RSI Positioning: Neutral to strong momentum setup
✅ Moving Averages: Key dynamic support levels in play
🎯 SCENARIO CORRELATION PAIRS TO MONITOR
Primary Correlations:
🔗 NASDAQ:MSFT (Microsoft) - Tech sector strength indicator | Tech giants move together | Watch for divergence signals
🔗 NASDAQ:QQQ (Nasdaq-100 ETF) - Broader market direction | If QQQ breaks down, AAPL pressure increases | Use as macro confirmation
🔗 AMEX:VGT (Vanguard Info Tech ETF) - Sector sentiment gauge | Tech rotation plays | Confirms sector health
🔗 AMEX:IVV (iShares S&P 500 ETF) - S&P 500 correlation | Broad market support/resistance | Risk-on/risk-off indicator
🔗 AMEX:GLD (Gold) - Risk sentiment inverse correlation | Gold up = Risk-off = Tech pressure | Macro economic climate
📍 IMPORTANT REMINDERS FOR TRADERS
Your Entry Is Your Choice ✓ Only enter when YOUR checklist is complete
Your Stop Loss Is Your Decision ✓ Set it where YOU feel comfortable with risk
Your Take Profit Is Your Call ✓ Exit when your profit target is achieved or thesis breaks
Every trader's risk tolerance differs. These levels are technical reference points, not personal recommendations.
🎓 STRATEGY NOTES
✨ Best used on 1H-4H timeframes for swing trading
✨ Volume confirmation is CRITICAL before entries
✨ Wait for candle closes above/below levels - no wick trading
✨ Use this alongside your own technical analysis
✨ Market conditions can invalidate setups rapidly - stay flexible
✨ The breakout zone is where patience rewards traders
💡 CORRELATION SUMMARY
Green Lights ✅: When MSFT, QQQ, and VGT all confirm uptrend = Stronger AAPL bullish case
Yellow Caution ⚠️: When divergence appears between AAPL and QQQ = Possible reversal warning
Red Lights 🔴: When GLD spikes & IVV breaks support = Risk-off environment = Tech pressure incoming
✨ If you find value in my analysis, a 👍 and 🚀 boost is much appreciated — it helps me share more setups with the community!
Apple - This stock will collapse!🥊Apple ( NASDAQ:AAPL ) is reversing right now:
🔎Analysis summary:
Starting back five years ago, Apple established a major rising channel pattern. Following this channel, Apple recently created a textbook +40% move higher. But with the current retest of resistance, we will certainly see another pullback of -30% in the near future.
📝Levels to watch:
$250
SwingTraderPhil
SwingTrading.Simplified. | Investing.Simplified. | #LONGTERMVISION

APPLE Just formed its Cycle Top. Best sell opportunity is here.Almost 3 months ago (September 19, see chart below), we gave a buy signal on Apple Inc. (AAPL), which recently hit our final $290 Target:
This week we go back to the long-term 1W time-frame as the Bullish Leg (green) since the April 07 bottom just hit the top (Higher Highs trend-line) of its 4-year Channel Up.
The 2023 Bullish Leg also peaked on its 1.236 Fibonacci extension and eventually corrected back to its 1W MA50 (blue trend-line), hitting its 0.382 Fibonacci retracement level at the same time. The 2022 and early 2025 Bearish Legs even broke below the 1W MA50 and bottomed after a minimum -32.05% decline. The April 2025 bottom even hit the 1W MA200 (orange trend-line).
All of those Channel Up (Cycle) Tops have taken place while the 1W RSI broke above the overbought level (70.00). This has already taken place since last week and we also se the 1W MACD to start reversing, which is something that has also happened every time after a Top.
Based on all the above evidence (1.236 Fib hit, Channel Up top hit, 1W RSI overbought, 1W MACD reversing), we expect Apple to start a long-term correction (Bear Cycle), technically the new Bearish Leg of the 4-year Channel Up and initially make contact with the 1W MA50 and the 0.382 Fibonacci retracement level at $236.00. If the price closes a 1W candle below the 1W MA50, then we expect a second Target to be fulfilled at the bottom of the Channel Up at $200, below the 1W MA200 but still almost -32.00% from the top.
The most efficient long-term buy signal is perhaps given by the 1W RSI again, when it hits the 33.20 Support. Use that to time your buy entry accordingly.
---
** Please LIKE 👍, FOLLOW ✅, SHARE 🙌 and COMMENT ✍ if you enjoy this idea! Also share your ideas and charts in the comments section below! This is best way to keep it relevant, support us, keep the content here free and allow the idea to reach as many people as possible. **
---
💸💸💸💸💸💸
👇 👇 👇 👇 👇 👇

APPLE First correction signals in 7 months start to emerge.Almost 1.5 month ago (September 19, see chart below), we gave a buy signal on Apple Inc. (AAPL), which recently hit our $273 Target:
This time we go back to our long-term perspective and view Apple on the 1W time-frame, as the Bullish Leg (green) since the April 07 bottom, is approaching the top (Higher Highs trend-line) of the 4-year Channel Up.
The previous Bullish Leg peaked just below the 1.236 Fibonacci extension, so we can't rule out one final push to round $285 but on the long-term, a technical pull-back is favored.
The 2023 Bullish Leg eventually corrected on the 1W MA50 (blue trend-line), hitting its 0.382 Fibonacci retracement level at the same time. Even the smaller April - July 2024 Leg pulled-back to he 0.5 Fib.
All of those Channel Up tops have been also met with a 1W RSI break above the 70.00 oversold level, which is something that hasn't taken place yet. Similarly the 1W MACD hasn't started to reverse on the levels of most of previous tops.
In any case, we expect to see Apple hitting $236 at least on the long-term, which is its 0.382 Fib and marginally below the 1W MA50.
-------------------------------------------------------------------------------
** Please LIKE 👍, FOLLOW ✅, SHARE 🙌 and COMMENT ✍ if you enjoy this idea! Also share your ideas and charts in the comments section below! This is best way to keep it relevant, support us, keep the content here free and allow the idea to reach as many people as possible. **
-------------------------------------------------------------------------------
💸💸💸💸💸💸
👇 👇 👇 👇 👇 👇

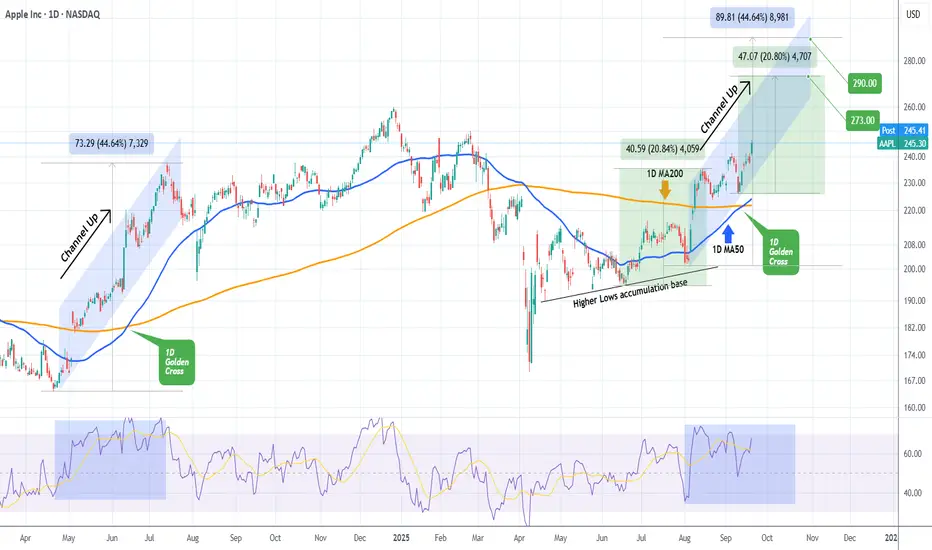
APPLE made first 1D Golden Cross in over a year!Apple Inc. (AAPL) completed this week its first 1D Golden Cross in over 1 year (since June 13 2024). The price has posted a strong 1D candle today on positive iPhone 17 fundamentals and it appears that the price is extending the very same Channel Up it had in May - July 2024.
If the current pattern ends the same way eventually as the 2024 fractal, expect a +44.64% rise with a $290.00 Target.
However the rally may stop a little lower at $273.00 if it follows the previous +20.80% Bullish Leg of the more recent June 18 - August 13 2025 run.
We will be more than satisfied with the less optimistic scenario nonetheless.
-------------------------------------------------------------------------------
** Please LIKE 👍, FOLLOW ✅, SHARE 🙌 and COMMENT ✍ if you enjoy this idea! Also share your ideas and charts in the comments section below! This is best way to keep it relevant, support us, keep the content here free and allow the idea to reach as many people as possible. **
-------------------------------------------------------------------------------
💸💸💸💸💸💸
👇 👇 👇 👇 👇 👇
AAPL Eyeing \$240 Breakout — Don’t Miss This Move
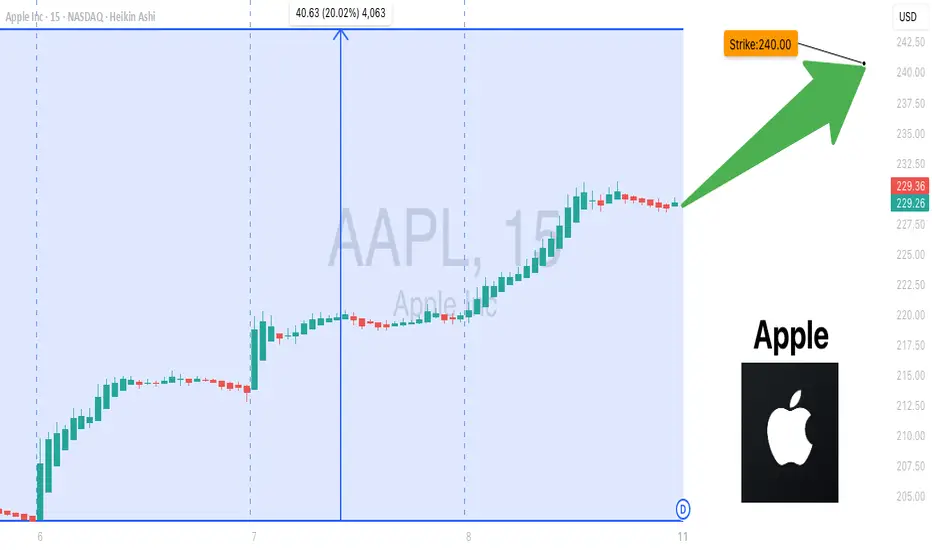
🚀 **AAPL Eyeing \$240 Breakout — Calls Lined Up for 100%+ Move** 📈
💎 Weekly sentiment: **STRONG BULLISH** (Call/Put = 1.86)
📊 RSI: Daily 77.7 | Weekly 59.8 | Volume 1.3x ↑ (Institutional Buying Confirmed)
🔥 VIX: 15.15 (Low Volatility = Green Light)
🎯 **Trade Setup**
* Type: **Call** (Long)
* Strike: **\$240.00**
* Expiry: **2025-08-15**
* Entry: \$0.65 | PT: \$1.30 | SL: \$0.32
* Confidence: **85%** | Timing: Open
Apple Stock Is Surging! Here’s What Most People MissWhen it comes to trading, we don’t care about the latest news headlines or whether some analyst has upgraded or downgraded Apple stock. We focus on one thing and one thing only: the undeniable forces of supply and demand imbalances on higher timeframes.
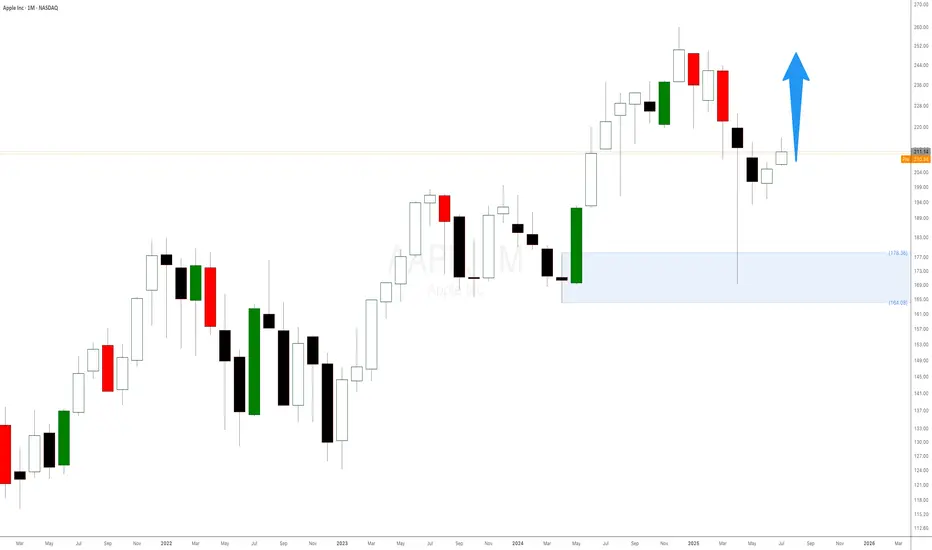
Right now, Apple’s monthly chart is a textbook example of how waiting for a strong demand imbalance pays off. That $178 monthly level is no random number. It’s the exact origin of a massive bullish impulse that happened in June 2024 — the kind of move that only happens when smart money and big institutions step in, creating an imbalance that pushes the price away rapidly.
📈 It’s Not About Fundamentals. It’s About Imbalances.
Most retail traders waste time chasing news, earnings, or rumours about iPhone sales. But if you think about it, all those factors are already priced in once a strong imbalance is formed. Institutions don’t wait for tomorrow’s news — they plan their positions weeks or months ahead, and those footprints are visible right on your chart.
The $178 level indicates a significant drop in supply and a surge in demand large enough to propel Apple higher, marked by consecutive large bullish candlesticks. That’s our signal — nothing more, nothing less.
Apple Stock Heist Blueprint – Precision Buy Setup Unlocked!🏴☠️ Apple Stock Heist: The Stealthy Long Setup
🎯 Entry Zone – Loot the Dip!
Current Price: $200.21
Action: Initiate long positions now or target pullbacks near the $193–$190 support zone.
Pro Tip: Place buy limits near swing lows/highs. Utilize chart alerts as your secret weapon.
🛡️ Stop Loss – Guard the Treasure!
Swing Traders: Position stop loss below the $190 support level.
Day Traders: Adjust stop loss according to your risk tolerance and order count.
TECHi
💰 Profit Target – Escape with the Loot!
Primary Target: $210 resistance zone.
Secondary Target: $227–$230 range.
⚔️ Scalpers vs. Swing Traders – Choose Your Weapon!
Scalpers: Focus on quick strikes. Enter long positions and exit swiftly.
Swing Traders: Trail stops and lock in gains as the price moves in your favor.
🌪️ Market Pulse – Bullish Winds Blowing!
Technical Indicators: Price is supported near $201, with potential to bounce back toward local resistance at $213.
RSI: Approximately 35 on the 1-hour timeframe, indicating oversold conditions and potential for a rebound.
TradingView
⚠️ News Trap Warning!
Upcoming Events: Monitor for any high-impact news that may affect Apple's stock price.
Strategy: Freeze trades or tighten stops ahead of major announcements.
🚨 Join the Trading Crew!
Engage: Like 👍 or Boost 🚀 this idea to fuel our next raid.
Support: Your engagement keeps the strategies alive!
🤑 Stay Locked In – The Next Big Score is Coming…
Timing: Watch the charts closely.
Action: Strike hard. Exit smarter.

APPLE Down -4% premarket on Trump's 25% Tariff. Buy opportunity?Apple Inc. (AAPL) is down -4% on pre-market trading following a warning by U.S. President Donald Trump that the company would have to pay a 25% tariff if phones sold in the U.S. were not made within its borders.
Along with a proposed 50% Tariff on goods from the European Union starting on June 01, these news have inflicted fear again in the markets following 6 weeks of a relief rebound on trade deal talks.
So are these announcements a dip buy opportunity for Apple or round 2 of correction?
Based on the stock's long-term pattern, which is a Channel Up, the recent rebound on the 1W MA200 (orange trend-line) is technically the start of its 2nd Bullish Leg. With the Bearish Legs having similar declines (-35% and -32% respectively), we can expect the Bullish Legs to have a proportional rise as well.
On top of that, the 1W RSI rebounded on its multi-year Support, while the 1W MACD is about to form a Bullish Cross.
As a result, since the 2023 Bullish Leg that was complete on July 17 2023 almost touched the 1.236 Fibonacci extension, we expect the price to disregard the news and continue rising up to the new 1.236 Fib and target $285.00.
-------------------------------------------------------------------------------
** Please LIKE 👍, FOLLOW ✅, SHARE 🙌 and COMMENT ✍ if you enjoy this idea! Also share your ideas and charts in the comments section below! This is best way to keep it relevant, support us, keep the content here free and allow the idea to reach as many people as possible. **
-------------------------------------------------------------------------------
💸💸💸💸💸💸
👇 👇 👇 👇 👇 👇

Apple, Will we see 150$ ???Hello traders, Hope you're doing great. What are your thoughts about
AAPL ?
Our last analysis went exactly as we predicted and hit our target; But what's the next target ?
For upcoming weeks, I expect an upward correction at first and after that I expect another SELL OFF situation in the market that causes a huge drop in stock market, my first Target is 157$.
This post will be Updated.
Trade Safe and have a great week.

APPLE Best buy opportunity of the last 6 years.Back in August 02 2024 (see chart below), we introduced this model on Apple Inc. (AAPL) that had high probabilities of success at predicting Cycle peaks:
We may have not hit $280 but $260 is close enough especially if you are a long-term investor that values buying low and selling high.
Now that the price has corrected by -35% and just hit the 1M MA50 (blue trend-line) for the first time in almost 10 years (since July 2016), it is time to revisit this macro-model once again.
As you can see, -35% corrections have been present on every Cycle since the January 2009 bottom of the Housing Crisis. The pattern that the stock follows is very specific and it starts with a prolonged correction, the Bear Cycle essentially, which is a lengthy correction phase, such as the 2008 Housing Crisis, the 2015/16 China slowdown and the 2022 Inflation Crisis.
Then a very structured uptrend phase starts in the form of a Channel Up that leads the market to its first peak, followed by a shorter, quicker correction phase that tests the 1M MA50 and rebounds. The rebound is the final bull phase of the Cycle, usually strong and sharp and leads to the eventual Cycle Top and then starts then new Bear Cycle (prolonged correction).
Right now the current 4-month correction is technically, based on this model, the new shorter correction. Being more than -35% in size, the last one larger than this was the previous short correction of the last Trade War in October 2018 - January 2019 (-38%).
The similarities don't stop here but extend to the 1M RSI as well, which just entered its 25-year mega Buy Zone that has been holding since December 2000 and the Dotcom Crash! In fact the last time Apple's 1M RSI was this low was in June 2013, which was the bottom of the 1st short correction on our chart.
This remarkable symmetry just shows how similar the current phase is with its previous ones and if the symmetry continues to hold, we should be expecting a strong recovery to start. Even if the price makes a slightly deeper low as -38% (like the January 2019 bottom), we may still expect the minimum rise that it had all those years shown on the chart, +145%, which translates to a potential $390 Target long-term.
It is in times like this, that patient long-term investors filter out the news noise, make their unbiased moves and maximize their profit.
-------------------------------------------------------------------------------
** Please LIKE 👍, FOLLOW ✅, SHARE 🙌 and COMMENT ✍ if you enjoy this idea! Also share your ideas and charts in the comments section below! This is best way to keep it relevant, support us, keep the content here free and allow the idea to reach as many people as possible. **
-------------------------------------------------------------------------------
💸💸💸💸💸💸
👇 👇 👇 👇 👇 👇

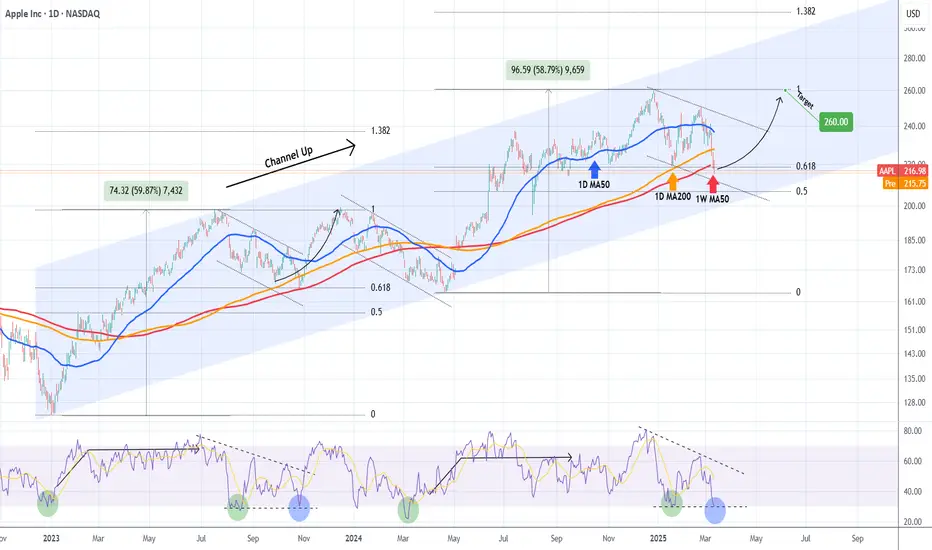
APPLE Buy opportunity on the 1W MA50.Apple Inc. (AAPL) has been trading within a 2-year Channel Up since the January 03 2023 bottom and in the past 3 months (December 26 2024) has been forming the latest Bearish Leg. On Tuesday this Leg broke below its 1W MA50 (red trend-line) for the first time in 10 months (since May 08 2024), which is the strongest buy signal since the April 19 2024 Higher Low bottom of the Channel Up.
As you can see, even the 1D RSI pattern is similar with the one that made the October 26 2023 1W MA50 test. That was also on the 0.618 Fibonacci retracement level from the respective previous Low.
As a result, it is now highly likely to see a rebound, especially if the 1W candle closes above the 1W MA50, to test the previous High and 1.0 Fib at $260, like the December 14 2023 High did.
-------------------------------------------------------------------------------
** Please LIKE 👍, FOLLOW ✅, SHARE 🙌 and COMMENT ✍ if you enjoy this idea! Also share your ideas and charts in the comments section below! This is best way to keep it relevant, support us, keep the content here free and allow the idea to reach as many people as possible. **
-------------------------------------------------------------------------------
💸💸💸💸💸💸
👇 👇 👇 👇 👇 👇
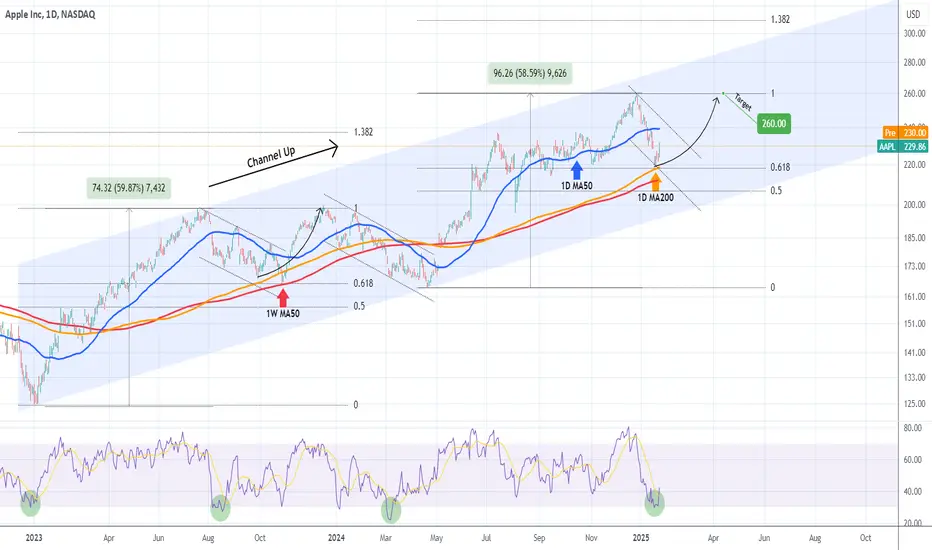
APPLE Strong buy on the 1D MA200 targeting $260.Apple Inc. (AAPL) has been trading within a 2-year Channel Up and the recent correction since the December 26 All Time High (ATH) is its technical Bearish Leg. The price posted a strong rebound yesterday following a test of the 1D MA200 (orange trend-line), the first such contact since May 08 2024.
With the 1D RSI touching the oversold barrier (30.000) and rebounding, this is technically a strong buy opportunity at least for the medium-term, as it's not a direct Higher Low of the Channel Up.
Since December already completed a +59% rise from the April 19 2024 Low, we might be having technically a medium-term rebound similar to the October 26 2023 one that re-tested the High's Resistance (at the time). As you can see both corrections have hit the 0.618 Fibonacci level.
As a result, we treat this as a solid buy opportunity to target $260.
-------------------------------------------------------------------------------
** Please LIKE 👍, FOLLOW ✅, SHARE 🙌 and COMMENT ✍ if you enjoy this idea! Also share your ideas and charts in the comments section below! This is best way to keep it relevant, support us, keep the content here free and allow the idea to reach as many people as possible. **
-------------------------------------------------------------------------------
💸💸💸💸💸💸
👇 👇 👇 👇 👇 👇
Is Apple Stock Really Worth Investing in January 2025?Strong weekly demand level took control. Expecting a decent reaction.
As we enter 2025, the financial landscape is buzzing with excitement and uncertainty. Investors are searching for promising opportunities, and one name that consistently tops the charts is Apple Inc. (NASDAQ: AAPL). Love it or hate it, this tech giant has become synonymous with innovation and growth—drawing both seasoned investors and newcomers alike to its stock like moths to a flame.

AAPL/USD: Potential Bullish Opportunity!AAPL/USD: Potential Bullish Opportunity! 📈
Here’s what I’m seeing:
Buyer/Seller Activity: Buyers seem to be gaining the upper hand.
Blue Box: A promising correction zone where I believe the dip may end.
My approach:
I’ll monitor the lower time frames (1H) for market structure breaks bullish for confirmation, bearish as a caution signal.
Keep your eyes peeled for action in this zone. Boost, comment, and follow for sharper insights! 🚀
Let me tell you, this is something special. These insights, these setups—they’re not just good; they’re game-changers. I've spent years refining my approach, and the results speak for themselves. People are always asking, "How do you spot these opportunities?" It’s simple: experience, clarity, and a focus on high-probability moves.
Want to know how I use heatmaps, cumulative volume delta, and volume footprint techniques to find demand zones with precision? I’m happy to share—just send me a message. No cost, no catch. I believe in helping people make smarter decisions.
Here are some of my recent analyses. Each one highlights key opportunities:
🌐 CryptoMarkets TOTAL2: Support Zone
🚀 GMTUSDT: %35 FAST REJECTION FROM THE RED BOX
🎯 ZENUSDT.P: Patience & Profitability | %230 Reaction from the Sniper Entry
🐶 DOGEUSDT.P: Next Move
🎨 RENDERUSDT.P: Opportunity of the Month
💎 ETHUSDT.P: Where to Retrace
🟢 BNBUSDT.P: Potential Surge
📊 BTC Dominance: Reaction Zone
🌊 WAVESUSDT.P: Demand Zone Potential
🟣 UNIUSDT.P: Long-Term Trade
🔵 XRPUSDT.P: Entry Zones
🔗 LINKUSDT.P: Follow The River
📈 BTCUSDT.P: Two Key Demand Zones
🟩 POLUSDT: Bullish Momentum
🌟 PENDLEUSDT.P: Where Opportunity Meets Precision
🔥 BTCUSDT.P: Liquidation of Highly Leveraged Longs
🌊 SOLUSDT.P: SOL's Dip - Your Opportunity
🐸 1000PEPEUSDT.P: Prime Bounce Zone Unlocked
🚀 ETHUSDT.P: Set to Explode - Don't Miss This Game Changer
🤖 IQUSDT: Smart Plan
⚡️ PONDUSDT: A Trade Not Taken Is Better Than a Losing One
💼 STMXUSDT: 2 Buying Areas
🐢 TURBOUSDT: Buy Zones and Buyer Presence
🌍 ICPUSDT.P: Massive Upside Potential | Check the Trade Update For Seeing Results
🟠 IDEXUSDT: Spot Buy Area | %26 Profit if You Trade with MSB
📌 USUALUSDT: Buyers Are Active + %70 Profit in Total
🌟 FORTHUSDT: Sniper Entry +%26 Reaction
🐳 QKCUSDT: Sniper Entry +%57 Reaction
📊 BTC.D: Retest of Key Area Highly Likely
This list? It’s just a small piece of what I’ve been working on. There’s so much more. Go check my profile, see the results for yourself. My goal is simple: provide value and help you win. If you’ve got questions, I’ve got answers. Let’s get to work!

Will NVDIA rise at the expense of APPLE?We have seen in the past few days the NVDIA Corporation (NVDA) to be holding its ground better than other tech giants that got more inflated during the recent run like Tesla.
What we've discovered by running some regression tests among top 30 cap stocks, is a very interesting relationship between NVDIA and Apple Inc (AAPL). Though most people might think that the two have completely parallel paths on their growth, we found out that at times, their correlation has been negative.
Our sample data starts 2 years ago from the October - November 2022 market bottom of the Inflation Crisis. As you can see, this is where the first divergence between the two stocks started, with NVDIA rising to spearhead the recovery to a new Bull Cycle, while Apple was lagging behind and falling.
What followed was a period where naturally both stocks rose, which led to the first 'Bear' stage, what we call Phase 2 where both stocks showed a synchronized weakness (with Apple correcting more however).
Then after a recovery for both to their highs, NVDIA formed a Bull Flag, which led to Phase 3 (similar to the late 2022 price action): Apple topped and started falling aggressively, while NVDIA started an impressive rally.
Again a period of price increase for both stocks followed, which has led to a new Phase 2 (July -October 2024). In line with their 2-year pattern, Apple has been rising since the November U.S. elections, while NVDIA has formed a new Bull Flag.
If the price action continues to replicate this model, then we may see a new Phase 3, where Apple starts to correct while NVDIA's Bull Flag leads to a strong rally.
So do you think potential Apple capital outflows will turn into inflows for NVDIA?
-------------------------------------------------------------------------------
** Please LIKE 👍, FOLLOW ✅, SHARE 🙌 and COMMENT ✍ if you enjoy this idea! Also share your ideas and charts in the comments section below! This is best way to keep it relevant, support us, keep the content here free and allow the idea to reach as many people as possible. **
-------------------------------------------------------------------------------
💸💸💸💸💸💸
👇 👇 👇 👇 👇 👇

AAPL Daily: Are We Heading to $272 or Taking a Detour?Hey Mindbloome Family, let’s talk about Apple (AAPL). Here’s what I’m seeing—it’s easy to follow, I promise:
1️⃣ Straight to $272:
If Apple breaks above $258–$260, we could see it head straight to $272.
2️⃣ Pullback, Then Up:
Apple might touch $258–$260, pull back to $253 or $236, and then move up toward $272.
3️⃣ Deeper Drop, Then Recovery:
If we fall to $236–$230, I still think there’s a good chance of bouncing back to $272.
4️⃣ Breakdown Scenario:
If $230 doesn’t hold, we’ll pause, reassess, and come back with a new game plan.
Wellness Tip: Don’t forget to move around! Sitting for too long can drain your energy. A quick walk or stretch can work wonders for your focus.
What do you think—is Apple heading to $272, or will we see a dip first? Let me know! If you want to chat more about this, hit me up in the DMs or check out my profile.
Kris/Mindbloome Exchange
Trade What You See

APPLE targeting $265 at the top of the Channel UpApple (AAPL) has been trading within a Channel Up pattern since the January 03 2023 bottom. At the moment the price is on the pattern's second long-term Bullish Leg, supported by the 1D MA50 (blue trend-line).
As long as this line holds, we expect the Bullish Leg to complete a +20.82% rise (similar to December 14 2023) from the U.S. elections low and target $265.00. The fractals are quite similar as the 1W MACD is forming now a Bullish Cross, in indentical fashion as November 20 2023.
-------------------------------------------------------------------------------
** Please LIKE 👍, FOLLOW ✅, SHARE 🙌 and COMMENT ✍ if you enjoy this idea! Also share your ideas and charts in the comments section below! This is best way to keep it relevant, support us, keep the content here free and allow the idea to reach as many people as possible. **
-------------------------------------------------------------------------------
💸💸💸💸💸💸
👇 👇 👇 👇 👇 👇

APPLE Soars! Long Trade Achieves Key Targets – Bulls in ControlApple has displayed a strong uptrend since the long entry at 184.92 on 7th May, 2024, reaching multiple profit targets as the bullish momentum continued.
Key Levels
Entry: 184.92 – The long position was initiated as the price broke above this level, indicating bullish strength.
Stop-Loss (SL): 174.50 – Positioned below recent support to manage risk and protect against a downside move.
Take Profit 1 (TP1): 197.80 – The first target was achieved, confirming the continuation of the uptrend.
Take Profit 2 (TP2): 218.65 – Bullish momentum carried the price to this level.
Take Profit 3 (TP3): 239.50 – A further extension of the rally will bring the price to this target which looks very likely.
Take Profit 4 (TP4): 252.38 – The final profit target, indicating a significant uptrend since the entry.
Trend Analysis
Apple's price is well above the Risological Dotted trendline, affirming the strength of the uptrend. The sustained upward movement suggests strong market sentiment, with the potential for further gains beyond the final target.
The long trade on Apple has performed exceptionally well, with multiple targets reached. The final target at 252.38 reflects a robust rally, supported by the Risological Dotted trendline and consistent buying interest.

APPLE Stock 22% Gain - Profit Target 2 Reached!The APPLE stock price crosses over the Risological swing trader dotted line on on May 3, 2024 giving us a clear bullish trade setup.
LONG Trade Setup
Entry 185.5
Current trailing stop loss at : 203.6
Overall gain from the entry: 22%
Last profit target is at 254.5
Congratulations, who made profit!

APPLE Dont get fooled by the short-term pull-back. $280 on trackExactly 3 months ago (May 02, see chart below), we called for a strong buy signal on Apple (AAPL) and it dully delivered as 2 days ago the stock completed three straight green months with a new All Time High (ATH):
The recent weekly pull-back shouldn't allow you to diverge from the bigger picture and on this analysis we look at it from a 1M time-frame perspective. As you can see, as long as the 1M MA50 (blue trend-line) holds, Apple will continue to be on a 15-year uptrend, which shows very distinct Phases.
Right now we are on the Channel Up that followed the 2022 Inflation Crisis, which was a similar correction to 2015 - 2016 (China's slowdown). The Channel Up that followed peaked at +161% before the next correction towards the 1M MA50. Even the 2013 - 2014 rise was still +145%.
As a result, we don't believe the current Channel Up to be over either, expecting a peak closer to 300. Our Target is marginally below it at $280.00.
-------------------------------------------------------------------------------
** Please LIKE 👍, FOLLOW ✅, SHARE 🙌 and COMMENT ✍ if you enjoy this idea! Also share your ideas and charts in the comments section below! This is best way to keep it relevant, support us, keep the content here free and allow the idea to reach as many people as possible. **
-------------------------------------------------------------------------------
💸💸💸💸💸💸
👇 👇 👇 👇 👇 👇
