AR is close to a dropFrom the place where we entered "START" on the chart, our correction has started.
AR seems to be forming a triangle.
We are now in wave D of this triangle. Wave D is a large diametric.
We are now in the last wave of this diametric
In the red box, we wait for wave D to end and enter wave E.
Wave E here is a bearish wave.
The targets are marked on the picture.
Closing a daily candle above the invalidation level will violate the analysis.
invalidation level : 53.9936
For risk management, please don't forget stop loss and capital management
When we reach the first target, save some profit and then change the stop to entry
Comment if you have any questions
Thank You
Arusd

Arweave AR price shows strong movement#Arweave is a decentralised storage network. It's up to you to study it and share your thoughts in the comments ;)
Our attention was drawn to this asset by "pattern" that market players draw on the #ARUSDT chart.
From what we can see on the chart, the NYSE:AR price is confidently "pushing" upwards. The price has now reached a strong level of $44 for the third time.
And then there are 2 options:
1️⃣ or breakout and consolidate above $44 now and continue to grow rapidly.
2️⃣ or now the #ARUSD price is correcting to around $33 and will break out strong level from the 4th time.
Guessing which scenario will work out is not a "good idea"
You need to follow the chart and jump on the side of the stronger players in time.
But for sure, at the moment, the chart shows interest in #AR and the global upward trend.
_____________________
Did you like our analysis? Leave a comment, like, and follow to get more

AR second breakout is going on !AR / USDT
The chart says itself
We can see a new bullflag pattern breakout
As long as this pattern is holding the target is around ATH and higher !
Best of wishes

ARUSD 1WAR ~ 1D
#AR Forming a Bull Flag Pattern. We will Consider making purchases gradually within this pattern. with a minimum target of 15%+

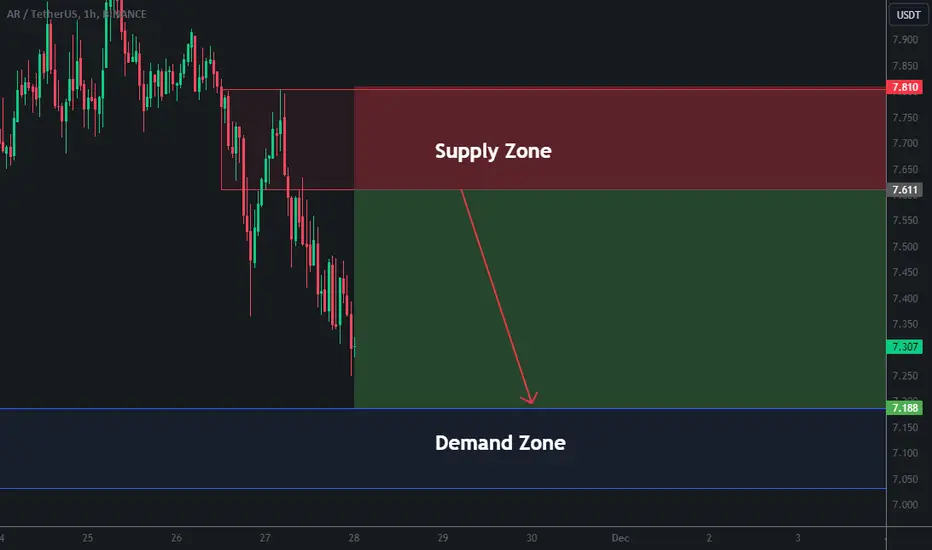
AR ANALYSIS (4H)AR has a strong resistance range ahead.
A downward reversal pattern appears to be forming.
When you reach the supply range, you can look for sell/short positions.
Demand range can be a good place to save profit.
Closing a daily candle above the invalidation level will violate the analysis
For risk management, please don't forget stop loss and capital management
When we reach the first target, save some profit and then change the stop to entry
Comment if you have any questions
Thank You

Testing Support at $33AR is presenting a clear narrative on the 4-hour chart. With the current price at $33, AR has shown some weakening in its bullish momentum, as indicated by the price movement converging with a dynamic resistance level and falling back.
The chart details a point where the price has lost its upward drive and indicates that this could be a pivotal area for future price action. The Bollinger Bands show that the price has pulled back from the upper band and is now closer to the lower band, which could act as a short-term support.
The volume is moderate at 53.6K, which doesn't suggest an overwhelming market consensus in either direction at this time. The Moving Average Convergence Divergence (MACD) histogram has ticked up slightly, yet the MACD line remains below the signal line, indicating that the bullish trend may be running out of steam.
The Stochastic Oscillator, while not in the oversold territory, is trending downwards, suggesting that the momentum could be shifting. Moreover, the Relative Strength Index (RSI) is hovering around the midpoint, aligning with a neutral market sentiment without strong bias to either buying or selling pressure.
Given these indicators, traders might be cautious, watching to see if the local support level holds, which could offer a rebound opportunity, or if the price will break through this support and explore lower levels. The area marked as 'Local Support' on the chart will be particularly important; if this level doesn't hold, it could lead to further declines. Conversely, if the price maintains above this support, it could signal a potential recovery or consolidation phase.
The intersection of these technical elements—price action, indicators, and support/resistance levels—will guide traders' decisions in the near term.

Arweave #AR Inverse head and shoulders Should give you a double.Pretty clean inverse head and shoulders
Arweave has already been a big winner for us
as we identified a falling wedge pattern which gave us massive opportunity for upside profit potential ..
This target may take a little longer to achieve
but early entry holders could easily be sitting on a 5-6X by then on their spot purchases!

Arweave (AR) is setting up for upto 20.50% pumpHi dear members , hope you are well and welcome to the new trade setup of Arweave (AR) coin with US Dollar pair.
Recently we caught almost 331% pump of AR as below:
Now on a 2-hr time frame, AR is completing the final leg of a bullish BAT move for the next pump.
Note: Above idea is for educational purpose only. It is advised to diversify and strictly follow the stop loss, and don't get stuck with trade.

AR NEW INCREASE VOLUMEThank you for reading this update.
AR seems to have entered a new volume trend that could get new confirmations in new time frames.
The data frame shows an interesting view of AR

Arweave - #AR Another Falling wedge structureArweave is coming into a minor resistance level
But it is a good example of a falling where the price action gets cornered into the end of the wedge
before breaking out to the upside
I expect we could see #Arweave surpass the 0.618 Fibonnaci after a pause and go on to hit 50% retracement. As per a measured move taking the top of the wedge distance to the breakoutpoint.

AR UPDATE (4H)This analysis is an update of the analysis that you can see at the bottom of this page, in the related analysis section
AR has also changed its structure to a triangle and has broken the resistance of the previous analysis
We have a flip zone, if the price pullback to the green flip zone, we will enter a Buy/Long position
For risk management, please don't forget stop loss and capital management
Comment if you have any questions
Thank You

AR ANALYSIS (6H)We have a large liquidity pool on the chart, which we have marked with $$$. This pool is expected to be swept soon
The F wave of the large diametric is also completed and we need a drop for the G wave.
In this part of the chart we focus on wave F and G. AR can move from supply to demand
For risk management, please don't forget stop loss and capital management
Comment if you have any questions
Thank You

ARUSDTBINANCE:ARUSDT Just started
⛔"Daily crypto market analyses I provide are personal opinions & not financial advice. Trading carries risks, so do your own research & seek advisor's help.#DYOR"
Don't forget to like and comment

ARUSDT Sell LimitSupply Demand zones on AR H1 chart. Sell Limit order placed on 7.6 level. Risk reward 1/2 ... Bitcoin has some kind of consolidation so we can try to make money on short positions...
ARUSD Above the 1W MA50 but needs one final bullish confirmationArweave (ARUSD) broke and established itself above the 1W MA50 (red trend-line) for the first time in its history. That is a major long-term bullish signal, and it is no surprise that since it held it as Support on Friday, it is rising strongly over the weekend.
We would ideally prefer to see the price break also above the top (Lower Highs trend-line) of the 15 month Channel Down in order to buy with the lowest risk possible. Our target is Resistance 1 (previous Lower High of the Channel) at 14.900.
-------------------------------------------------------------------------------
** Please LIKE 👍, FOLLOW ✅, SHARE 🙌 and COMMENT ✍ if you enjoy this idea! Also share your ideas and charts in the comments section below! This is best way to keep it relevant, support us, keep the content here free and allow the idea to reach as many people as possible. **
-------------------------------------------------------------------------------
💸💸💸💸💸💸
👇 👇 👇 👇 👇 👇

AR/USDT potential shift? 👀 🚀 AR Today Analysis💎 Paradisers, direct your attention to ARUSDT as it showcases a captivating trajectory. Currently positioned within a demand zone, it seems to have secured buying liquidity and is gearing up for a potential bullish surge.
💎 AR has been navigating within a channel formation for an extended period. Having recently made contact with the channel's support, it's now reigniting its upward momentum. We're confident in its potential to ascend towards our anticipated resistance level.
💎 However, it's crucial to remain vigilant. Should the price breach the demand zone, there's a strong likelihood it will gravitate back to the support level for another retest.
💎 Remember to employ prudent trading strategies and use proper stop-loss measures! Stay alert to market movements and look forward to more insight

This beast may explode hardly #AR+ Super long timeline accumulated
+ A huge descending wedge
NOT FINANCIAL ADVICE...

AR 6H BUYAR 6H support is now at ~$4.2
Enter 50% at the current price
and try to set some BUY orders near the support zone
If AR stays above the trendline,
the Take-Profit target would be 5%, 10%, and 15% from your entry
Cheers

AR / ARUSDTGOOD LUCK>>>
• Warning •
Any deal I share does not mean that I am forcing you to enter into it, you enter in with your full risk, because I'll not gain any profits with you in the end.
The risk management of the position must comply with the stop loss.
(I am not sharing financial or investment advice, you should do your own research for your money.)

AR forming bullish divergence AR is currently at 4.16 price Level and forming a clear bulish divergence on 8h time frame which can cause good pump in AR very soon. And also double bottom on Weekly Chart.

Ar sideway bearish#Ar is in descending channel. Price will dump slowly with small pump dumps by staying in the channel.
Wait for channel breakout, if price goes above the channel then Bullish Scenario will be considered.

Arweave(AR) will FALL by the🗻Triple 🗻Top Pattern🗻Hi everyone👋
📚 What is Arweave(AR) ❗️❓
Arweave is a decentralized storage network that seeks to offer a platform for the indefinite storage of data. Describing itself as "a collectively owned hard drive that never forgets," the network primarily hosts "the permaweb" — a permanent, decentralized web with a number of community-driven applications and platforms.
The Arweave network uses a native cryptocurrency, AR, to pay "miners" to indefinitely store the network's information.
The project was first announced as Archain in August 2017, later rebranding to Arweave in February 2018 and officially launching in June 2018.
--------------------------------------------------------------------------------
📈 Technical :
Arweave(AR) was able to make a Triple Top Pattern on the 🔴 resistance zone($6.30-$6.00) 🔴.
Also, we can see Regular Divergence(RD-) between the three tops.
Arweave(AR) broke the 🟢 support zone($5.54-$5.45) 🟢.
🔔I expect Arweave(AR) will fall to the next 🟢 support zone($4.90-$4.80) 🟢.
Arweave Analyze ( ARUSDT ), 4-hour time frame ⏰.
Do not forget to put Stop loss for your positions (For every position you want to open).
Please follow your strategy, this is just my idea, and I will gladly see your ideas in this post.
Please do not forget the ✅' like '✅ button 🙏😊 & Share it with your friends; thanks, and Trade safe.

AR LOOKS BULLISH (6H)Hi, dear traders. how are you ? Today we have a viewpoint to BUY/LONG the AR symbol.
The diameter of the large E branch is ending. I expect upward movements from the specified range
For risk management, please don't forget stop loss and capital management
When we reach the first target, save some profit and then change the stop to entry
Comment if you have any questions
Thank You
