AR/USDT — Major Reversal or the Start of Breakdown?ARWEAVE (AR/USDT) is now standing on the edge of its most critical support zone between $4.4–$3.7 (highlighted in yellow).
This zone has acted as a major historical demand area since 2023 — the last stronghold where institutional accumulation often takes place.
But this time, the market has shown something different:
A deep wick below $3.7 indicates a massive liquidity grab, suggesting that the market might have flushed out weak long positions and stop orders before deciding its next major move.
---
Technical Structure & Pattern
Macro trend: Still in a structural downtrend since early 2024 (lower highs and lower lows).
Key support zone: $4.4–$3.7 remains a major reaction area that has repeatedly absorbed selling pressure.
The long wick below support suggests a potential fake breakdown or bear trap, especially if price reclaims $4.4–$6.0 in the next few candles.
Failure to hold above $3.7 would confirm a bearish continuation pattern and shift market sentiment further downward.
---
Bullish Scenario
📈 Accumulation Reversal Setup
If price successfully holds above $4.4–$3.7 and manages to close above $6.075, it could mark the beginning of a mid-term reversal.
This setup is often accompanied by strong volume spikes, bullish engulfing candles, and a new higher low formation above the support.
🎯 Upside Targets:
Target 1: $8.395 — first major resistance and reaction zone.
Target 2: $10.882 — key breakout confirmation level.
Long-term targets: $26.989 and $47.674, if the macro reversal strengthens into a new bullish cycle.
This could become the foundation of a re-accumulation phase, similar to previous cycle bottoms.
---
Bearish Scenario
📉 Final Breakdown and Capitulation Risk
If the price closes a 5D candle below $3.7 and fails to reclaim the zone, it would confirm that the yellow block has turned into a new resistance area.
This would signal a final distribution phase before potential capitulation.
🎯 Downside Targets:
Target 1: $3.0 — next psychological and structural support.
Target 2: $2.4 — historical low based on previous liquidity sweep.
A confirmed breakdown below this zone could trigger capitulation, flushing out remaining long positions before the next accumulation cycle begins.
---
Conclusion
ARWEAVE is currently at a make-or-break zone ($4.4–$3.7) that will define its medium-term direction.
If buyers defend this level, the market could form a strong base for a major reversal.
However, if the support gives way, AR might revisit $3.0–$2.4 before finding a true bottom.
This zone represents a high-stakes battle between bulls and bears —
and the next few candles will decide whether we’re witnessing the birth of a new uptrend, or the continuation of the final downtrend leg.
---
#ARWEAVE #ARUSDT #CryptoAnalysis #TechnicalAnalysis #PriceAction #SupportZone #LiquidityGrab #MarketStructure #AltcoinAnalysis #CryptoTrading #DecisionZone #SwingTrade
Arusdtidea

ARUSDT 5D AnalysisAR ~ 5D Analysis
#AR This is the lowest support for now. Buy back from here with a short term target of at least 15%++ from this support.

ARUSDT 1D AnalysisAR ~ 1D Analysis
#AR Buy on retest of this support block with short term target of at least 10%+ from here.

ARUSDT 5DAR ~ 5D Analysis
#AR Buy back while visiting this support with a short -term target of at least 15%+.

ARUSDT 5DAR ~ 5D Analysis
#AR If you still have a Conviction on this Coin, Maybe this support block you can consider to start buying again from here.

ARUSDT 5DAR ~ 5D Analysis
#AR If you still have a Conviction on this coin,. Buy from here with a minimum target of 20%++

ARUSDT 1WAR ~ 1W
#AR If you still have Conviction on this coin,. Buy gradually within this support block,. with a short term target of at least 20%++

ARUSDT: Potential Support at the Blue BoxesIn this analysis, the blue boxes are highlighted as critical support areas to monitor. These zones are noteworthy because:
They serve as demand areas, where buying pressure could emerge.
They act as the first line of defense, potentially preventing further downward movement.
Trading Strategy
Lower Time Frame Reactions: Pay close attention to how the price behaves within the green lines and blue box zones. Look for signs of bullish momentum, such as candlestick reversals or increased buying volume.
Long Trade Opportunities: If favorable reactions are observed, traders can structure long trades with clear risk management, using the lower time frame signals for precise entry points.
Summary
The blue boxes in ARUSDT present an attractive opportunity to catch potential reversals from key support zones. By combining insights from the green lines and monitoring lower time frames, traders can position for upside while minimizing risk.
I keep my charts clean and simple because I believe clarity leads to better decisions.
My approach is built on years of experience and a solid track record. I don’t claim to know it all, but I’m confident in my ability to spot high-probability setups.
My Previous Analysis
🐶 DOGEUSDT.P: Next Move
🎨 RENDERUSDT.P: Opportunity of the Month
💎 ETHUSDT.P: Where to Retrace
🟢 BNBUSDT.P: Potential Surge
📊 BTC Dominance: Reaction Zone
🌊 WAVESUSDT.P: Demand Zone Potential
🟣 UNIUSDT.P: Long-Term Trade
🔵 XRPUSDT.P: Entry Zones
🔗 LINKUSDT.P: Follow The River
📈 BTCUSDT.P: Two Key Demand Zones
🟩 POLUSDT: Bullish Momentum
🌟 PENDLEUSDT.P: Where Opportunity Meets Precision
🔥 BTCUSDT.P: Liquidation of Highly Leveraged Longs
🌊 SOLUSDT.P: SOL's Dip - Your Opportunity
🐸 1000PEPEUSDT.P: Prime Bounce Zone Unlocked
🚀 ETHUSDT.P: Set to Explode - Don't Miss This Game Changer
🤖 IQUSDT: Smart Plan
⚡️ PONDUSDT: A Trade Not Taken Is Better Than a Losing One
💼 STMXUSDT: 2 Buying Areas
🐢 TURBOUSDT: Buy Zones and Buyer Presence
🌍 ICPUSDT.P: Massive Upside Potential | Check the Trade Update For Seeing Results
🟠 IDEXUSDT: Spot Buy Area | %26 Profit if You Trade with MSB
📌 USUALUSDT: Buyers Are Active + %70 Profit in Total

ARUSDT 2DAR Update ~ 2D
#AR If you still have Conviction on this coin,. Buy gradually within this support block,. With a minimum target of 20%++

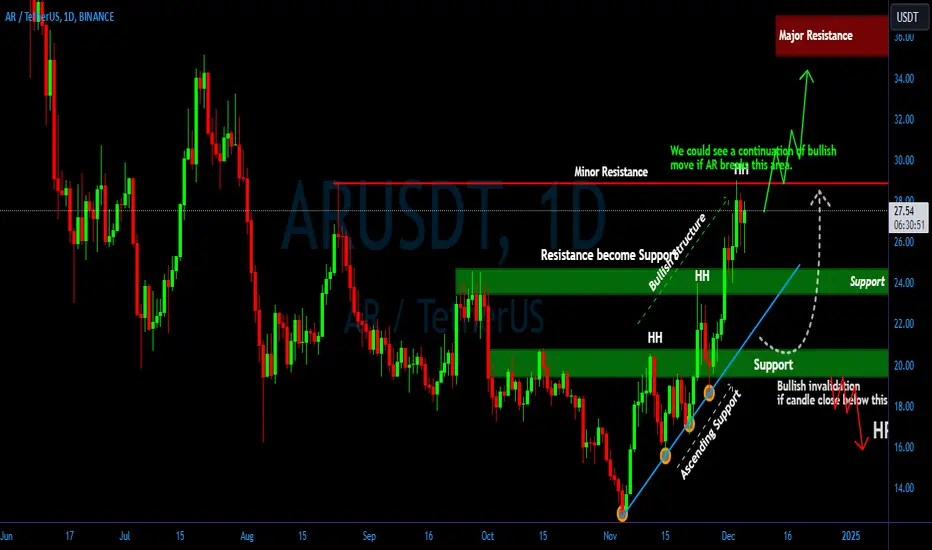
ARUSDT Will the Bulls Take Control or Are We Heading for a Deep?Yello, Paradisers! Is #ARUSDT about to break free and soar, or are we staring at a potential drop to key support zones? Let’s dive in and unpack this critical setup.
💎Currently, #AR is respecting its support level, showing signs of a potential bullish continuation. if it successfully breaks the minor resistance at $28.85. Should this breakout occur, we anticipate a mid-term bullish movement, with the highest probability of the price reaching our target at the major resistance zone.
💎However, if AR fails to break the minor resistance, the price may consolidate in a sideways range between $24.60 and $23.00, as it seeks to decide its next move.
💎If AR breaks down below the support, the price could retrace significantly, potentially testing the **second support area at $20.70 - $19.40. Historically, this support zone has held strong multiple times, offering buyers a solid re-entry point. Should the price revisit this area, we expect a similar reaction.
💎However, bullish invalidation occurs if the price closes below $19.40. In such a case, AR could continue its downward trend, exposing the market to further dips.
Stay alert and remember, disciplined trading is the only way to navigate uncertain markets. Always plan your trades carefully, wait for confirmations, and protect your capital. Let’s stay smart and focused, Paradisers!
MyCryptoParadise
iFeel the success🌴
ARUSDT 3DAR ~ 3D
#AR Still moving in this descending pattern. If you still have Conviction on this coin,. Make buy gradually in this pattern. with a minimum target of 20%+,.

ARUSDT 2DAR ~ 2D
#AR If you still have Conviction on this coin,. Make buy gradually in this pattern. with a minimum target of 15%++

ARUSDTAR ~ 1D
#AR Make purchases gradually after breaking through the resistance line of this descending pattern.

ARUSDTAR ~ 1D
#AR Make purchases gradually after breaking through the resistance line of this descending pattern.

ARUSD 1WAR ~ 1D
#AR Forming a Bull Flag Pattern. We will Consider making purchases gradually within this pattern. with a minimum target of 15%+

#ARUSDT #ARUSDT
The price has been moving in a bearish trend since July 2022
We are now on the verge of breaking through this science
Likewise, another bullish-bearish triangle pattern inside the flag was broken upward, giving us momentum to rise
Current price 8.98
The first goal is 14.68
Second goal 18.64
Which represents 200% of the current price

ARUSDTBINANCE:ARUSDT Just started
⛔"Daily crypto market analyses I provide are personal opinions & not financial advice. Trading carries risks, so do your own research & seek advisor's help.#DYOR"
Don't forget to like and comment

ARUSDT AnalysisHello traders,
Based on the chart,
The asset has come to a strong support zone, you can try to open a long position with a good risk-to-reward ratio
Entry: market and lower
Targets: 12 - 15 - 20
after first target reached move ur stop in breakeven!
SL: ~7
Risk/Reward: 1 to 6
Good luck!
Please, feel free to share your point of view, write it in the comments below, thanks!
