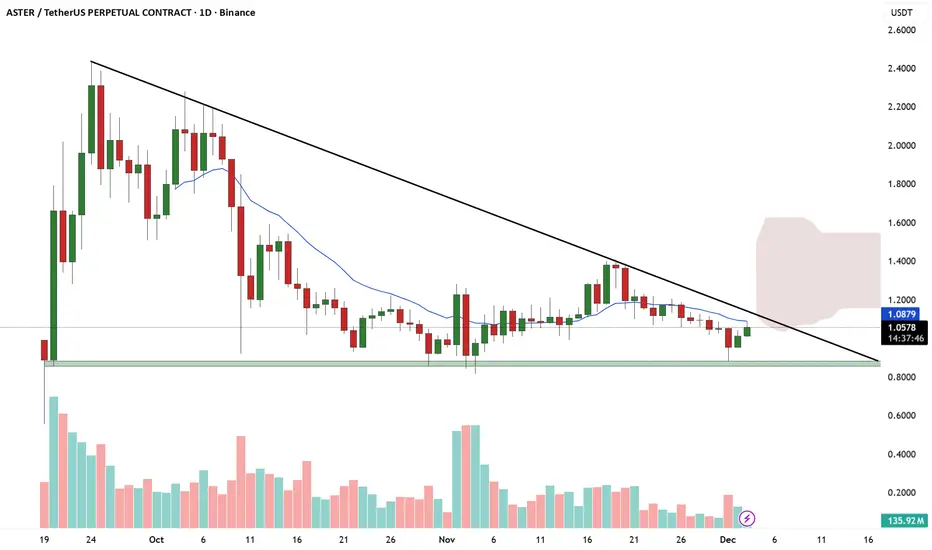
$ASTER/USDT ANALYSISOn the 1-day chart, **ASTER/USDT** is moving within a clear descending triangle structure, showing consistent lower highs while holding a strong horizontal support around the **$0.97–$1.00** zone. Price has recently bounced slightly from this demand level but remains capped below the descending trendline resistance, which has been respected multiple times since October. The candles are showing mild recovery momentum, yet the 9-EMA is still acting as dynamic resistance, keeping the overall bias mildly bearish until a decisive breakout occurs.
Volume is relatively stable but lacks the strong uptick usually seen before a breakout, suggesting that buyers are cautious. If the price sustains above the EMA and breaks cleanly above the descending trendline near **$1.10–$1.12**, it could trigger a bullish reversal toward **$1.25–$1.40**. However, a daily close below **$0.97** would likely lead to further downside continuation toward **$0.88–$0.85**. Overall, the pair is at a key compression point — consolidation near support inside a falling wedge — and the next breakout will define the medium-term trend direction.
Asterusdtlong
ASTER — Fresh Short Outlook After Re-Entry ConfirmationHey everyone 👋
Even though I closed my previous idea on Aster because I briefly doubted whether the price would actually move lower, the chart eventually confirmed its intention to decline — and even below the targets I set in that earlier publication.
With the structure now much clearer, I’m re-entering the idea with updated targets:
🎯 Target 1: 1.1
🎯 Target 2: 1.0
🎯 Target 3: 0.94
❌ Idea Cancel Zone: 1.186
Let me know what you think in the comments — your feedback helps me decide which assets to analyze next💬
⚠️ Disclaimer: This is not financial advice. I share my personal view of the market — always do your own research before making trading decisions

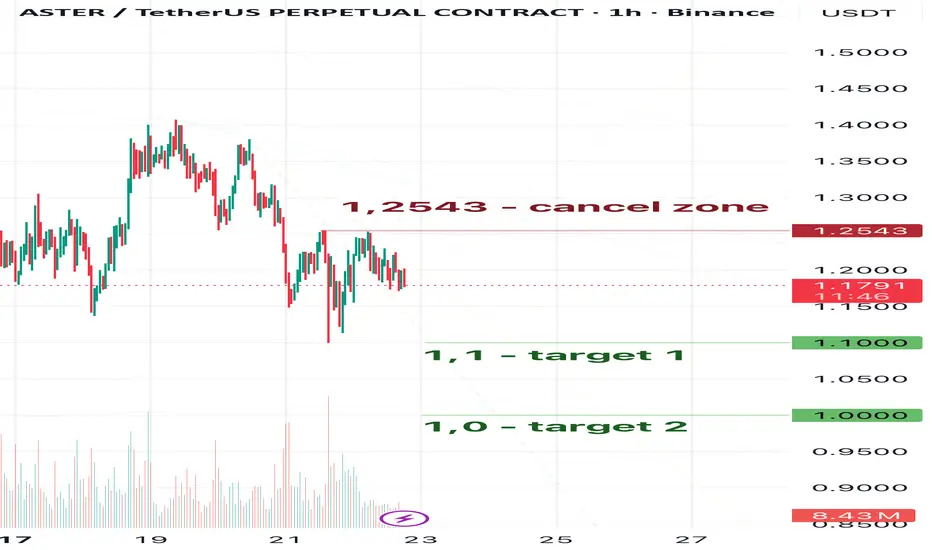
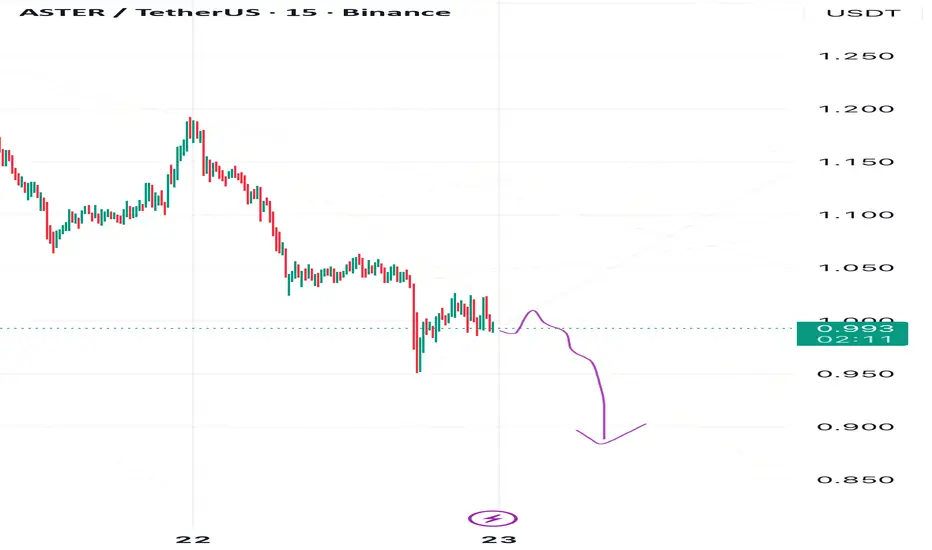
ASTER — Pre-Drop Positioning & Key Levels Hey everyone. 👋
Hope your week has been productive. Even though it’s Saturday, the market keeps signaling that decisive moves are coming.
One of them is Aster — and in my view, it’s preparing for a controlled downside move.
Here are the key targets I’m watching:
🎯 Target 1: 1.01
🎯 Target 2: 1.00
❌ Invalidation Zone: 1.2543
⚠️ Disclaimer: This is not financial advice. Follow your own trading system and always manage risk — stop-losses are mandatory.
If this asset interests you, drop a reaction or a comment. 💬
It helps me understand whether you want more consistent updates and market insights on Aster.
Aster Falling Faster Aster for me has confirmed an even stronger desire to move lower — I have no doubts left that it will drop to 0.076.
In my previous post, I already listed all my targets for this coin.
For now, I’m watching the 0.1 level as the next most visible target,
with the invalidation zone at 0.1366.
⚠️ This is not a trading signal, just my personal forecast. Always trade with stop losses!
This is already my second update on Aster tonight — I regularly share updates on my forecasts when you leave reactions.
So don’t forget to follow and react if you find this useful! 💬📉

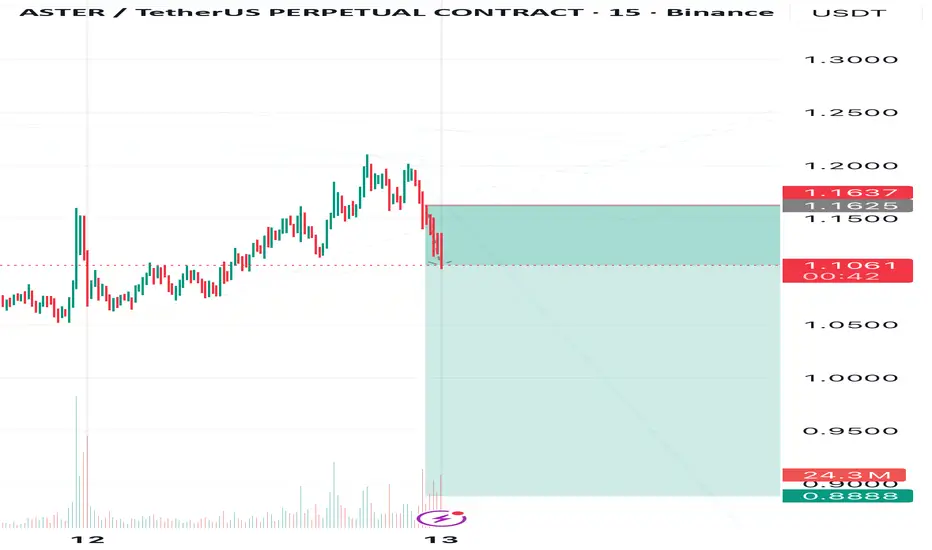
Aster’s Fate — Too Early to CelebrateEven though my invalidation zone in the previous Aster idea was broken, I’m still holding my view — Aster looks ready to continue its move down.
For now, I expect Aster around 0.8888, but my final target is 0.76.
Let’s break this path into a few steps:
🎯 Target 1: 0.116
🎯 Target 2: 0.104
🎯 Target 3: 0.9
🎯 Target 4: 0.76
❌Invalidation zone: 1.1637
⚠️ This is not a trading signal — just my personal forecast.
Always trade with stop-losses and follow me to catch updates, because I post new ones as soon as the chart changes.
💡 And remember — consistent profits come from proper risk control. Even if 50% of trades get stopped out, risk management keeps us growing.
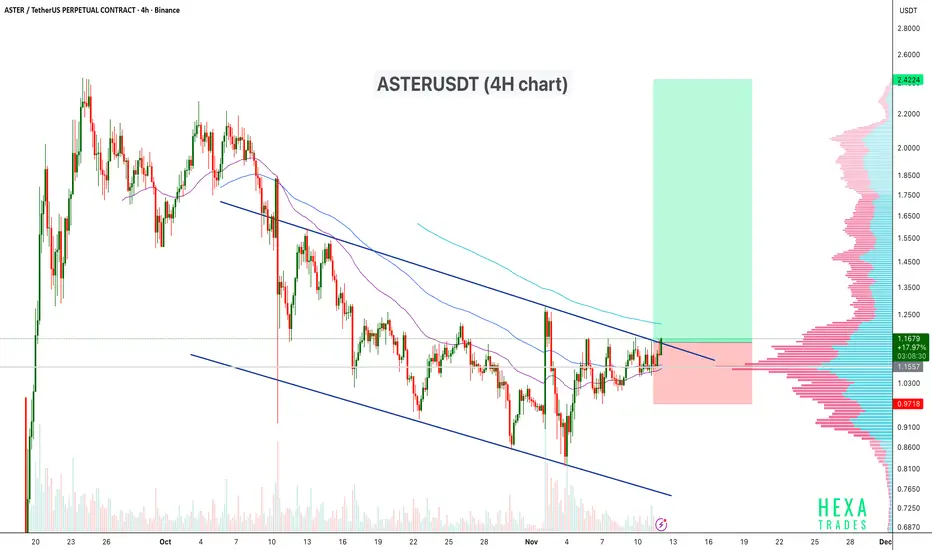
ASTERUSDT Breaking Out of the Descending Channel?ASTERUSDT is trading within a descending channel on the 4H chart, showing consistent lower highs and lower lows over the past few weeks. The price is now testing the upper trendline of the channel, signaling a potential breakout attempt. A confirmed breakout with volume could indicate a shift in trend momentum toward a bullish reversal.
Pattern: Descending Channel
Entry Zone: Near $1.15–$1.18 (breakout confirmation)
Stop-Loss: Below $0.96
If the breakout sustains above the upper trendline and 200 EMA, we may see strong bullish continuation towards the next resistance levels.
Cheers
Hexa
Aster RollercoasterThe picture in Aster doesn’t look too bright right now — things are getting a bit shaky here. I’m expecting a move down toward 0.9
Though if you remember, friends, according to my global forecast, I still see Aster possibly reaching 0.76, but for now, my target is 0.9.
Let’s see how the price reacts as we approach that zone.
❌Invalidation zone: 1.1201
⚠️ This is not a trading signal — make your own decisions and always trade with stop-losses.
💬 Drop your reactions, share your thoughts in the comments, and follow me if you want to see regular Aster updates! 🚀

#ASTER/USDT Support and Resistance Levels — Technical Analysis#ASTER
The price is moving in a descending channel on the 1-hour timeframe and is expected to break out and continue upwards.
We have a trend to stabilize above the 100-period moving average again.
We have a downtrend on the RSI indicator, which supports an upward move if it breaks above it.
We have a key support zone in green that pushed the price higher at 0.9300.
Entry price: 1.029
First target: 1.067
Second target: 1.115
Third target: 1.18
For risk management, don't forget your stop-loss and capital management.
The stop-loss is below the support zone in green.
Upon reaching the first target, take some profit and then change your stop-loss order to an entry order.
For any questions, please comment.
Thank you.

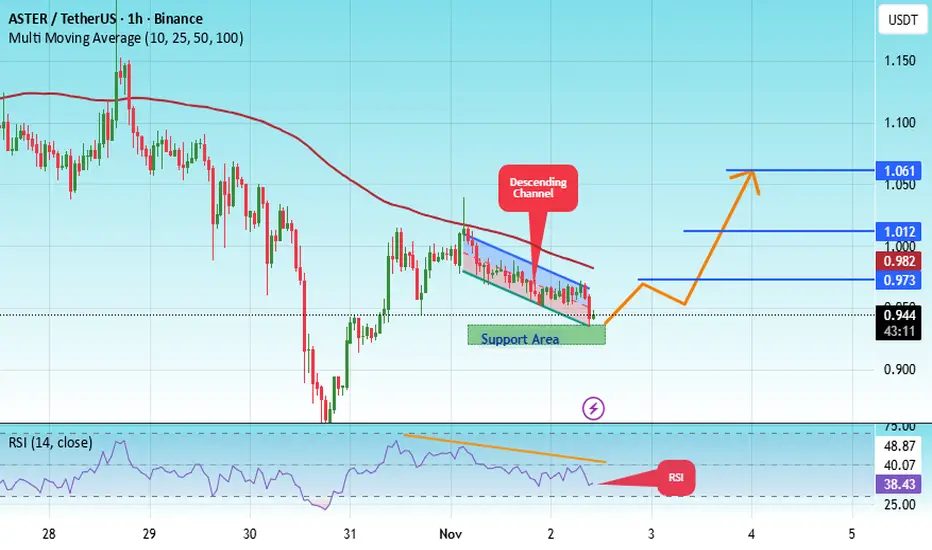
#ASTER/USDT ASTER wake up neo#ASTER
The price is moving within an ascending channel on the 1-hour timeframe and is adhering to it well. It is poised to break out strongly and retest the channel.
We have a downtrend line on the RSI indicator that is about to break and retest, which supports the upward move.
There is a key support zone in green at the price of 0.927, representing a strong support point.
We have a trend of consolidation above the 100-period moving average.
Entry price: 0.948
First target: 0.973
Second target: 1.012
Third target: 1.06
Don't forget a simple money management rule:
Place your stop-loss order below the support zone in green.
Once the first target is reached, save some money and then change your stop-loss order to an entry order.
For any questions, please leave a comment.
Thank you.
ASTERUSDT — Is This the Start of Reversal from the Falling WedgeThe ASTER/USDT pair is currently standing at a critical juncture, right inside the key demand zone between 1.015 – 0.945 — a level that has acted as the “last fortress” for buyers since October.
The structure forms a classic Falling Wedge pattern, a setup that often signals the end of a mid-term downtrend and the potential beginning of a reversal phase.
After weeks of bearish momentum, price action now shows signs of seller exhaustion, as ASTER attempts to break above the upper wedge trendline — a key sign that bullish momentum might be awakening.
However, the recent long candle rejection from the top indicates that a tight battle between bulls and bears is still in play.
---
📊 Pattern & Technical Structure
Falling Wedge Pattern → historically leads to bullish reversals once accumulation completes.
Yellow Zone (1.015 – 0.945) → acts as the primary demand/retest area, determining whether the breakout holds or fails.
Breakout Attempt → price already tested above the wedge, but a confirmed 6h close above 1.05 is required for validation.
Resistance Targets:
R1: 1.21 — minor resistance
R2: 1.505 — mid-level resistance
R3: 1.79 – 2.08 — major extension targets if momentum expands
---
🟩 Bullish Scenario (If Breakout Confirmed)
If the price manages to close above 1.05 with increasing volume, it would validate the Falling Wedge breakout, potentially opening a rally toward 1.21, 1.505, and even 1.79 as buying strength accelerates.
Entry Zone: above 1.05 (confirmed breakout)
Key Support: 0.945
Targets: 1.21 → 1.505 → 1.79+
Bullish Catalysts: demand zone holding + wedge breakout confirmation
Extra Confirmation: volume spike, RSI turning upward from neutral zone
> Bullish narrative: “If the demand zone holds and buyers reclaim control, ASTER could be entering the first stage of a mid-term reversal.”
---
🟥 Bearish Scenario (If Breakout Fails / Fakeout)
However, if ASTER fails to hold above 1.015 and closes back below 0.94, it would confirm a fake breakout, likely sending the pair back toward the lower wedge region around 0.78–0.72.
Bearish trigger: 6h candle close below 0.94
Targets: 0.78 → 0.72
Invalidation: reclaim above 1.05 with strong volume
Confirmation: red candle expansion + rising sell volume
> Bearish narrative: “Failure to hold the demand zone could invite another wave of selling pressure back into the lower wedge.”
---
🔎 Summary
ASTER is now at a major decision point.
The yellow zone at 1.015 – 0.945 will define whether this marks the beginning of a strong reversal or the continuation of the downtrend.
A confirmed breakout could ignite a bullish momentum run toward 1.79 – 2.08,
while a breakdown below 0.94 could lead to a deeper retracement toward 0.78 – 0.72.
Volume confirmation and price reaction around this zone will decide ASTER’s next major move.
#ASTER #ASTERUSDT #CryptoAnalysis #TechnicalAnalysis #FallingWedge #Breakout #PriceAction #Altcoins #CryptoTrading #SupportResistance #MarketStructure #SwingTrade #DeFi

ASTER on the Edge — The Next Big PledgeIn my view, ASTER is currently forming a descending diagonal triangle.
Earlier, I mentioned that my downside target for ASTER is around 0.76.
I believe we’re now completing wave 4, after which the price may decline
toward my target zone.
After that, a breakout to the upside is expected —
and I think ASTER has the potential to rise toward 1.4–1.6.
But first, let’s see how it behaves during the upcoming decline.
This is just one of my possible scenarios —
not financial advice or a guaranteed outcome

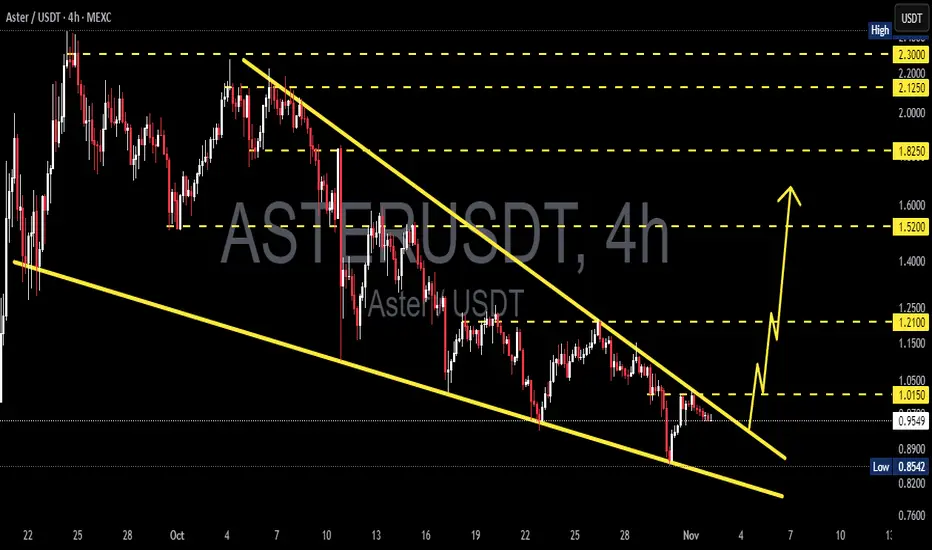
ASTER/USDT – Major Breakout Potential from a Falling Wedge?The ASTER/USDT pair currently shows a very interesting technical structure, where price has been moving inside a Falling Wedge pattern since mid-October.
This formation is widely recognized as one of the most powerful bullish reversal patterns, signaling that selling pressure is weakening while buyers begin to take control.
At the moment, price is hovering around $0.95, approaching the apex of the wedge, which indicates that the consolidation phase is nearing a breakout point. The contracting volume reflects that the market is waiting for confirmation of the next major move.
---
Main Pattern Characteristics
Falling Wedge Pattern:
Two converging downward-sloping trendlines clearly define this setup, showing that sellers are losing strength.
Historically, this pattern often ends with a bullish breakout, especially when it forms after a long downtrend.
Volume & Momentum:
Volume has been decreasing throughout the wedge formation, which is normal — but a strong breakout is typically confirmed by a sharp volume surge.
Watch for bullish RSI divergence (price making lower lows while RSI makes higher lows) as an early confirmation of a potential reversal.
---
Bullish Scenario
If ASTER manages to break and close above the wedge resistance area near $1.01 – $1.05 on the 4H timeframe, it would mark a strong bullish reversal signal.
Gradual upside targets:
1. $1.21 – First breakout confirmation target.
2. $1.52 – Key psychological resistance.
3. $1.82 – $2.10 – Momentum expansion zone where buyers could dominate.
4. $2.30 – Extended target if the bullish rally strengthens.
A strong breakout with rising volume could be the starting point of a new bullish trend for ASTER.
---
Bearish Scenario
Conversely, if price fails to break above resistance and drops back below $0.89 – $0.85, a breakdown scenario could unfold, targeting the $0.76 area.
A close below wedge support would confirm that sellers still have control.
However, statistically, falling wedge structures are more likely to resolve bullishly, as long as the price does not close decisively below the lower boundary.
---
Summary
The ASTER/USDT chart is currently at a critical decision point — between continued consolidation or the beginning of a major reversal.
Technically, the combination of a tightening wedge, declining volume, and possible RSI divergence indicates that a major breakout may be approaching.
If confirmed, bullish momentum could accelerate rapidly, supported by growing liquidity near the wedge’s lower range.
#ASTER #ASTRUSDT #FallingWedge #CryptoBreakout #TechnicalAnalysis #ChartPattern #BullishSetup #CryptoMarket #SwingTrade #PriceAction #ReversalPattern #CryptoAnalysis
From fall to rise — ASTER’s next surpriseI’m expecting a final drop on ASTER into the 0.88 – 0.84 zone.
After that, in my view, ASTER should start gradually forming a reversal,
with potential growth targets around 1.3-1.6.
Let’s see if this “disaster” turns into a comeback story

Aster’s dive before it can reviveUpdate on my Aster forecast.
Both of my previous downside targets have been reached — we saw Aster drop to 1.05 and then to 0.989.
Now I expect Aster might continue its decline toward 0.88 , and only then we can start talking about a potential reversal
ASTER Slide, Watch the Tide ASTER Update 🚀📉
👀 Current view: Consolidation around 1.0-1.112
🎯 Target 1: 1.05
🎯 Target 2: 0.989
❌ Invalidation level: 1,132
📌 Follow me to stay updated and never miss my forecasts!

ASTER Correction Ending Soon? Watch These Levels!Today, I want to dive into one of these week’s trending tokens in the crypto space that a lot of users have been talking about: the Aster project , with the token symbol ASTER ( BINANCE:ASTERUSDT ).
So, what exactly is Aster?
Aster is a next-gen DEX for spot and perpetuals with MEV-free one-click Simple Mode and a Pro Mode offering 24/7 stock perps, Hidden Orders, and grid trading across BNB Chain( BINANCE:BNBUSDT ), Ethereum( BINANCE:ETHUSDT ), Solana( BINANCE:SOLUSDT ), and Arbitrum( BINANCE:ARBUSDT ). It boosts capital efficiency by letting traders use asBNB (liquid-staking BNB) and USDF (yield stablecoin) as collateral. Built on the high-performance, privacy-focused Aster Chain and backed by YZi Labs, its ASTER token powers governance, growth incentives, and long-term sustainability.
In this post, we’ll see whether ASTER might be a good addition to your portfolio and if it still offers a solid investment opportunity. Stay tuned!
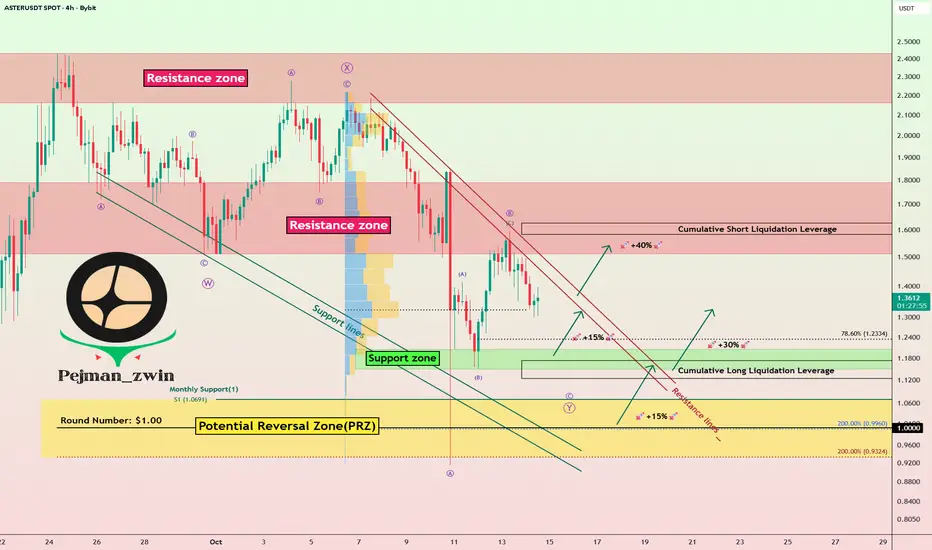
Right now, it looks like ASTER has completed its pullback to a broken Support zone($1.790-$1.511) and has started to decline again. The key levels to watch now are the Resistance lines that could determine its trend direction .
From an Elliott Wave perspective , it seems that ASTER is finishing a microwave C of main wave Y in a Double Three Correction(WXY) .
I expect that from either the nearby Support zone($1.150-$1.2050) or Potential Reversal Zone(PRZ) , ASTER could start to rise again. Depending on overall market conditions, this rebound could range from about +15% to even +40% .
Cumulative Short Liquidation Leverage: $1.6257-$1.5825
Cumulative Long Liquidation Leverage: $1.1732-$1.1236
What do you think about the Aster project? Does it still have room to grow? Share your thoughts!
Please respect each other's ideas and express them politely if you agree or disagree.
Aster Analyze (ASTERUSDT), 4-hour time frame.
Be sure to follow the updated ideas.
Do not forget to put a Stop loss for your positions (For every position you want to open).
Please follow your strategy; this is just my idea, and I will gladly see your ideas in this post.
Please do not forget the ✅ ' like ' ✅ button 🙏😊 & Share it with your friends; thanks, and Trade safe.