ASTRUSDT Forming Falling WedgeASTRUSDT is forming a clear falling wedge pattern, a classic bullish reversal signal that often indicates an upcoming breakout. The price has been consolidating within a narrowing range after the recent decline, suggesting that selling pressure is steadily weakening while buyers are quietly stepping in to regain control. With consistent volume confirming accumulation at these lower levels, the setup is pointing toward a potential bullish breakout in the near term. If the price breaks decisively above the wedge resistance, the projected move could deliver an impressive gain of around 90% to 100% from the breakout point.
This falling wedge pattern is typically seen at the end of downtrends or during corrective phases, and it serves as a strong sign that market sentiment may be shifting from bearish to bullish. Traders closely watching ASTRUSDT are observing a similar strengthening momentum as it approaches its own breakout zone. The healthy trading volume supporting the pattern adds real confidence, showing that market participants are getting positioned early in anticipation of a reversal.
The growing interest in ASTRUSDT is fueled by increasing belief in the project’s long-term fundamentals combined with this attractive technical structure. A confirmed breakout backed by sustained volume could trigger the start of a fresh bullish leg. Traders might view this as a compelling setup for medium-term gains, especially once the wedge pattern fully resolves and buying pressure starts to accelerate.
✅ Show your support by hitting the like button and
✅ Leaving a comment below! (What is your opinion about this Coin)
Your feedback and engagement keep me inspired to share more insightful market analysis with you!
ASTRBTC

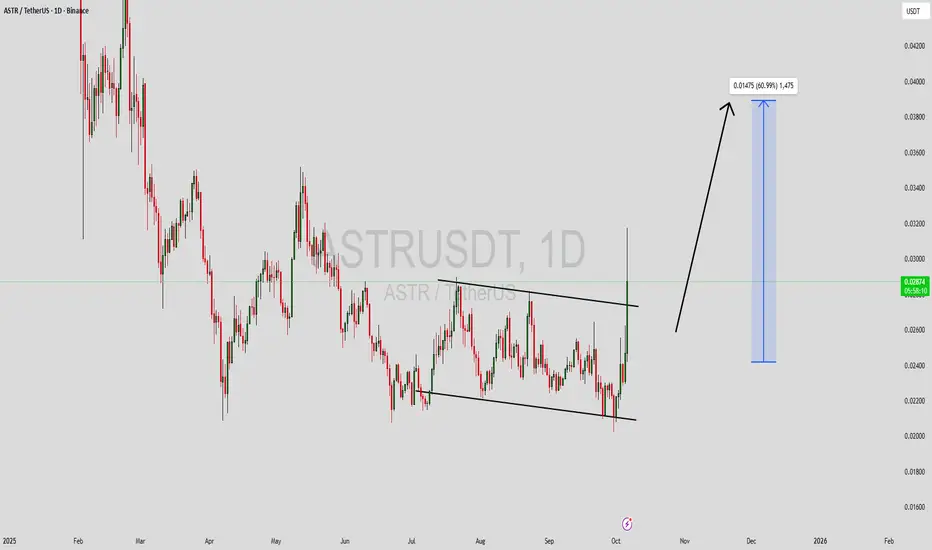
ASTRUSDT Forming Falling WedgeASTRUSDT is forming a well-defined falling wedge pattern on the chart, a bullish setup that often signals an upcoming reversal after a period of downward consolidation. The narrowing price action suggests that sellers are losing momentum while buyers are gradually stepping in. This setup becomes even more convincing with the presence of good trading volume, which indicates that investors are accumulating positions in anticipation of a potential breakout. If the resistance trendline is breached, ASTRUSDT could experience a sharp move upward, with gains estimated in the 50% to 60% range.
The falling wedge is one of the most reliable bullish reversal patterns, and ASTRUSDT’s price structure fits it perfectly. Each dip has been met with increasing buying pressure, showing that the market sentiment is shifting from bearish to bullish. A confirmed breakout above the wedge could trigger a significant rally, supported by strong investor interest and improving market liquidity. Traders are closely watching this zone for a breakout confirmation to ride the next bullish wave.
Investor activity around ASTRUSDT has been rising, reflecting growing optimism in the project’s fundamentals and the broader crypto recovery trend. With technical indicators aligning for a bullish reversal and volume supporting the move, ASTRUSDT may soon enter a new phase of momentum-driven growth. This setup presents an attractive opportunity for traders looking to capitalize on a mid-term rally as the market regains strength.
✅ Show your support by hitting the like button and
✅ Leaving a comment below! (What is You opinion about this Coin)
Your feedback and engagement keep me inspired to share more insightful market analysis with you!

ASTRUSDT UPDATE#ASTR
UPDATE
ASTR Technical Setup
Pattern: Bullish falling wedge pattern
Current Price: $0.075
Target Price: $0.135
Target % Gain: 80.27%
RUS:ASTR is breaking out of a falling wedge pattern on the 1D timeframe. Current price is $0.075 with a target near $0.135, showing about 80% potential upside. The breakout highlights renewed bullish momentum with structure favoring further continuation. Always use proper risk management.
Time Frame: 1D
Risk Management Tip: Always use proper risk management.

ASTR Buy/Long Setup (12H)Two major trigger lines have been broken, and the price is currently sitting at a key level.
A bullish CH (Change of Character) is visible on the chart.
If the demand zone holds, the price may move toward the targets marked on the chart.
A daily candle closing below the invalidation level will invalidate this analysis.
Do not enter the position without capital management and stop setting
Comment if you have any questions
thank you

#ASTR (SPOT) entry range( 0.05 - 0.06) T.(0.1314) SL (0.0460)BINANCE:ASTRUSDT
entry range ( 0.05 - 0.06)
Target1 (0.0739)- Target2 (0.0949) - Target3 (0.1314)
SL .1D close below (0.0460)
**** #Manta ,#OMNI, #DYM, #AI, #IO, #XAI , #ACE #NFP #RAD #WLD #ORDI #BLUR #SUI #Voxel #AEVO #VITE #APE #RDNT #FLUX #NMR #VANRY #TRB #HBAR #DGB #XEC #ERN #ALT #IO #ACA #HIVE #ASTR ****

ASTR (1D)Given the bullish BOS and higher H and L, it looks like ASTR is still bullish on the larger time frame.
demand is a good place for buy/long positions
By maintaining the demand range, it can move towards the targets
Closing a daily candle below the invalidation level will violate this analysis
Note that the financial market is risky, so:
Do not enter any position without confirmation and trigger.
Do not enter a position without setting a stop.
Do not enter a position without capital management.
When we reach the first TP, save some profit and try to move the stop continuously in the direction of your profit.
If you have any comments please post them, comments will help us improve our performance
Thanks

ASTR buy setupConsidering that it has hit an important range and we have a bullish iCH in the substructure, it is expected that if the price on the demand side sparkles, it will be rejected upwards.
The target is the same as supply.
Closing a daily candle below the invalidation level will violate the analysis.
Note that the financial market is risky, so:
Do not enter any position without confirmation and trigger.
Do not enter a position without setting a stop.
Do not enter a position without capital management.
When we reach the first TP, save some profit and try to move the stop continuously in the direction of your profit.
If you have any comments please post them, comments will help us improve our performance
Thanks

Probability of trend reversal for ASTRThe price has reached the weekly supply with a L SH (Long Shadow).
Then it was rejected and the candles tried to fill 70-100% of this LSH, which they succeeded.
We now have a bearish mCH on the chart, which is the first bold sign of a trend reversal.
I specified the invalidation level. Closing a 4-hour candle above this level will violate the analysis
For risk management, please don't forget stop loss and capital management
Comment if you have any questions
Thank You

Astar (ASTR) formed bearish Gartley move for upto 27% rallyHi dear friends, hope you are well and welcome to the new update on Astar ( ASTR ).
On a 4-hr time frame, ASTR has formed a bullish Gartley move for a bullish reversal move soon.
Note: Above idea is for educational purpose only. It is advised to diversify and strictly follow the stop loss, and don't get stuck with trade
ALong

$ASTR/#BTC [#Astar]: Triangle_&_WedgeWe've detected a Triangle & Wedge pattern on the $ASTR/$BTC chart. The price is moving within a triangle or wedge pattern, indicating a period of consolidation. A breakout from this pattern could indicate a potential trend change, and We may consider buying and targetting higher level above the breakout level.
4H - Technical Analysis:
Resistance: 0.00000276 - 0.00000311 - 0.00000381
Support : 0.00000206 - 0.00000171 - 0.00000101
- Oscillators: NEUTRAL
- Moving Averages: STRONG_BUY
A

Astar (ASTR) formed bearish BAT for upto 19.50% moveHi dear friends, hope you are well and welcome to the new update on Astar ( ASTR ).
On a 4-hr time frame, ASTR formed a bearish BAT pattern
Note: Above idea is for educational purpose only. It is advised to diversify and strictly follow the stop loss, and don't get stuck with trade.
AShort

ASTRUSDT - SETUP - hello crypto lovers
- ahmed signals team wishes you high profits
------------------ ASTR USDT ----------------------
_ buy : 0.24
| TP 1 : 0.2457
| TP 2 : 0.255
| TP 3 : 0.27
