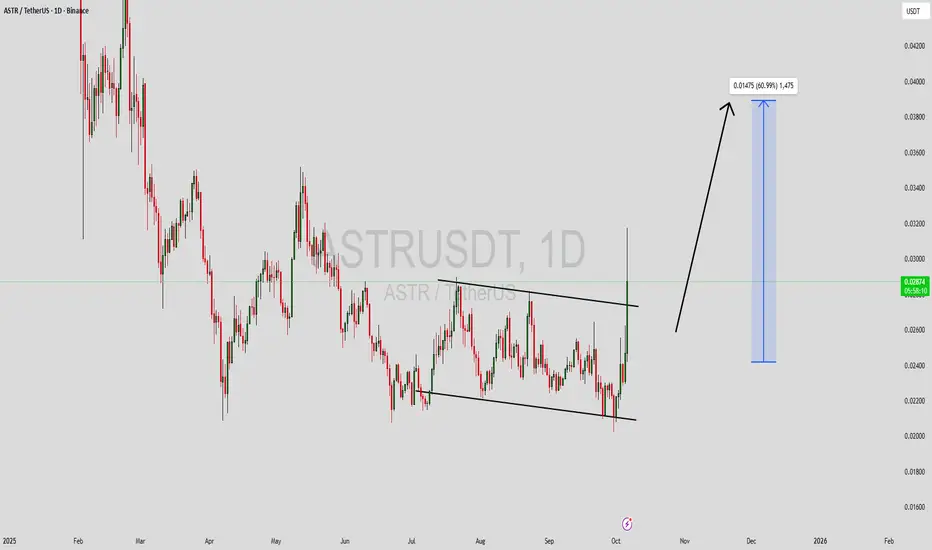
ASTRUSDT Forming Falling WedgeASTRUSDT is forming a well-defined falling wedge pattern on the chart, a bullish setup that often signals an upcoming reversal after a period of downward consolidation. The narrowing price action suggests that sellers are losing momentum while buyers are gradually stepping in. This setup becomes even more convincing with the presence of good trading volume, which indicates that investors are accumulating positions in anticipation of a potential breakout. If the resistance trendline is breached, ASTRUSDT could experience a sharp move upward, with gains estimated in the 50% to 60% range.
The falling wedge is one of the most reliable bullish reversal patterns, and ASTRUSDT’s price structure fits it perfectly. Each dip has been met with increasing buying pressure, showing that the market sentiment is shifting from bearish to bullish. A confirmed breakout above the wedge could trigger a significant rally, supported by strong investor interest and improving market liquidity. Traders are closely watching this zone for a breakout confirmation to ride the next bullish wave.
Investor activity around ASTRUSDT has been rising, reflecting growing optimism in the project’s fundamentals and the broader crypto recovery trend. With technical indicators aligning for a bullish reversal and volume supporting the move, ASTRUSDT may soon enter a new phase of momentum-driven growth. This setup presents an attractive opportunity for traders looking to capitalize on a mid-term rally as the market regains strength.
✅ Show your support by hitting the like button and
✅ Leaving a comment below! (What is You opinion about this Coin)
Your feedback and engagement keep me inspired to share more insightful market analysis with you!
Astrbtclong
ASTRUSDT UPDATE#ASTR
UPDATE
ASTR Technical Setup
Pattern: Bullish falling wedge pattern
Current Price: $0.075
Target Price: $0.135
Target % Gain: 80.27%
RUS:ASTR is breaking out of a falling wedge pattern on the 1D timeframe. Current price is $0.075 with a target near $0.135, showing about 80% potential upside. The breakout highlights renewed bullish momentum with structure favoring further continuation. Always use proper risk management.
Time Frame: 1D
Risk Management Tip: Always use proper risk management.

Astar (ASTR) formed bearish Gartley move for upto 27% rallyHi dear friends, hope you are well and welcome to the new update on Astar ( ASTR ).
On a 4-hr time frame, ASTR has formed a bullish Gartley move for a bullish reversal move soon.
Note: Above idea is for educational purpose only. It is advised to diversify and strictly follow the stop loss, and don't get stuck with trade

$ASTR/#BTC [#Astar]: Triangle_&_WedgeWe've detected a Triangle & Wedge pattern on the $ASTR/$BTC chart. The price is moving within a triangle or wedge pattern, indicating a period of consolidation. A breakout from this pattern could indicate a potential trend change, and We may consider buying and targetting higher level above the breakout level.
4H - Technical Analysis:
Resistance: 0.00000276 - 0.00000311 - 0.00000381
Support : 0.00000206 - 0.00000171 - 0.00000101
- Oscillators: NEUTRAL
- Moving Averages: STRONG_BUY
