ASX200 Heist Blueprint – Entry, Exit, Escape Mapped Out!💼💣 The ASX200 Heist Blueprint: Bullish Loot Incoming! 🔥💰
🌍 Hi! Hola! Ola! Bonjour! Hallo! Marhaba! 👋
Welcome back, Money Makers & Market Robbers! 🤑💸✈️
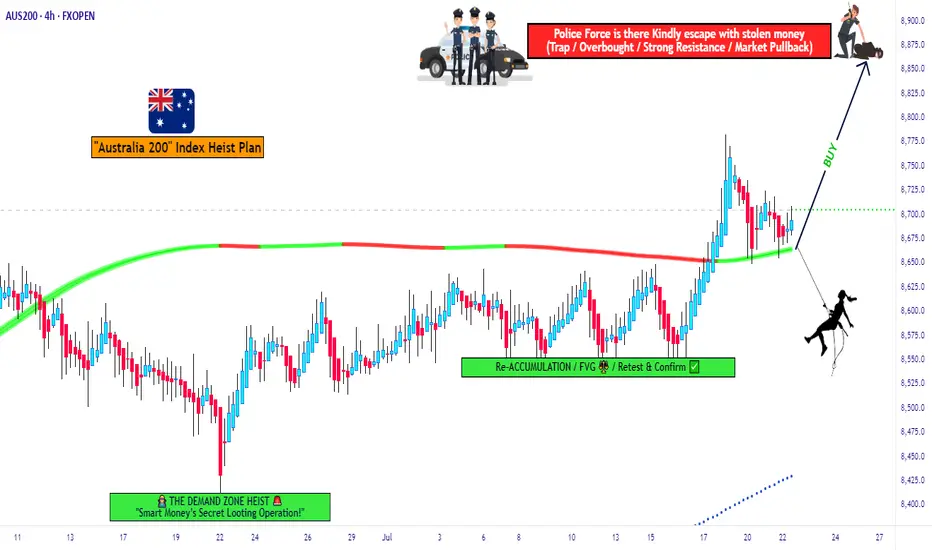
It's time for another high-stakes heist, this time targeting the ASX200 / AUS200 “Australia 200” Index. Get your trading toolkit ready – we're planning a strategic, stealthy bullish operation based on Thief Trader’s signature blend of technical setups + macro fundamental analysis.
💹 ENTRY STRATEGY – "The Vault Is Open!"
The bullish loot is ripe for the taking. Watch for pullbacks on the 15M to 30M charts – layer in limit buy orders near recent swing lows or key levels.
🧠 Use DCA-style (Dollar Cost Averaging) layering to maximize your position like a smart thief scaling walls.
Every entry counts – but precision matters. Time your move, rob the dip, and don’t get caught by the bears. 🐂💥
🛡 STOP LOSS – "Don’t Trip the Alarm!"
Protect your capital like it’s the last stack of bills in the vault.
📉 Suggested SL: Near 4H swing low/high (e.g., 8620.0)
Always adjust based on:
Your risk tolerance
Position size
Number of open entries
Risk smart. The getaway must be clean. 🚁💨
🎯 TARGET – "8880.0 & Beyond!"
That’s the main exit point for our current job.
Expect tough resistance ahead – the police barricade zone where supply, exhaustion, and reversal pressure builds.
Book profits and treat yourself like a boss – your hustle deserves celebration! 💪🎉🍾
📊 Market Condition Overview
The ASX200 is currently in a bullish trend, supported by:
Risk-on sentiment globally 🌐
Aussie economic data strength 📈
Global indices correlation 🧩
Technical confirmations from Thief Trader tools 🔧
📌 Important Note – Stay Informed!
📢 Fundamentals Matter!
Tap into macro analysis, COT reports, geopolitical news, sentiment indicators, and intermarket flows. These are the real gears behind the charts.
📡 Always stay sharp and analyze what’s behind the candles.
⚠️ NEWS TRAP WARNING
🚨 Big news = big volatility. Don’t get caught during releases.
✔️ Avoid opening new positions around high-impact events
✔️ Use trailing SLs to protect open profits
✔️ Manage leverage like a pro thief manages their escape route
💖 Support the Thief Gang!
If this heist plan helped you, hit that Boost 💥 & Follow – it fuels our mission to help more traders rob the market cleanly and smartly.
Together we earn. Together we learn.
🧠💼 Stay tuned for more heist blueprints and tactical break-ins into global markets with the Thief Trading Style™.
🔥 Until next time, rob responsibly. 🕶💸🎯
Asx100
At what Price am I looking at CSL again ?CSL charts suggest that the price action is looking for a support zone and if it eventuates the $200 - $230 range would be a great spot to pick it up for a long term hold.

The ASX looks goodMonthly chart for the ASX (Australian market)
Green ovals show the clear bull rejections along the major trendline which has been recently tested and is breaking out to the upside
I have labelled the chart patterns - I am unsure however if the 'Symmetrical triangles' are really that or Rising Wedges, so take that with a grain of salt

$CSL All aboard!! 297.5 or so ALL ABOARD!!!!BReakout from massive wedge/bullflag/thing being backtested.
Even more bullish than I'd expected! Wow. Let's see if she pushes off again.

ASXUSDT Revenue Jumped Another 85% In AugustHi Guys, We will be talking about a very bullish asset,
ASX / USDT
Axie Infinity continues its parabolic run.
The Ethereum-based NFT game’s revenue increased by over 85% from July to August. The game generated more fees than all other crypto protocols aside from Ethereum.
In August, the game took $364 million in protocol revenue, up from $196 million in July, according to data from AxieWorld. This amounts to a growth of about 85.7% month-on-month.
In early August, the team reported it had hit over 1 million active users of the game across the world. As the game has attracted more users, in-demand Axies and plots of virtual land have also changed hands for up to seven figures.
Key Takeaways:
Axie Infinity's revenue jumped by 85% from July to August. The game takes revenue from selling NFTs.
The game registered $364 million in protocol revenue, up from $196 million in July.
The latest growth stats show Axie has maintained its lead in blockchain gaming space.
IF YOU AGREE WITH THIS, PLEASE LIKE, SHARE AND LEAVE A COMMENT.
TRADE SAFE.

$BTC Big fart brewing and it won't be silentAs explained on the chart. Poot Poot 💨
Still early days, but the next 2 weeks is crucial to see if we have a confirmed downtrend or a short term side ways trend.
For those who are optimistic, the sideways trend is a good time to buy/sell for 50% gains and also to accumulate.
However, there is a good reason to be scared. If this cracks the 25k mark, the next major level of support is 12K.

Normal correction ahead for ANZANZ is moving in a 5 wave pattern and have already completed Wave 3.
Now it is heading for correction wave 4.
Once it reaches point A on the chart, we will see an bit of uptrend where it will meet point B. Post point B, it will continue its journey south
If you like my analysis then do drop a LIKE and a COMMENT. Also do SHARE it with your friends.
Also don't forget to smash that FOLLOW button to get daily analysis of multiple crypto currencies and sometime ASX stocks.
Note - These are my personal notes and in no way a financial advice. Do your own research and Trade wisely

AMPOL to DIP to 26.06 in coming daysOn a 2 hour chart, AMPOL is moving in 5 wave pattern, with Wave 3 completed as displayed on the chart.
From here it should drop to 26.06 where it will meet daily support, before bouncing up to 31-32 zone.
Expect a major drop once it reaches point 5. I will create new analysis once it is close to wave 5.
If you like my analysis then do drop a LIKE and a COMMENT. Also do SHARE it with your friends.
Also don't forget to smash that FOLLOW button to get daily analysis of multiple crypto currencies and sometime ASX stocks.
Note - These are my personal notes and in no way a financial advice. Do your own research and Trade wisely

ASX:PLS Pilbara Minerals Ltd - all eye on growth ?ASX:PLS
Pilbara Minerals is positioned to become a low-cost, long-term, sustainable lithium producer.
During the period the Company increased its cash balance by $41.97M to $105.5M at 31 December 2019 (30 June 2019: $63.6M).
a net cash inflow of $107.6M, (net of fees) related to the successful equity raising completed during the period
need to follow the demand for the minerals that PLS operate in otherwise stock can correct from here.

REA - Bullish Ascending Triangle - High ProbabilityREA Technicals = high probability - I'm looking to enter on the ascending triangle breakout. REA Fundamentals = lower probability - major cv19 head winds are incoming, but, I'm thinking the market takes an educated punt that any further real estate weakness will be meet with larger incentives/stimulus. This will likely lead to a bullish REA share price.

BHP - Looks like its headed back to pre covid Highs!Technical looking very strong leading into earnings. Additionally, fundamentally BHP will be paying healthy dividends and benefit from be in the right part of the resource cycle. For example, Iron ore is now virtually back to GFC price highs.

XRO technical analysis PT $100ASX:XRO I have been watching XRO quite long time. Solid bullish pattern, and price target is $100.
Good luck mates, don't miss the train.

FMG simple technical analysisASX:FMG Great company quite bullish pattern. PT marked on the chart
Good luck mates, don't miss the train!

Car Sales - Ascending Triangle - BullishHigh probabilty trade here with 15% + upside. On the technical side the chart is showing a bullish ascending triangle, whilst on the fundamental side management have put in place strategic cost cutting measures. Should be some tailwinds as well once the lockdown eases.

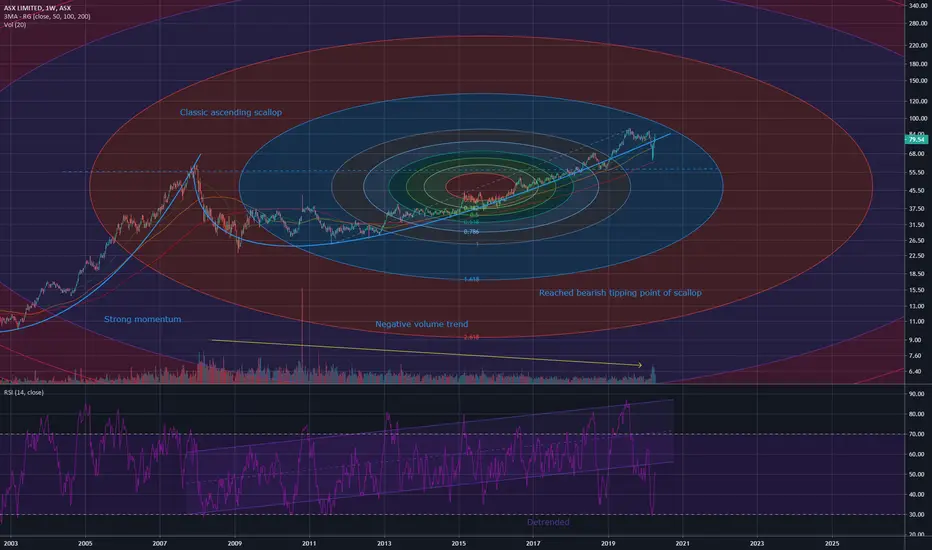
ASX Idea :)Idea for ASX
Multiple ascending scallops
using fibonacci spiral for a support which is also a .236 retracement from the top formed
I've made a few ASX ideas lately but i'm Australian so i feel it suits.
This is a very long term chart!

ASX Fib Circle and Ascending ScallopShowing the potential bearishness is an ascending scallop
The leg of the scallop has been extended so far that momentum has decreased and bearish momentum has been engaged
I am very bearish on Australian stocks.
First time using fib circles :)
WESTPAC my god.... short the banks and all that WBCAUDwestpac bank has been completely gutted buy the covid19 mania.... literally feels like 2002 out here ........... gonna catch a long on this soon but no indication of reversal yet

ASX bull trapLikely close below the 200MA on the weekly chart will lead to further downsides as the alligator indicator opens up bearishly. Also currently sitting under the ichimoku cloud, providing a resistance. We could be on the brink (early stages) of a recession.

Z1P BREAKOUT SUPER SKUXX, why am i shouting?On the 20th of May we saw Z1P getting absolutely munted. Could this happen again? Averages present the fact that we could see a shorting opportunity but within the next month we could see another significant increase.
Just be aware guys that my usrname is losing money for a reason. Don't go by my word at all im literally a noob at trading with zero rep. feedback appreciated.
