Potential bearish drop?EUR/AUD has rejected off the resistance level which is an overlap resistance and could drop from this level to our take profit.
Entry: 1.77581
Why we like it:
There is an overlap resistance level.
Stop loss: 1.78593
Why we like it:
There is a pullback resistance level.
Take profit: 1.75795
Why we like it:
There is a multi-swing low support level.
Enjoying your TradingView experience? Review us!
Please be advised that the information presented on TradingView is provided to Vantage (‘Vantage Global Limited’, ‘we’) by a third-party provider (‘Everest Fortune Group’). Please be reminded that you are solely responsible for the trading decisions on your account. There is a very high degree of risk involved in trading. Any information and/or content is intended entirely for research, educational and informational purposes only and does not constitute investment or consultation advice or investment strategy. The information is not tailored to the investment needs of any specific person and therefore does not involve a consideration of any of the investment objectives, financial situation or needs of any viewer that may receive it. Kindly also note that past performance is not a reliable indicator of future results. Actual results may differ materially from those anticipated in forward-looking or past performance statements. We assume no liability as to the accuracy or completeness of any of the information and/or content provided herein and the Company cannot be held responsible for any omission, mistake nor for any loss or damage including without limitation to any loss of profit which may arise from reliance on any information supplied by Everest Fortune Group.
AUD (Australian Dollar)

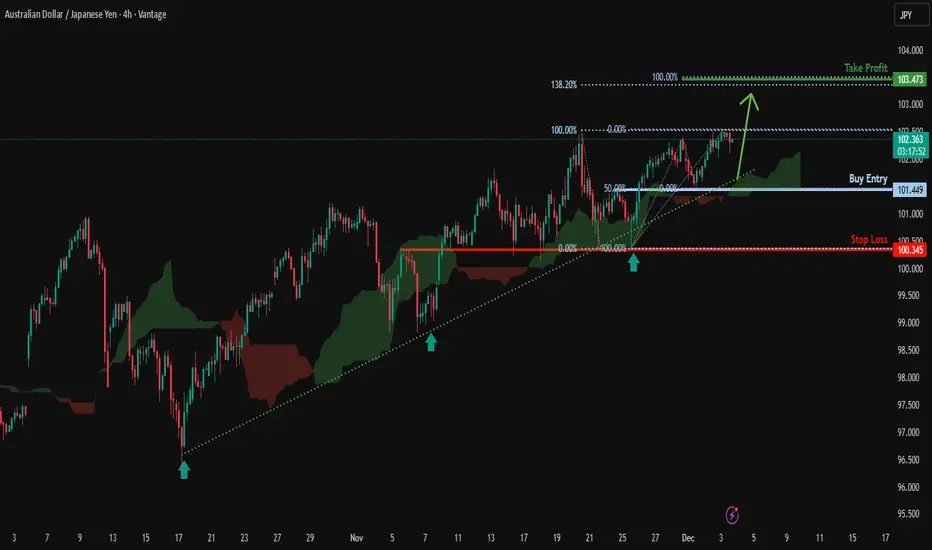
Bullish momentum to extend?AUD/JPY has bounced off the support level, which is a pullback support that aligns with the 50% Fibonacci retracement and could rise from this level to our take profit.
Entry: 101.44
Why we like it:
There is a pullback support level that aligns with the 50% Fibonacci retracement.
Stop loss: 100.34
Why we lik eit:
There is an overlap support level.
Take profit: 103.47
Why we like it:
There is a resistance level that aligns with the 138.2% Fibonacci extension and the 100% Fibonacci projection.
Enjoying your TradingView experience? Review us!
Please be advised that the information presented on TradingView is provided to Vantage (‘Vantage Global Limited’, ‘we’) by a third-party provider (‘Everest Fortune Group’). Please be reminded that you are solely responsible for the trading decisions on your account. There is a very high degree of risk involved in trading. Any information and/or content is intended entirely for research, educational and informational purposes only and does not constitute investment or consultation advice or investment strategy. The information is not tailored to the investment needs of any specific person and therefore does not involve a consideration of any of the investment objectives, financial situation or needs of any viewer that may receive it. Kindly also note that past performance is not a reliable indicator of future results. Actual results may differ materially from those anticipated in forward-looking or past performance statements. We assume no liability as to the accuracy or completeness of any of the information and/or content provided herein and the Company cannot be held responsible for any omission, mistake nor for any loss or damage including without limitation to any loss of profit which may arise from reliance on any information supplied by Everest Fortune Group.
AUD/JPY SENDS CLEAR BULLISH SIGNALS|LONG
AUD/JPY SIGNAL
Trade Direction: long
Entry Level: 101.576
Target Level: 101.889
Stop Loss: 101.369
RISK PROFILE
Risk level: medium
Suggested risk: 1%
Timeframe: 1h
Disclosure: I am part of Trade Nation's Influencer program and receive a monthly fee for using their TradingView charts in my analysis.
✅LIKE AND COMMENT MY IDEAS✅

Stop!Loss|Market View: GBPUSD🙌 Stop!Loss team welcomes you❗️
In this post, we're going to talk about the near-term outlook for the GBPUSD currency pair☝️
Potential trade setup:
🔔Entry level: 1.32468
💰TP: 1.33901
⛔️SL: 1.31035
"Market View" - a brief analysis of trading instruments, covering the most important aspects of the FOREX market.
👇 In the comments 👇 you can type the trading instrument you'd like to analyze, and we'll talk about it in our next posts.
💬 Description: The medium-term outlook for a decline in the pound remains, but in the short term, the price is likely to test the area around 1.34000. Given the current accumulation near the resistance level of 1.32130, as well as the POC level (the maximum traded volume of the current short-term upward movement), buyers will break through the upper boundary of this accumulation and head towards the 1.34000 level.
Thanks for your support 🚀
Profits for all ✅

AUD-CHF Free Signal! Sell!
Hello,Traders!
AUDCHF swept downside liquidity and already retested the mitigation block inside the horizontal supply, showing strong SMC rejection structure that opens room for a continuation lower toward the next draw-on-liquidity.
--------------------
Stop Loss: 0.5293
Take Profit: 0.5251
Entry: 0.5272
Time Frame: 3H
--------------------
Sell!
Comment and subscribe to help us grow!
Check out other forecasts below too!

AUD-NZD Local Short! Sell!
Hello,Traders!
AUDNZD swept liquidity into the mitigation block, filled the retest, and is now showing displacement away from the reclaimed supply zone, signalling continuation towards downside imbalance. Time Frame 3H.
Sell!
Comment and subscribe to help us grow!
Check out other forecasts below too!
Disclosure: I am part of Trade Nation's Influencer program and receive a monthly fee for using their TradingView charts in my analysis.

AUDJPY LOCAL SHORT|
✅AUDJPY swept liquidity above the supply zone and is now showing distribution signs. If bearish order flow confirms, expecting a move back into the target zone as the market reprices lower. Time Frame: 3H
SHORT🔥
✅Like and subscribe to never miss a new idea!✅

EURAUD: Long Signal with Entry/SL/TP
EURAUD
- Classic bullish formation
- Our team expects growth
SUGGESTED TRADE:
Swing Trade
Buy EURAUD
Entry Level - 1.7713
Sl - 1.7703
Tp - 1.7731
Our Risk - 1%
Start protection of your profits from lower levels
Disclosure: I am part of Trade Nation's Influencer program and receive a monthly fee for using their TradingView charts in my analysis.
❤️ Please, support our work with like & comment! ❤️

AUD/NZD: Post-RBNZ recovery may stall as rates test resistance The AUD/NZD is an interesting pair to watch. At the time of writing, it was testing key resistance here between 1.1450 to 1.1500 - major highs in previous years had been formed there. The exchange rate went above this zone a few weeks ago but failed to hold there. And last week it sold off after the RBNZ was hawkish as it signalled no more rate cuts were forthcoming. This means that on balance the risks are tilted to the downside so long as this area of resistance holds now. This is where the sellers might step in again after a brief bounce at the start of this week. I am not expecting a major sell-off, because the RBA is equally neutral, but a drop to low 1.13s should come as major surprise. That said, if no selling pressure is exerted here and soon, this would be a sign of trouble for the bears, especially if rates go on to break above the high of Wednesday's range at 1.1527 - if this level is crossed then this bearish scenario would become invalidated.
By Fawad Razaqzada, market analyst with FOREX.com

EURAUD corrective pullback supported at 1.7650The EURAUD remains in a bullish trend, with recent price action showing signs of a corrective pullback within the broader uptrend.
Support Zone: 1.7650 – a key level from previous consolidation. Price is currently testing or approaching this level.
A bullish rebound from 1.7650 would confirm ongoing upside momentum, with potential targets at:
1.7850 – initial resistance
1.7900 – psychological and structural level
1.7980 – extended resistance on the longer-term chart
Bearish Scenario:
A confirmed break and daily close below 1.7650 would weaken the bullish outlook and suggest deeper downside risk toward:
1.7610 – minor support
1.7560 – stronger support and potential demand zone
Outlook:
Bullish bias remains intact while the FTSE holds above 1.7650. A sustained break below this level could shift momentum to the downside in the short term.
This communication is for informational purposes only and should not be viewed as any form of recommendation as to a particular course of action or as investment advice. It is not intended as an offer or solicitation for the purchase or sale of any financial instrument or as an official confirmation of any transaction. Opinions, estimates and assumptions expressed herein are made as of the date of this communication and are subject to change without notice. This communication has been prepared based upon information, including market prices, data and other information, believed to be reliable; however, Trade Nation does not warrant its completeness or accuracy. All market prices and market data contained in or attached to this communication are indicative and subject to change without notice.

EURUSD: descending channel🛠 Technical Analysis: On the 4-hour timeframe, EURUSD is clearly moving within a descending channel, with price currently testing a major confluence of resistance. This resistance cluster is formed by the channel's upper trendline, the 100 and 200 SMAs, and a horizontal static zone around 1.1607. The "Global bearish signal" (Death Cross) identified earlier remains valid, reinforcing the downtrend. The projected trade anticipates a rejection from this heavy resistance, pushing the price back down toward the lower support zones, with an ultimate target near the channel's bottom at 1.1380.
🌍 Fundamental Analysis: Market liquidity is thin today in the wake of the US Thanksgiving holiday, which can lead to unpredictable or muted price action. Focus is shifting to next week's high-impact data, including Eurozone 'Flash' Inflation (Dec 2) and the crucial US Non-Farm Payrolls report (Dec 7). These releases will be vital in shaping the market's expectations for future ECB and Federal Reserve interest rate decisions, directly impacting the EURUSD exchange rate.
❗️ Trade Parameters (SELL) ❗️
➡️ Entry Point: Sell on rejection from the resistance zone (approx. 1.1600 – 1.1630)
🎯 Take Profit: 1.1468, medium-term target at 1.1380
🔴 Stop Loss: Above the resistance structure (approx. 1.1671)
⚠️ Disclaimer: This is a potential trade idea based on current analysis; market conditions and price direction are subject to change based on news factors and volatility.

GBPUSD: short-term buy🛠 Technical Analysis: On the 4-hour timeframe, GBPUSD has successfully broken out of its long-term descending channel and reclaimed the critical 200 SMA, signaling a potential trend reversal. Currently, the pair is forming a bullish triangle pattern just above the 1.3200 support zone, consolidating recent gains. The projected setup anticipates a continuation of this momentum, with a breakout above the triangle targeting the next major resistance level at 1.3356.
🌍 Fundamental Analysis: The Pound is gaining traction as the market prepares for a heavy week of US economic data, specifically the ISM Manufacturing PMI and the upcoming Non-Farm Payrolls (NFP). If US labor data shows signs of cooling, it could further weigh on the US Dollar, providing fuel for the British Pound to extend its rally. Additionally, month-end flows and positioning ahead of December central bank decisions are keeping volatility elevated.
❗️ Trade Parameters (BUY) ❗️
➡️ Entry Point: Buy on the confirmed breakout of the triangle pattern (approx. 1.3245 – 1.3260)
🎯 Take Profit: 1.3356
🔴 Stop Loss: Below the local consolidation structure (approx. 1.3170)
⚠️ Disclaimer: This is a potential trade idea based on current analysis; market conditions and price direction are subject to change based on news factors and volatility.

AUDCAD – H4 | 02-12-2025 Wave 3 is back in playAUDCAD – H4 | 02-12-2025
Wave 3 is back in play
A clean Elliott Wave reaction once again.
Following the previous update, price extended lower to 0.90565, completing the blue wave 5, thereby finishing white wave C of yellow wave Y, and simultaneously confirming the completion of the red wave 2 corrective structure.
From the 0.90565 low, the market has rallied strongly into yellow wave 1 of red wave 3. Within this advance, the internal structure of yellow wave 1 is unfolding as a clear five-wave impulsive sequence in white, and price is currently progressing through white wave 5.
Price may push slightly higher to finalize this five-wave structure of yellow wave 1 before entering a corrective pullback as yellow wave 2.
Primary Plan
Wait for yellow wave 2 to complete, then look for long opportunities aligned with the powerful yellow wave 3 of red wave 3.
Invalidation
A break below 0.90565 would invalidate the count and require reassessment.

euraud looking bearish consolidation broken towards downside, as long as its below horizontal and trend line it can give 150 pips bearish rally

Bullish bounce off?AUD/JPY has bounced off the support level, which is a pullback support that aligns with the 38.2% Fibonacci retracement and could potentially rise from this level to our take profit.
Entry: 101.44
Why we like it:
There is a pullback support that aligns with the 38/2% Fibonacci retracement.
Stop loss: 100.34
Why we like it:
There is an overlap support level.
Take profit: 103.47
Why we like it:
There is a resistance level at the 138.2% Fibonacci extension and the 100% Fibonacci projection.
Enjoying your TradingView experience? Review us!
Please be advised that the information presented on TradingView is provided to Vantage (‘Vantage Global Limited’, ‘we’) by a third-party provider (‘Everest Fortune Group’). Please be reminded that you are solely responsible for the trading decisions on your account. There is a very high degree of risk involved in trading. Any information and/or content is intended entirely for research, educational and informational purposes only and does not constitute investment or consultation advice or investment strategy. The information is not tailored to the investment needs of any specific person and therefore does not involve a consideration of any of the investment objectives, financial situation or needs of any viewer that may receive it. Kindly also note that past performance is not a reliable indicator of future results. Actual results may differ materially from those anticipated in forward-looking or past performance statements. We assume no liability as to the accuracy or completeness of any of the information and/or content provided herein and the Company cannot be held responsible for any omission, mistake nor for any loss or damage including without limitation to any loss of profit which may arise from reliance on any information supplied by Everest Fortune Group.

Stop!Loss|Market View: EURUSD🙌 Stop!Loss team welcomes you❗️
In this post, we're going to talk about the near-term outlook for the EURUSD currency pair☝️
Potential trade setup:
🔔Entry level: 1.16650
💰TP: 1.17291
⛔️SL: 1.16306
"Market View" - a brief analysis of trading instruments, covering the most important aspects of the FOREX market.
👇 In the comments 👇 you can type the trading instrument you'd like to analyze, and we'll talk about it in our next posts.
💬 Description: The mid-term outlook remains on the sellers' side, so given current prices, selling is appropriate, targeting at least 1.14000. In the short term, a further upward move is highly likely, aimed at breaking the resistance at 1.16600. In this case, a short-term buy could be looked for, but with targets no higher than 1.17500, as the mid-term move is likely to be downward.
Thanks for your support 🚀
Profits for all ✅

Bulls Still in Control?Hello traders! Here’s an idea for AUDCAD based on current structure, trend, and momentum.
(This is market analysis, not financial advice. Always use proper risk management and seek additional confirmations before entering a trade.)
Intraday Buy Idea (short term move)
• Entry: 0.91500 – 0.91600
• Stop-Loss: 0.91350 – 0.91300
• Target Area: 0.91800 – 0.92000
⸻
Market Analysis
AUD/CAD continues to trade within a relatively modest daily range—typical for this pair—especially as we approach the end of Q4 and move deeper into the holiday season, when liquidity thins and price action often becomes more choppy and range-bound.
On the 4-hour chart, an inverted head-and-shoulders pattern has formed. The market recently closed above the neckline/right-shoulder zone, confirming potential bullish structure. A clean retest of this zone (around 0.91500-0.91600) could provide an opportunity to catch the continuation of the bullish momentum that began late last week (around Nov 21).
Our target—0.92000—lines up closely with November’s high and a key structural resistance level. If momentum remains intact, price could attempt another test of this area.
⸻
Fundamentals (per economic sources)
Australia (AUD)
• The RBA has kept rates steady, maintaining stability in the AUD.
• Commodity prices trending higher (especially metals) provide underlying support for the Australian dollar.
• A potential shift toward U.S. Federal Reserve rate cuts later on can indirectly support AUD through broader USD softness and risk-on flows. (per economic sources)
Canada (CAD)
• Canada’s manufacturing sector continues to contract, signaling broader weakness.
• While recent GDP growth was positive, the expansion was driven mainly by oil exports and government spending, not broad economic strength.
• Mixed and uneven economic performance may limit near-term CAD strength.
Combined, these factors support a slightly bullish bias for AUD/CAD in the near term, aligning with this technical setup.

GBPAUD bearish rejection at 2.033 resistanceThe GBPAUD pair is currently trading with a bearish bias, aligned with the broader downward trend. Recent price action shows a retest of the resistance, suggesting a temporary relief rally within the downtrend.
Key resistance is located at 2.0340, a prior consolidation zone. This level will be critical in determining the next directional move.
A bearish rejection from 2.0340 could confirm the resumption of the downtrend, targeting the next support levels at 2.0130, followed by 2.0000 and 1.9980 over a longer timeframe.
Conversely, a decisive breakout and daily close above 2.0340 would invalidate the current bearish setup, shifting sentiment to bullish and potentially triggering a move towards 2.0390, then 2.0440.
Conclusion:
The short-term outlook remains bearish unless the pair breaks and holds above 2.0340. Traders should watch for price action signals around this key level to confirm direction. A rejection favours fresh downside continuation, while a breakout signals a potential trend reversal or deeper correction.
This communication is for informational purposes only and should not be viewed as any form of recommendation as to a particular course of action or as investment advice. It is not intended as an offer or solicitation for the purchase or sale of any financial instrument or as an official confirmation of any transaction. Opinions, estimates and assumptions expressed herein are made as of the date of this communication and are subject to change without notice. This communication has been prepared based upon information, including market prices, data and other information, believed to be reliable; however, Trade Nation does not warrant its completeness or accuracy. All market prices and market data contained in or attached to this communication are indicative and subject to change without notice.

GBPAUD: Bullish Continuation is Highly Probable! Here is Why:
It is essential that we apply multitimeframe technical analysis and there is no better example of why that is the case than the current GBPAUD chart which, if analyzed properly, clearly points in the upward direction.
Disclosure: I am part of Trade Nation's Influencer program and receive a monthly fee for using their TradingView charts in my analysis.
❤️ Please, support our work with like & comment! ❤️

AUDCAD The Target Is UP! BUY!
My dear subscribers,
This is my opinion on the AUDCAD next move:
The instrument tests an important psychological level 0.9141
Bias - Bullish
Technical Indicators: Supper Trend gives a precise Bullish signal, while Pivot Point HL predicts price changes and potential reversals in the market.
Target - 0.9150
My Stop Loss - 0.9135
About Used Indicators:
On the subsequent day, trading above the pivot point is thought to indicate ongoing bullish sentiment, while trading below the pivot point indicates bearish sentiment.
Disclosure: I am part of Trade Nation's Influencer program and receive a monthly fee for using their TradingView charts in my analysis.
———————————
WISH YOU ALL LUCK

GBPAUD Will Go Higher! Buy!
Here is our detailed technical review for GBPAUD.
Time Frame: 4h
Current Trend: Bullish
Sentiment: Oversold (based on 7-period RSI)
Forecast: Bullish
The market is on a crucial zone of demand 2.018.
The oversold market condition in a combination with key structure gives us a relatively strong bullish signal with goal 2.034 level.
P.S
The term oversold refers to a condition where an asset has traded lower in price and has the potential for a price bounce.
Overbought refers to market scenarios where the instrument is traded considerably higher than its fair value. Overvaluation is caused by market sentiments when there is positive news.
Like and subscribe and comment my ideas if you enjoy them!

EUR/AUD SELLERS WILL DOMINATE THE MARKET|SHORT
Hello, Friends!
We are going short on the EUR/AUD with the target of 1.771 level, because the pair is overbought and will soon hit the resistance line above. We deduced the overbought condition from the price being near to the upper BB band. However, we should use low risk here because the 1W TF is green and gives us a counter-signal.
Disclosure: I am part of Trade Nation's Influencer program and receive a monthly fee for using their TradingView charts in my analysis.
✅LIKE AND COMMENT MY IDEAS✅

AUD/JPY-Supply Zone Rejection Signals Potential Bearish ReversalAUD/JPY is showing signs of weakening bullish momentum as price reacts sharply from the Strong Supply Zone at the top of the chart. This area has historically acted as a major distribution zone, and the latest rejection suggests that sellers are stepping back into control.
After forming multiple double-bottom rallies, price pushed upward but failed to sustain momentum beyond the supply ceiling. The sharp rejection indicates that liquidity has been collected from trapped buyers, and the market may now be preparing for a deeper corrective move.
The structure around the neckline and mid-buyer zone is critical. A break below this area—especially below the 100.000 level—would confirm a bearish shift. The chart already highlights a possible breakout-retest scenario, where price could break the buyer zone, retest it from below, and continue downward.
If sellers maintain pressure, the next target lies near the Support Zone around 98.500, aligned with previous range lows. A deeper move could even reach the broader Demand Zone Area, completing a full bearish correction.
Overall, the chart is signaling a potential reversal from supply, with sellers gaining strength and momentum shifting toward the downside as long as price remains below the supply zone and fails to reclaim the neckline.
