AUDJPY SellThe AUDJPY sell setup is backed by multi-timeframe confluence:
Elliott Wave 5th wave completion
Potential breakdown of an ascending channel
Rising triangle formation on the 1H chart signaling weakness
With momentum slowing and key support levels under pressure, the risk to reward favors the downside.
Aud-jpy

$AUDJPY | 20-Year Trend Meets Range HighThis pair has respected a rising base since the early 2000s.
Every major drawdown into that trendline has been absorbed, not broken.
Now price is pressing into:
• Long-term range resistance
• Prior cycle highs
• With higher-lows intact on the way up
This is where markets decide between:
Acceptance → structural breakout & trend continuation
Rejection → multi-year rotation back toward mean
Time + structure already did the work.
Higher-timeframe trades don’t ask for excitement —
they ask for patience and respect for levels.
Watching how price behaves around range high before committing bias.
📌 Long-term support holding
📌 Compression into resistance
GETTEX:AUD NASDAQ:JPY

Bullish momentum to extend?AUD/JPY is falling towards the pivot point of 108.52, which is a pullback support and could bounce to the 1st resistance.
Pivot: 108.52
1st Support: 108.09
1st Resistance: 109.76
Disclaimer:
The opinions given above constitute general market commentary and do not constitute the opinion or advice of IC Markets or any form of personal or investment advice.
Any opinions, news, research, analyses, prices, other information, or links to third-party sites contained on this website are provided on an "as-is" basis, are intended to be informative only, and are not advice, a recommendation, research, a record of our trading prices, an offer of, or solicitation for, a transaction in any financial instrument and thus should not be treated as such. The information provided does not involve any specific investment objectives, financial situation, or needs of any specific person who may receive it. Please be aware that past performance is not a reliable indicator of future performance and/or results. Past performance or forward-looking scenarios based upon the reasonable beliefs of the third-party provider are not a guarantee of future performance. Actual results may differ materially from those anticipated in forward-looking or past performance statements. IC Markets makes no representation or warranty and assumes no liability as to the accuracy or completeness of the information provided, nor any loss arising from any investment based on a recommendation, forecast, or any information supplied by any third party

Potential bullish reversal?AUD/JPY is falling towards the support level, which is a pullback support, and could bounce from this level to our take profit.
Entry: 106.46
Why we like it:
There is a pullback support level
Stop loss: 106.12
Why we like it:
There is a pullback support level.
Take profit: 107.87
Why we like it:
There is a pullback resistance that aligns with the 61.8% Fibonacci retracement.
Enjoying your TradingView experience? Review us!
Please be advised that the information presented on TradingView is provided to Vantage (‘Vantage Global Limited’, ‘we’) by a third-party provider (‘Everest Fortune Group’). Please be reminded that you are solely responsible for the trading decisions on your account. There is a very high degree of risk involved in trading. Any information and/or content is intended entirely for research, educational and informational purposes only and does not constitute investment or consultation advice or investment strategy. The information is not tailored to the investment needs of any specific person and therefore does not involve a consideration of any of the investment objectives, financial situation or needs of any viewer that may receive it. Kindly also note that past performance is not a reliable indicator of future results. Actual results may differ materially from those anticipated in forward-looking or past performance statements. We assume no liability as to the accuracy or completeness of any of the information and/or content provided herein and the Company cannot be held responsible for any omission, mistake nor for any loss or damage including without limitation to any loss of profit which may arise from reliance on any information supplied by Everest Fortune Group.

Bullish bounce off?AUD/JPY has bounced off the support level, which acts as an overlap support that aligns with the 38.25 Fibonacci retracement and could potentially rise from this level to our take profit.
Entry: 106.20
Why we like it:
There is an overlap support level that aligns with the 38.2% Fibonacci retracement.
Stop loss: 105.74
Why we like it:
There is a pullback support that is slightly below the 61.8% Fibonacci retracement.
Take profit: 107.24
Why we like it:
There is a resistance level at the 78.6% Fibonacci projection.
Enjoying your TradingView experience? Review us!
Please be advised that the information presented on TradingView is provided to Vantage (‘Vantage Global Limited’, ‘we’) by a third-party provider (‘Everest Fortune Group’). Please be reminded that you are solely responsible for the trading decisions on your account. There is a very high degree of risk involved in trading. Any information and/or content is intended entirely for research, educational and informational purposes only and does not constitute investment or consultation advice or investment strategy. The information is not tailored to the investment needs of any specific person and therefore does not involve a consideration of any of the investment objectives, financial situation or needs of any viewer that may receive it. Kindly also note that past performance is not a reliable indicator of future results. Actual results may differ materially from those anticipated in forward-looking or past performance statements. We assume no liability as to the accuracy or completeness of any of the information and/or content provided herein and the Company cannot be held responsible for any omission, mistake nor for any loss or damage including without limitation to any loss of profit which may arise from reliance on any information supplied by Everest Fortune Group.

Bearish reversal off 61.8% Fib resistance?AUD/JPY is reacting off the resistance level, which is a pullback resistance that aligns with the 61.8% Fibonacci retracement and could reverse from this level to our take profit.
Entry: 106.26
Why we like it:
There is a pullback resistance level that aligns with the 61.8% Fibonacci retracement.
Stop loss: 106.69
Why we like it:
There is a multi-swing high resistance level.
Take profit: 105.59
Why we like it:
There is a pullback support level.
Enjoying your TradingView experience? Review us!
Please be advised that the information presented on TradingView is provided to Vantage (‘Vantage Global Limited’, ‘we’) by a third-party provider (‘Everest Fortune Group’). Please be reminded that you are solely responsible for the trading decisions on your account. There is a very high degree of risk involved in trading. Any information and/or content is intended entirely for research, educational and informational purposes only and does not constitute investment or consultation advice or investment strategy. The information is not tailored to the investment needs of any specific person and therefore does not involve a consideration of any of the investment objectives, financial situation or needs of any viewer that may receive it. Kindly also note that past performance is not a reliable indicator of future results. Actual results may differ materially from those anticipated in forward-looking or past performance statements. We assume no liability as to the accuracy or completeness of any of the information and/or content provided herein and the Company cannot be held responsible for any omission, mistake nor for any loss or damage including without limitation to any loss of profit which may arise from reliance on any information supplied by Everest Fortune Group.

Bearish drop?AUD/JPY is rising towards the pivot, which aligns with the 50% Fibonacci retracement, and could reverse to the 1st support that aligns with the 61.8% Fibonacci retracement.
Pivot: 106.19
1st Support: 105.49
1st Resistance: 106.68
Disclaimer:
The opinions given above constitute general market commentary and do not constitute the opinion or advice of IC Markets or any form of personal or investment advice.
Any opinions, news, research, analyses, prices, other information, or links to third-party sites contained on this website are provided on an "as-is" basis, are intended to be informative only, and are not advice, a recommendation, research, a record of our trading prices, an offer of, or solicitation for, a transaction in any financial instrument and thus should not be treated as such. The information provided does not involve any specific investment objectives, financial situation, or needs of any specific person who may receive it. Please be aware that past performance is not a reliable indicator of future performance and/or results. Past performance or forward-looking scenarios based upon the reasonable beliefs of the third-party provider are not a guarantee of future performance. Actual results may differ materially from those anticipated in forward-looking or past performance statements. IC Markets makes no representation or warranty and assumes no liability as to the accuracy or completeness of the information provided, nor any loss arising from any investment based on a recommendation, forecast, or any information supplied by any third party

Bullish continuation setup?AUD/JPY is falling towards the pivot, which acts as a pullback support that aligns with the 23.6% Fibonacci retracement and could bounce to the 1st resistance.
Pivot: 105.71
1st Support: 105.07
1st Resistance: 106.66
Disclaimer:
The opinions given above constitute general market commentary and do not constitute the opinion or advice of IC Markets or any form of personal or investment advice.
Any opinions, news, research, analyses, prices, other information, or links to third-party sites contained on this website are provided on an "as-is" basis, are intended to be informative only, and are not advice, a recommendation, research, a record of our trading prices, an offer of, or solicitation for, a transaction in any financial instrument and thus should not be treated as such. The information provided does not involve any specific investment objectives, financial situation, or needs of any specific person who may receive it. Please be aware that past performance is not a reliable indicator of future performance and/or results. Past performance or forward-looking scenarios based upon the reasonable beliefs of the third-party provider are not a guarantee of future performance. Actual results may differ materially from those anticipated in forward-looking or past performance statements. IC Markets makes no representation or warranty and assumes no liability as to the accuracy or completeness of the information provided, nor any loss arising from any investment based on a recommendation, forecast, or any information supplied by any third party

Could we see a drop from here?AUD/JPY is reacting off the pivot which is a pullback resistance and could drop to the 50% Fibonacci support.
Pivot: 105.12
1st Support: 104
1st Resistance: 105.94
Disclaimer:
The opinions given above constitute general market commentary and do not constitute the opinion or advice of IC Markets or any form of personal or investment advice.
Any opinions, news, research, analyses, prices, other information, or links to third-party sites contained on this website are provided on an "as-is" basis, are intended to be informative only, and are not advice, a recommendation, research, a record of our trading prices, an offer of, or solicitation for, a transaction in any financial instrument and thus should not be treated as such. The information provided does not involve any specific investment objectives, financial situation, or needs of any specific person who may receive it. Please be aware that past performance is not a reliable indicator of future performance and/or results. Past performance or forward-looking scenarios based upon the reasonable beliefs of the third-party provider are not a guarantee of future performance. Actual results may differ materially from those anticipated in forward-looking or past performance statements. IC Markets makes no representation or warranty and assumes no liability as to the accuracy or completeness of the information provided, nor any loss arising from any investment based on a recommendation, forecast, or any information supplied by any third party

Bullish bounce setup?AUD/JPY is falling towards the support level, which is an overlap support that aligns with the 38.2% Fibonacci retracement and could bounce from this level to our take profit.
Entry: 104.60
Why we like it:
There is an overlap support that aligns with the 38.2% Fibonacci retracement.
Stop loss: 104.02
Why we like it:
There is an overlap support level that aligns with the 50% Fibonacci retracement.
Take profit: 105.75
Why we like it:
There is a swing high resistance.
Enjoying your TradingView experience? Review us!
Please be advised that the information presented on TradingView is provided to Vantage (‘Vantage Global Limited’, ‘we’) by a third-party provider (‘Everest Fortune Group’). Please be reminded that you are solely responsible for the trading decisions on your account. There is a very high degree of risk involved in trading. Any information and/or content is intended entirely for research, educational and informational purposes only and does not constitute investment or consultation advice or investment strategy. The information is not tailored to the investment needs of any specific person and therefore does not involve a consideration of any of the investment objectives, financial situation or needs of any viewer that may receive it. Kindly also note that past performance is not a reliable indicator of future results. Actual results may differ materially from those anticipated in forward-looking or past performance statements. We assume no liability as to the accuracy or completeness of any of the information and/or content provided herein and the Company cannot be held responsible for any omission, mistake nor for any loss or damage including without limitation to any loss of profit which may arise from reliance on any information supplied by Everest Fortune Group.

Bullish bounce off?AUD/JPY has bounced off the pivot, which is a pullback support, and could rise to the 1st resistance, which aligns with the 127.2% Fibonacci extension.
Pivot: 104.26
1st Support: 103.43
1st Resistance: 105.48
Disclaimer:
The opinions given above constitute general market commentary and do not constitute the opinion or advice of IC Markets or any form of personal or investment advice.
Any opinions, news, research, analyses, prices, other information, or links to third-party sites contained on this website are provided on an "as-is" basis, are intended to be informative only, and are not advice, a recommendation, research, a record of our trading prices, an offer of, or solicitation for, a transaction in any financial instrument and thus should not be treated as such. The information provided does not involve any specific investment objectives, financial situation, or needs of any specific person who may receive it. Please be aware that past performance is not a reliable indicator of future performance and/or results. Past performance or forward-looking scenarios based upon the reasonable beliefs of the third-party provider are not a guarantee of future performance. Actual results may differ materially from those anticipated in forward-looking or past performance statements. IC Markets makes no representation or warranty and assumes no liability as to the accuracy or completeness of the information provided, nor any loss arising from any investment based on a recommendation, forecast, or any information supplied by any third party

Bearish drop off?AUD/JPY could rise towards the resistance level which is an overlap resistance and could reverse from this level to our take profit.
Entry: 104.69
Why we like it:
There is an overlap resistance level.
Stop loss: 105.18
Why we like it:
There is a swing high resistance level.
Take profit: 104.02
Why we like it:
There is an overlap support levle that is slightly below the 38.2% Fibonacci retracement.
Enjoying your TradingView experience? Review us!
Please be advised that the information presented on TradingView is provided to Vantage (‘Vantage Global Limited’, ‘we’) by a third-party provider (‘Everest Fortune Group’). Please be reminded that you are solely responsible for the trading decisions on your account. There is a very high degree of risk involved in trading. Any information and/or content is intended entirely for research, educational and informational purposes only and does not constitute investment or consultation advice or investment strategy. The information is not tailored to the investment needs of any specific person and therefore does not involve a consideration of any of the investment objectives, financial situation or needs of any viewer that may receive it. Kindly also note that past performance is not a reliable indicator of future results. Actual results may differ materially from those anticipated in forward-looking or past performance statements. We assume no liability as to the accuracy or completeness of any of the information and/or content provided herein and the Company cannot be held responsible for any omission, mistake nor for any loss or damage including without limitation to any loss of profit which may arise from reliance on any information supplied by Everest Fortune Group.

#046: LONG AUD/JPY Investment Opportunity
The current structure of the AUD/JPY pair reflects a classic institutional pullback within a broader bullish environment. After a strong directional move, the price has entered a corrective phase that appears orderly rather than impulsive, suggesting a redistribution rather than a true trend reversal.
What is striking is the price behavior around the demand area. The market has already cleared liquidity, removing weak hands and breaching short-term stops. Since then, price action has slowed, showing hesitation and consolidation rather than a downward continuation. This is often a sign that professional traders are absorbing liquidity rather than closing positions.
From a macro perspective, the broader risk environment remains supported. The yen continues to serve as a funding currency, while the Australian dollar benefits from carry dynamics and relative strength during periods of risk appetite. This imbalance typically leads to shallow pullbacks, where the price doesn't always return to perfectly "clean" retail levels before resuming the primary move.
Volume trends reinforce this view. Selling pressure hasn't expanded during the retracement, and there's no evidence of aggressive distribution. Instead, the market appears to be transitioning from a corrective flow to a directional intent.
This type of structure often favors patience. Rather than chasing momentum, the idea is to allow the price to reach an area where institutional orders are more likely to stop, after the initial phase of manipulation. If execution occurs, the rationale is based on participation and intelligent money management, not emotional anticipation.
If the market continues to rise without filling the expected entry, this wouldn't invalidate the analysis. On the contrary, it would confirm strong directional conviction and aggressive participation by major players. In institutional trading, missed trades are a natural consequence of discipline, not a failure of analysis.
The focus remains on the quality of execution, not frequency. In environments like this, sticking to the plan and letting the market decide is often the most professional approach.

Bullish bounce off?AUD/JPY could make a short-term pullback towards the pivot and could bounce to the 1st resistance.
Pivot: 102.29
1st Support: 101.59
1st Resistance: 103.44
Disclaimer:
The opinions given above constitute general market commentary and do not constitute the opinion or advice of IC Markets or any form of personal or investment advice.
Any opinions, news, research, analyses, prices, other information, or links to third-party sites contained on this website are provided on an "as-is" basis, are intended to be informative only, and are not advice, a recommendation, research, a record of our trading prices, an offer of, or solicitation for, a transaction in any financial instrument and thus should not be treated as such. The information provided does not involve any specific investment objectives, financial situation, or needs of any specific person who may receive it. Please be aware that past performance is not a reliable indicator of future performance and/or results. Past performance or forward-looking scenarios based upon the reasonable beliefs of the third-party provider are not a guarantee of future performance. Actual results may differ materially from those anticipated in forward-looking or past performance statements. IC Markets makes no representation or warranty and assumes no liability as to the accuracy or completeness of the information provided, nor any loss arising from any investment based on a recommendation, forecast, or any information supplied by any third party

Heading towards 50% Fib resistance?AUD/JPY is rising towards the resistance level, which is a pullback resistance that aligns with the 50% Fibonacci retracement and could potentially reverse from this level to our take-profit.
Entry: 103.20
Why we like it:
There is an overlap resistance level that aligns with the 50% Fibonacci retracement.
Stop loss: 103.73
Why we like it:
There is a pullback resistance that aligns with the 78.6% Fibonacci retracement.
Take profit: 102.15
Why we like it:
There is a swing low support.
Enjoying your TradingView experience? Review us!
Please be advised that the information presented on TradingView is provided to Vantage (‘Vantage Global Limited’, ‘we’) by a third-party provider (‘Everest Fortune Group’). Please be reminded that you are solely responsible for the trading decisions on your account. There is a very high degree of risk involved in trading. Any information and/or content is intended entirely for research, educational and informational purposes only and does not constitute investment or consultation advice or investment strategy. The information is not tailored to the investment needs of any specific person and therefore does not involve a consideration of any of the investment objectives, financial situation or needs of any viewer that may receive it. Kindly also note that past performance is not a reliable indicator of future results. Actual results may differ materially from those anticipated in forward-looking or past performance statements. We assume no liability as to the accuracy or completeness of any of the information and/or content provided herein and the Company cannot be held responsible for any omission, mistake nor for any loss or damage including without limitation to any loss of profit which may arise from reliance on any information supplied by Everest Fortune Group.

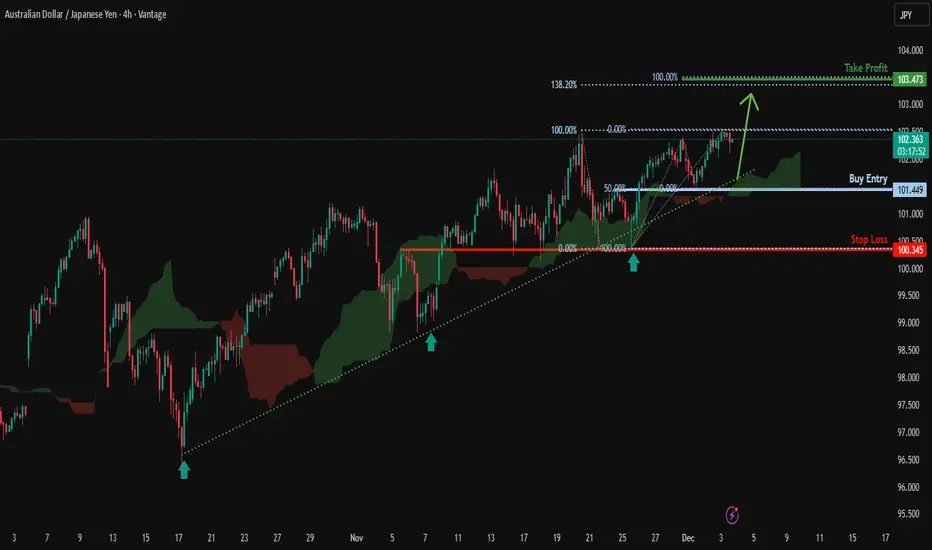
Bullish momentum to extend?AUD/JPY has bounced off the support level, which is a pullback support that aligns with the 50% Fibonacci retracement and could rise from this level to our take profit.
Entry: 101.44
Why we like it:
There is a pullback support level that aligns with the 50% Fibonacci retracement.
Stop loss: 100.34
Why we lik eit:
There is an overlap support level.
Take profit: 103.47
Why we like it:
There is a resistance level that aligns with the 138.2% Fibonacci extension and the 100% Fibonacci projection.
Enjoying your TradingView experience? Review us!
Please be advised that the information presented on TradingView is provided to Vantage (‘Vantage Global Limited’, ‘we’) by a third-party provider (‘Everest Fortune Group’). Please be reminded that you are solely responsible for the trading decisions on your account. There is a very high degree of risk involved in trading. Any information and/or content is intended entirely for research, educational and informational purposes only and does not constitute investment or consultation advice or investment strategy. The information is not tailored to the investment needs of any specific person and therefore does not involve a consideration of any of the investment objectives, financial situation or needs of any viewer that may receive it. Kindly also note that past performance is not a reliable indicator of future results. Actual results may differ materially from those anticipated in forward-looking or past performance statements. We assume no liability as to the accuracy or completeness of any of the information and/or content provided herein and the Company cannot be held responsible for any omission, mistake nor for any loss or damage including without limitation to any loss of profit which may arise from reliance on any information supplied by Everest Fortune Group.
Bullish bounce off?AUD/JPY has bounced off the support level, which is a pullback support that aligns with the 38.2% Fibonacci retracement and could potentially rise from this level to our take profit.
Entry: 101.44
Why we like it:
There is a pullback support that aligns with the 38/2% Fibonacci retracement.
Stop loss: 100.34
Why we like it:
There is an overlap support level.
Take profit: 103.47
Why we like it:
There is a resistance level at the 138.2% Fibonacci extension and the 100% Fibonacci projection.
Enjoying your TradingView experience? Review us!
Please be advised that the information presented on TradingView is provided to Vantage (‘Vantage Global Limited’, ‘we’) by a third-party provider (‘Everest Fortune Group’). Please be reminded that you are solely responsible for the trading decisions on your account. There is a very high degree of risk involved in trading. Any information and/or content is intended entirely for research, educational and informational purposes only and does not constitute investment or consultation advice or investment strategy. The information is not tailored to the investment needs of any specific person and therefore does not involve a consideration of any of the investment objectives, financial situation or needs of any viewer that may receive it. Kindly also note that past performance is not a reliable indicator of future results. Actual results may differ materially from those anticipated in forward-looking or past performance statements. We assume no liability as to the accuracy or completeness of any of the information and/or content provided herein and the Company cannot be held responsible for any omission, mistake nor for any loss or damage including without limitation to any loss of profit which may arise from reliance on any information supplied by Everest Fortune Group.

AUDJPYHello Traders,
We are waiting for a confirmation from CPI news! Any big surprise means we should not trade against it!
This is out Daily Chart!
A bullish chart it really is!
We are searching for middle of the channel to react!
The trend-line could be used as Liquidity hunt!

AUD/JPY – H4 - Rising Wedge Breakdown | Key Zones Targeted📝 Description:
The AUD/JPY pair is showing a clear Rising Wedge formation on the 4H timeframe, with three clean touches on the trendline—indicating weakening bullish momentum. Price has now broken below the lower trendline, suggesting increased probability of bearish continuation toward the next key zones. FX:AUDJPY
This setup highlights:
Rising Wedge pattern
Trendline break
Retest opportunity
Key support zones at 99.00 and 97.80
AUD fundamentals: driven by commodity demand, RBA policy, and risk sentiment
JPY fundamentals: influenced by BOJ stance, yields, and safe-haven flows
This analysis is ideal for traders monitoring price action, forex patterns, and high-probability setups on AUD/JPY.
Keep an eye on upcoming economic releases from RBA, BOJ, and US data, as they can influence risk sentiment and impact this pair heavily.
✅ Support this analysis with a
LIKE 👍 | COMMENT 💬 | FOLLOW 🔔
It helps a lot & keeps the ideas coming!
⚠️ Disclaimer: This analysis is for educational purposes only and does not constitute financial advice. Forex trading involves high risk. Trade only with capital you can afford to lose and always do your own research.

AUD/JPY: Exhaustion at The High?AUD/JPY briefly traded at a 16-month high on Thursday before reversing lower. At current levels it’s on track to form a spinning-top doji on the weekly chart, and it has already printed a shooting-star candle on the daily at the November high and monthly S1 pivot.
Given the multi-week bearish RSI divergence and false breakout at the highs, the bias is for some mean reversion towards at least the 20-day EMA. The 100 handle and 50-day EMA near the January high also make viable downside targets for bears, should the yen enjoy a bout of risk-on strength.
Matt Simpson, Market Analyst at City Index.

Bullish bounce off 50% Fibonacci support?AUD/JPY has bounced off the pivot, which is an overlap support that aligns with the 50% Fibonacci retracement and could potentially rise to the 1st resistance.
Pivot: 101.30
1st Support: 100.85
1st Resistance: 102.22
Disclaimer:
The opinions given above constitute general market commentary and do not constitute the opinion or advice of IC Markets or any form of personal or investment advice.
Any opinions, news, research, analyses, prices, other information, or links to third-party sites contained on this website are provided on an "as-is" basis, are intended to be informative only, and are not advice, a recommendation, research, a record of our trading prices, an offer of, or solicitation for, a transaction in any financial instrument and thus should not be treated as such. The information provided does not involve any specific investment objectives, financial situation, or needs of any specific person who may receive it. Please be aware that past performance is not a reliable indicator of future performance and/or results. Past performance or forward-looking scenarios based upon the reasonable beliefs of the third-party provider are not a guarantee of future performance. Actual results may differ materially from those anticipated in forward-looking or past performance statements. IC Markets makes no representation or warranty and assumes no liability as to the accuracy or completeness of the information provided, nor any loss arising from any investment based on a recommendation, forecast, or any information supplied by any third party.

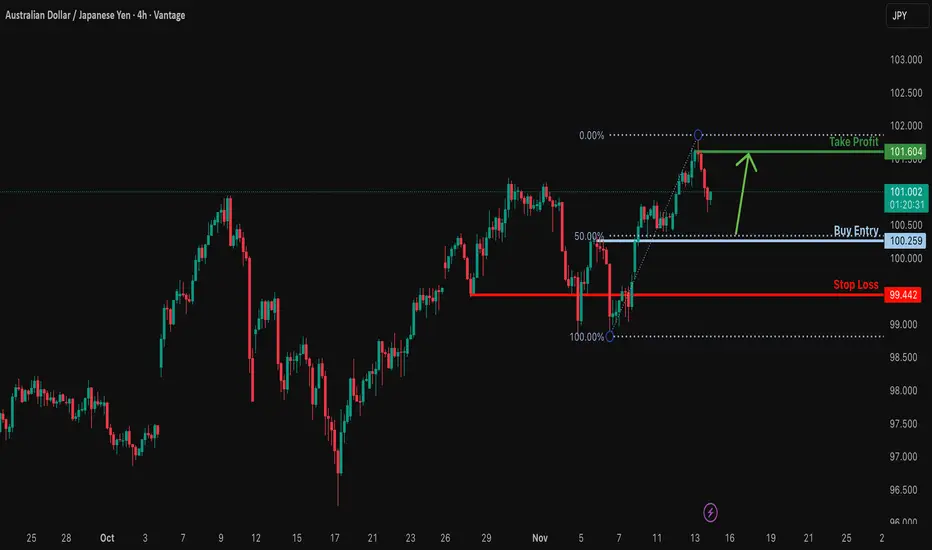
Bullish bounce off 50% Fibonacci support?AUD/JPY is declining toward a key support area, which is a pullback level aligned with the 50% Fibonacci retracement. From this level, the pair could potentially bounce toward our take-profit target.
Entry: 100.25
Why we like it:
Price is approaching a pullback support zone that aligns with the 50% Fibonacci retracement.
Stop Loss: 99.44
Why we like it:
This level is positioned just below the pullback support, providing a logical risk buffer.
Take Profit: 101.60
Why we like it:
This target aligns with a swing-high resistance level.
Enjoying your TradingView experience? Review us!
Please be advised that the information presented on TradingView is provided to Vantage (‘Vantage Global Limited’, ‘we’) by a third-party provider (‘Everest Fortune Group’). Please be reminded that you are solely responsible for the trading decisions on your account. There is a very high degree of risk involved in trading. Any information and/or content is intended entirely for research, educational and informational purposes only and does not constitute investment or consultation advice or investment strategy. The information is not tailored to the investment needs of any specific person and therefore does not involve a consideration of any of the investment objectives, financial situation or needs of any viewer that may receive it. Kindly also note that past performance is not a reliable indicator of future results. Actual results may differ materially from those anticipated in forward-looking or past performance statements. We assume no liability as to the accuracy or completeness of any of the information and/or content provided herein and the Company cannot be held responsible for any omission, mistake nor for any loss or damage including without limitation to any loss of profit which may arise from reliance on any information supplied by Everest Fortune Group.
How i trade This is how i trade.
Looking at AUDJPY, I want to show you step by step how i trade using volume, momentum and rsi, looking at each timeframe from the monthly to the 5 min.
