AUDCAD SUPPLY LEVEL AHEAD|SHORT|
b]✅AUDCAD is approaching a previously defined supply zone where institutional orders are likely positioned. A reaction from this area could trigger short-term bearish flow toward the 0.9130 objective, completing a liquidity draw to the downside. Time Frame 2H.
SHORT🔥
✅Like and subscribe to never miss a new idea!✅
AUDCAD

AUDCAD Forming Descending WedgeAUDCAD on the 4H timeframe has been consolidating within a descending wedge structure, and price is now breaking out of the upper trendline, signaling a potential bullish shift. The series of higher lows forming near the wedge base hints at accumulation, while repeated rejections from the lower boundary suggest sellers are losing momentum. As long as price holds above the breakout zone, I expect continuation toward 0.9220 and eventually the 0.9300 region.
On the fundamental side, the Australian dollar is gaining traction as improving risk sentiment and stabilizing commodity demand support AUD strength. Meanwhile, the Canadian dollar is softening due to recent pullbacks in crude oil prices and increasing speculation that the Bank of Canada may not maintain its hawkish stance for long if economic slowdown persists. This divergence creates a favorable backdrop for AUDCAD bulls.
I’ll be watching for a minor retest of the broken wedge resistance to confirm support. If momentum holds, buyers could drive an impulsive leg toward previous supply areas. For now, I remain bullish as long as price stays above recent breakout levels, turning this structure into a profitable continuation play.

AUDCAD Technical AnalysisBased on Simple Technical Analysis ( Trendline + Support & Resistance )
Risk Disclaimer:
Please be advised that I am not telling anyone how to spend or invest their money. Take all of my analysis as my own opinion, as entertainment, and at your own risk. I assume no responsibility or liability for any errors or omissions in the content of this page, and they are for educational purposes only. Any action you take on the information in this analysis is strictly at your own risk. There is a very high degree of risk involved in trading. Past results are not indicative of future returns. Good luck :-)

AUDCAD: Wait for the Close – 0.9130 vs 0.9057AUDCAD is sitting at a make-or-break spot. It’s been climbing in a 4H channel but just topped out and pulled back to support. I won’t guess mid-range—I'll trade the break:
Bull: H4 candle closes above 0.9130 → room toward 0.9165/0.9180, then 0.9230–0.9250.
Bear: H4 candle closes below 0.9057 → opens 0.9000, then 0.8950–0.8920.
I prefer a close and quick retest/hold for confirmation. Watch AUD/CAD news and oil (for CAD).

Bearish drop?AUD/CAD has rejected off the pivot, which is a pullback resistance and could drop to the 1st support, which aligns with the 78.6% Fibonacci projection.
Pivot: 0.91529
1st Support: 0.90179
1st Resistance: 0.92279
Disclaimer:
The above opinions given constitute general market commentary, and do not constitute the opinion or advice of IC Markets or any form of personal or investment advice.
Any opinions, news, research, analyses, prices, other information, or links to third-party sites contained on this website are provided on an "as-is" basis, are intended only to be informative, is not an advice nor a recommendation, nor research, or a record of our trading prices, or an offer of, or solicitation for a transaction in any financial instrument and thus should not be treated as such. The information provided does not involve any specific investment objectives, financial situation and needs of any specific person who may receive it. Please be aware, that past performance is not a reliable indicator of future performance and/or results. Past Performance or Forward-looking scenarios based upon the reasonable beliefs of the third-party provider are not a guarantee of future performance. Actual results may differ materially from those anticipated in forward-looking or past performance statements. IC Markets makes no representation or warranty and assumes no liability as to the accuracy or completeness of the information provided, nor any loss arising from any investment based on a recommendation, forecast or any information supplied by any third-party.

AUD/CAD: Bearish Drop to 0.9097?As the previous analysis worked exactly as predicted, FX:AUDCAD is signaling a bearish continuation on the 1-hour chart , with price testing a downward trendline and forming lower highs, indicating sustained selling pressure. The entry zone sits near the resistance zone , aligning with the trendline for a high-probability short setup if sellers maintain control.
Entry between 0.9182-0.9200 for a sell position. Targets at 0.9116 (first) and 0.9097 (second) near the support zone for a solid risk-reward ratio. Set a stop loss on a close above 0.922 to protect against an unexpected reversal. Look for confirmation with a break below 0.9182 accompanied by increasing volume, driven by the prevailing bearish momentum.
Fundamentally , tomorrow—Thursday, October 16, 2025—we have the Australian Unemployment Rate report, which could trigger volatility in AUD. Additionally, the Bank of Canada Governor’s participation in a friendly session in Washington tomorrow may influence CAD movements, adding another layer of uncertainty to the pair. 💡
📝 Trade Plan:
✅ Entry Zone: 0.9182 – 0.9200 (short setup near resistance & trendline)
❌ Stop Loss: Close above 0.9220
🎯 Targets:
TP1: 0.9116 (initial support)
TP2: 0.9097 (extended downside target)
What’s your take on this setup? Share below! 👇

mrmoney limited AUD/CAD position trading ideawaiting for price to get to our monthly support or resistance zone so as to make informed trading decision

AUD-CAD Will Fall! Sell!
Hello,Traders!
AUDCAD reacts to the horizontal supply area, showing clear signs of Smart Money distribution. A bearish move is expected toward the next liquidity pool near 0.9130$. Time Frame 4H.
Sell!
Comment and subscribe to help us grow!
Check out other forecasts below too!
Disclosure: I am part of Trade Nation's Influencer program and receive a monthly fee for using their TradingView charts in my analysis.

AUD/CAD BULLS ARE STRONG HERE|LONG
Hello, Friends!
We are going long on the AUD/CAD with the target of 0.917 level, because the pair is oversold and will soon hit the support line below. We deduced the oversold condition from the price being near to the lower BB band. However, we should use low risk here because the 1W TF is red and gives us a counter-signal.
Disclosure: I am part of Trade Nation's Influencer program and receive a monthly fee for using their TradingView charts in my analysis.
✅LIKE AND COMMENT MY IDEAS✅

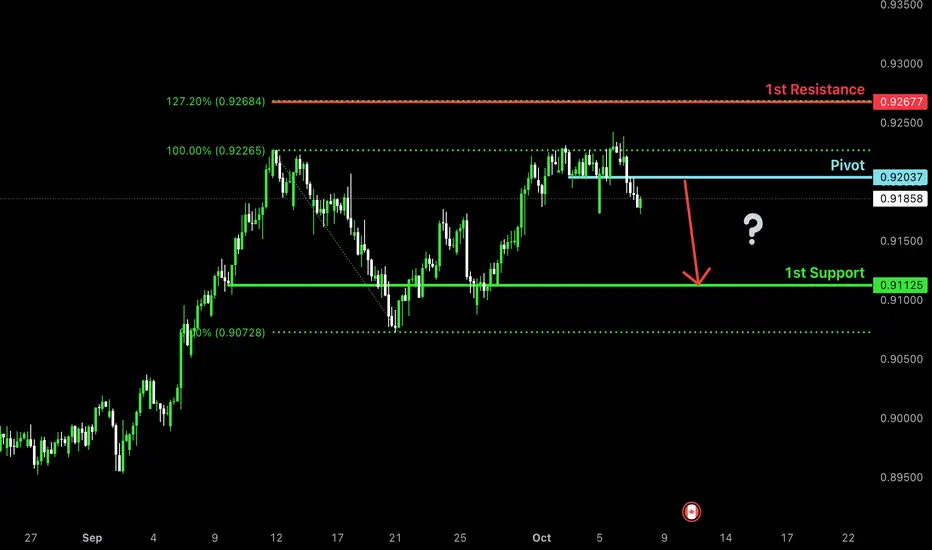
Potential bearish drop?AUD/CAD is rising towards the pivot which is a pullback resistance and could drop to the 1st support.
Pivot: 0.92037
1st Support: 0.91125
1st Resistance: 0.92677
Disclaimer:
The above opinions given constitute general market commentary, and do not constitute the opinion or advice of IC Markets or any form of personal or investment advice.
Any opinions, news, research, analyses, prices, other information, or links to third-party sites contained on this website are provided on an "as-is" basis, are intended only to be informative, is not an advice nor a recommendation, nor research, or a record of our trading prices, or an offer of, or solicitation for a transaction in any financial instrument and thus should not be treated as such. The information provided does not involve any specific investment objectives, financial situation and needs of any specific person who may receive it. Please be aware, that past performance is not a reliable indicator of future performance and/or results. Past Performance or Forward-looking scenarios based upon the reasonable beliefs of the third-party provider are not a guarantee of future performance. Actual results may differ materially from those anticipated in forward-looking or past performance statements. IC Markets makes no representation or warranty and assumes no liability as to the accuracy or completeness of the information provided, nor any loss arising from any investment based on a recommendation, forecast or any information supplied by any third-party.
AUD/CAD: Bearish Drop to 0.91630?FX:AUDCAD is signaling a bearish move on the 1-hour chart , with an entry zone between 0.92215-0.92280 near a resistance level.
First target at 0.91875 🎯 marks initial support, while the second at 0.91630 🎯 offers a deeper downside play. 📈 Set a stop loss on a daily close above 0.9232 to manage risk effectively. 🌟
A break below 0.92 with strong volume could confirm this drop, driven by CAD strength and AUD weakness. Watch commodity trends! 💡
📝 Trade Plan:
✅ Entry Zone: 0.92215 – 0.92280 (resistance area)
❌ Stop Loss: Daily close above 0.9232 to manage risk
🎯 Target 1: 0.91875 (initial support)
🎯 Target 2: 0.91630 (deeper downside target)
Ready for this move? Drop your take below! 👇

AUD/CAD BEARS ARE GAINING STRENGTH|SHORT
AUD/CAD SIGNAL
Trade Direction: short
Entry Level: 0.921
Target Level: 0.910
Stop Loss: 0.928
RISK PROFILE
Risk level: medium
Suggested risk: 1%
Timeframe: 1D
Disclosure: I am part of Trade Nation's Influencer program and receive a monthly fee for using their TradingView charts in my analysis.
✅LIKE AND COMMENT MY IDEAS✅

AUDCAD: DTL BreakoutDaily Timeframe:
Bullish bar on market open indicates strength
Bullish bar also covering dojis on two previous days
H1 Timeframe:
Price crosses above DTL as first indication of momentum
Price is above crossing above EMA20
EMA20 is also expanding away from EMA60
Price crossing back above EMA60 indicates bearish sentiment is unlikely to hold

Bullish bounce?AUD/CAD is falling towards the support level, which is a pullback support that aligns with the 38.2% Fibonacci retracement and could bounce from this level to our take rpofit.
Entry: 0.91661
Why we like it:
There is a pullback support that lines up with the 38.2% Fibonacci retracement.
Stop loss: 0.91036
Why we like it:
There is a pullback support that lines up with the 78.6% Fibonacci retracement.
Take profit: 0.92722
Why we like it:
There is a resistance level which lines up with the 127.2% Fibonacci extension.
Enjoying your TradingView experience? Review us!
Please be advised that the information presented on TradingView is provided to Vantage (‘Vantage Global Limited’, ‘we’) by a third-party provider (‘Everest Fortune Group’). Please be reminded that you are solely responsible for the trading decisions on your account. There is a very high degree of risk involved in trading. Any information and/or content is intended entirely for research, educational and informational purposes only and does not constitute investment or consultation advice or investment strategy. The information is not tailored to the investment needs of any specific person and therefore does not involve a consideration of any of the investment objectives, financial situation or needs of any viewer that may receive it. Kindly also note that past performance is not a reliable indicator of future results. Actual results may differ materially from those anticipated in forward-looking or past performance statements. We assume no liability as to the accuracy or completeness of any of the information and/or content provided herein and the Company cannot be held responsible for any omission, mistake nor for any loss or damage including without limitation to any loss of profit which may arise from reliance on any information supplied by Everest Fortune Group.

AUDCAD: Long Trading Opportunity
AUDCAD
- Classic bullish formation
- Our team expects growth
SUGGESTED TRADE:
Swing Trade
Buy AUDCAD
Entry Level - 0.9206
Sl - 0.9200
Tp - 0.9217
Our Risk - 1%
Start protection of your profits from lower levels
Disclosure: I am part of Trade Nation's Influencer program and receive a monthly fee for using their TradingView charts in my analysis.
❤️ Please, support our work with like & comment! ❤️

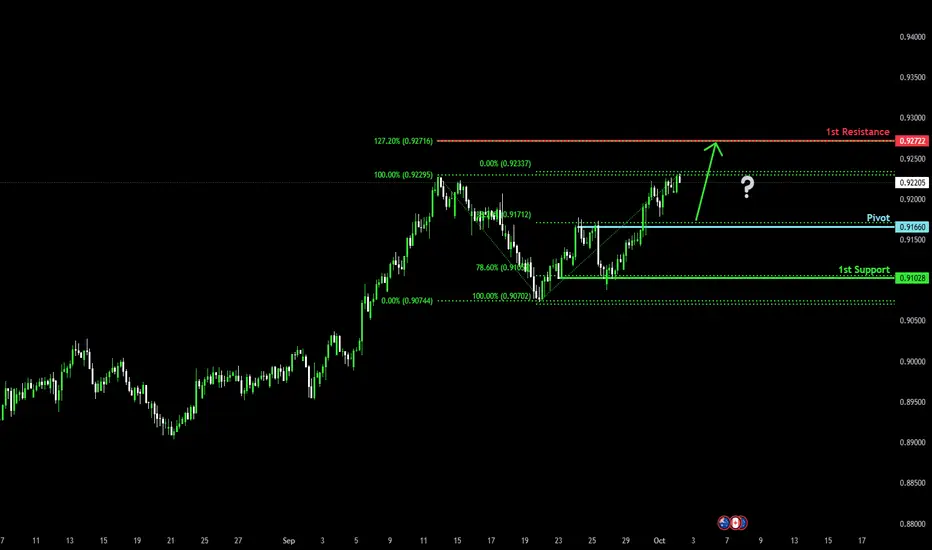
Bullish bounce setup?AUD/CAD is falling towards the pivot which is a pullback support and could bounce to the 1st resistance which lines up with the 127.2% Fibonacci extension.
Pivot: 0.9166
1st Support: 0.91028
1st Resistance: 0.92722
Disclaimer:
The above opinions given constitute general market commentary, and do not constitute the opinion or advice of IC Markets or any form of personal or investment advice.
Any opinions, news, research, analyses, prices, other information, or links to third-party sites contained on this website are provided on an "as-is" basis, are intended only to be informative, is not an advice nor a recommendation, nor research, or a record of our trading prices, or an offer of, or solicitation for a transaction in any financial instrument and thus should not be treated as such. The information provided does not involve any specific investment objectives, financial situation and needs of any specific person who may receive it. Please be aware, that past performance is not a reliable indicator of future performance and/or results. Past Performance or Forward-looking scenarios based upon the reasonable beliefs of the third-party provider are not a guarantee of future performance. Actual results may differ materially from those anticipated in forward-looking or past performance statements. IC Markets makes no representation or warranty and assumes no liability as to the accuracy or completeness of the information provided, nor any loss arising from any investment based on a recommendation, forecast or any information supplied by any third-party.
AUD/CAD: Rejection from Resistance Signals Bearish CorrectionAUD/CAD has faced a strong rejection near the 0.9218 resistance zone, with price now turning lower after a failed breakout attempt. Although the move was initially supported by the upward trendline, momentum faded near the highs, indicating buyer exhaustion.
If sellers maintain control below 0.9200, the pair is likely to move toward the 0.9160 support level, with further downside potential toward 0.9132. The broader structure points to a corrective phase within the channel, reinforcing a bearish near-term bias.

AUDCAD: Watching for Pullback .. Here's My Trade Plan📊 AUDCAD has rallied strongly following the release of positive RBA data, giving the Aussie a notable boost 💹.
🔎 On the chart, we can clearly see a phase of bullish expansion 🚀. At this stage, my focus is on waiting for a retracement, allowing price to pull back and then confirm with a bullish break of structure on a lower timeframe for a long entry 🎯.
⚠️ Disclaimer: This analysis is for educational purposes only and not financial advice. Always apply proper risk management.

AUD/CAD SELLERS WILL DOMINATE THE MARKET|SHORT
AUD/CAD SIGNAL
Trade Direction: short
Entry Level: 0.913
Target Level: 0.906
Stop Loss: 0.918
RISK PROFILE
Risk level: medium
Suggested risk: 1%
Timeframe: 9h
Disclosure: I am part of Trade Nation's Influencer program and receive a monthly fee for using their TradingView charts in my analysis.
✅LIKE AND COMMENT MY IDEAS✅

AUDCAD What Next? BUY!
My dear friends,
My technical analysis for AUDCAD is below:
The market is trading on 0.9118 pivot level.
Bias - Bullish
Technical Indicators: Both Super Trend & Pivot HL indicate a highly probable Bullish continuation.
Target - 0.9138
Recommended Stop Loss - 0.9107
About Used Indicators:
A pivot point is a technical analysis indicator, or calculations, used to determine the overall trend of the market over different time frames.
Disclosure: I am part of Trade Nation's Influencer program and receive a monthly fee for using their TradingView charts in my analysis.
———————————
WISH YOU ALL LUCK

AUD/CAD BULLS ARE GAINING STRENGTH|LONG
Hello, Friends!
AUD/CAD pair is trading in a local uptrend which know by looking at the previous 1W candle which is green. On the 4H timeframe the pair is going down. The pair is oversold because the price is close to the lower band of the BB indicator. So we are looking to buy the pair with the lower BB line acting as support. The next target is 0.914 area.
Disclosure: I am part of Trade Nation's Influencer program and receive a monthly fee for using their TradingView charts in my analysis.
✅LIKE AND COMMENT MY IDEAS✅

AUDCAD: Trend ContinuationThere's a trend continuation opportunity present on the AUDCAD pair. Here's my breakdown by timeframe.
Daily Timeframe:
Price pulled back and held supported at EMA20, which isn't a strong indication of support
Strong uptrend is indicated by EMA20 above EMA60
H1 Timeframe:
There's confluence here where Price is exiting the EMA20/60 band
EMA20 also remains above EMA60 for a strong uptrend
Pricing breaking DTL also remains valid as there was upside momentum

AUDCAD - Hedging Short Targeting 0.9257Currently trading a 96k prop account with an open sell trade of 0.5 lots. Price seems to want to rise higher and so I'm not really confident in this short sell position at the present moment. Roughly 30 minutes ago just before creating this analysis I noticed Aussie accelerating and especially with pairs like EURAUD. I decided to hedge it 100% by adding an equal lot on the long size of 0.5.
I believe there is a good chance this pair will rise to my first target as explained in the video which is 0.9257
At this level I plan to lock-in my hedge of 0.5 long lots, book the profit and consider adding an additional sell of 0.5 lots to bring my breakeven level closer.
