AUDJPY

AUDJPY Bullish breakout consolidation capped at 101.15The AUDJPY currency pair continues to exhibit a bullish price action bias, supported by a sustained rising trend. Recent intraday movement reflects a sideways consolidation, suggesting potential continuation of the broader uptrend.
Key Technical Level: 100.17
This level marks the prior consolidation range and now acts as pivotal support. A corrective pullback toward 100.17 followed by a bullish rejection would reinforce the bullish trend, targeting the next resistance levels at:
101.15 – Near-term resistance
101.40 – Minor swing high
101.70 – Longer-term bullish objective
On the other hand, a decisive daily close below 100.17 would invalidate the bullish setup, shifting the outlook to bearish in the short term. This could trigger a deeper retracement toward:
99.90 – Initial support
99.65 – Key downside target
Conclusion:
As long as 100.17 holds as support, the technical outlook remains bullish, favouring long positions on dips. A confirmed break below this level would signal a shift in sentiment and open the door to a corrective pullback phase.
This communication is for informational purposes only and should not be viewed as any form of recommendation as to a particular course of action or as investment advice. It is not intended as an offer or solicitation for the purchase or sale of any financial instrument or as an official confirmation of any transaction. Opinions, estimates and assumptions expressed herein are made as of the date of this communication and are subject to change without notice. This communication has been prepared based upon information, including market prices, data and other information, believed to be reliable; however, Trade Nation does not warrant its completeness or accuracy. All market prices and market data contained in or attached to this communication are indicative and subject to change without notice.


AUD/JPY: Testing Resistance with Signs of Bullish ExhaustionAUD/JPY is approaching the 99.80 resistance zone after a strong bounce from the 97.50 consolidation area. The structure shows a higher low within an upward channel, though current momentum signals a possible correction phase.
If the pair fails to hold above 97.80, a pullback toward 98.425 is likely, possibly aiming to fill the gap below. The broader trend remains bullish, but the rally appears to be maturing, with the 100.000 psychological level posing potential resistance.

Will AUD/JPY Break 97.5? Bullish Thief Plan & Fundamental Edge🔑 AUD/JPY “Aussie vs Yen” | Thief Market Plan 🎭 (Swing/Day Trade)
📌 Plan Overview
Bias: Bullish (Pending Order Plan)
Entry Idea: Breakout above 97.500 ⚡ Moving Average Dynamic Line
Thief Layer Strategy:
Multiple Buy Limit Orders → 96.500 | 97.000 | 97.500 | 97.700
You can increase layer entries based on your own plan.
✅ Always confirm with breakout before entry.
🔔 Set an alert in TradingView to catch breakout moves easily.
Stop Loss (SL): Thief SL suggested near 96.300 (after breakout level).
Note: This is not a fixed rule—adjust SL according to your own risk management.
Take Profit (TP): Resistance barricade at 99.000 (overbought + liquidity trap zone).
Note: Escape with profits before the police barricade! 🎯
🧭 Why This Plan? (Thief OG Strategy + Market Analysis)
📊 AUD/JPY Key Data (08 Sept 2025)
Prev. Close: 97.35
Day’s Range: 96.82 – 97.35
Change: -0.44 (-0.45%)
😰 Fear & Greed Sentiment
CNN Fear & Greed Index → 51.5 (Neutral)
Market momentum balanced, mild caution amid geopolitical risk.
🏛 Retail vs Institutional Sentiment
🧑💼 Retail Traders → Bullish 60% | Bearish 40%
Retail leaning bullish thanks to AUD resilience.
🏦 Institutional Outlook → Bullish bias (AUD strength vs BOJ dovishness)
Concerns: Japanese political uncertainty (PM resignation).
Macro Score: 7/10 in favor of AUD.
🌍 Fundamental & Macro Drivers
✅ AUD Strengths
🔥 Inflation hot (July CPI +2.8% y/y)
🏠 Household spending growth (+5.1% y/y)
🏦 RBA keeping policy steady (hawkish tilt)
❌ JPY Weaknesses
🕊️ BOJ dovish stance continues
🏛️ Political instability (PM resignation)
🚗 US auto tariff cuts pressuring JPY
🐂🐻 Market Outlook
Bullish (Long) Score: 70%
Bearish (Short) Score: 30%
Summary: AUD/JPY shows bullish structure above 97.00, but caution on overbought signals after 10-day rally.
⚠️ Risks to Watch
US NFP (Sept 12) → May drive USD/JPY flows.
Overbought daily RSI signals.
Geopolitical volatility (China & Ukraine).
🎯 Bottom Line
AUD/JPY maintains a bullish bias 🟢 with fundamentals, sentiment, and Thief layering strategy supporting higher targets.
📌 Monitor 97.45–97.50 breakout zone → potential continuation toward 99.000.
🔗 Related Pairs to Watch
FX:USDJPY | OANDA:AUDUSD | OANDA:EURJPY | OANDA:GBPJPY
✨ “If you find value in my analysis, a 👍 and 🚀 boost is much appreciated — it helps me share more setups with the community!”
#audjpy #forex #swingtrade #daytrade #fundamentalanalysis #sentiment #thieftrader #forexanalysis #macromarket #currencytrading

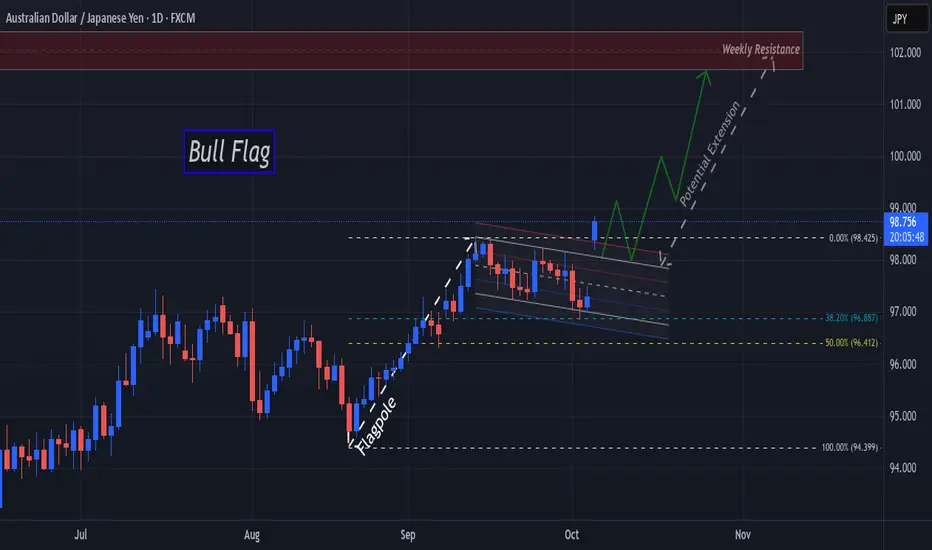
AJ Bulls Raise A Flag As They Gap Up To Start The Week!Price on OANDA:AUDJPY has been consolidating down a Descending Channel for the past 3 weeks and after making a 38.2% Retracement of the 98.425 High, to open this week, Bulls created a huge gap up, breaking out of the Descending Channel!
This Breakout confirms the Continuation Pattern, the Bull Flag!
If Bulls are able to secure a close higher than 98.425 during this Breakout and are successful in a Retest in the 98 - 97.8 range, this could deliver potential Long opportunities as a Bull Flag Breakout and Retest Set-Up!
Once we have a Valid Breakout and Successful Retest, the Price Target for the move will be into the Weekly Resistance that can be found in the 102 range from November Highs of 2024!
AUDJPY.....IS GOING FOR A RIDE? I THINK SOHey Amazing People!
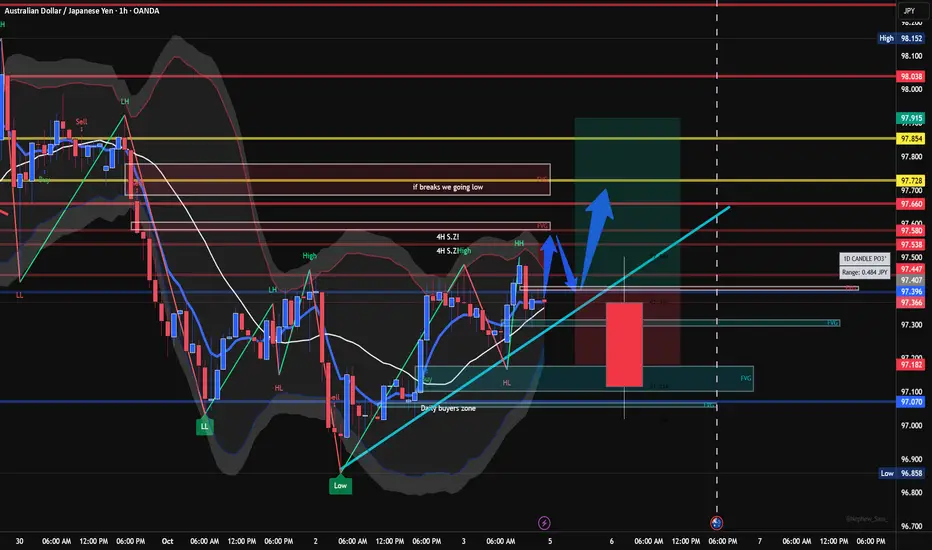
My T.A. of AJ is pretty simplistic, we have seen a rejection to the downside and what seems to be a double bottom in the making on the 1H time frame! Showing me that we could see a heavy push to the upside, also taking out a key R-Zone! Meaning that there is a TON of avaiable room to run up and orders that need to be eaten up! So I believe if we have a break of the current high we can see a rally to Price points such as
97.580 or even
97.660-97.728!
I am worried about AUS news reaction on tuesday but we can only wait and see but either way the currency strength are rather equal so it sould just continue with trend.
This is just my thoughts and logging but tell me what you think? I trade with binary options so I let price tell me which way to go so if it follows this im going to sell high and buy low! If price gives me a push to the downside well dang haha looks like we looking for sell ops!! ;P
but let me know your thoughts or if you feel like this could be correct as well!
AUDJPY: Pullback From Resistance Confirmed 🇦🇺🇯🇵
There is a high chance that AUDJPY will continue retracing from
the underlined resistance cluster.
A double top pattern formation on that and its neckline breakout
provide a reliable confirmation.
Goal - 97.18
❤️Please, support my work with like, thank you!❤️
I am part of Trade Nation's Influencer program and receive a monthly fee for using their TradingView charts in my analysis.

AUDJPY Daily Forecast -Q4 | W40 | D3 | Y25|📅 Q4 | W40 | D3 | Y25|
📊 AUDJPY Daily Forecast
🔍 Analysis Approach:
I’m applying Smart Money Concepts, focusing on:
Identifying Points of Interest on the Higher Time Frames (HTFs) 🕰️
Using those POIs to define a clear trading range 📐
Refining those zones on Lower Time Frames (LTFs) 🔎
Waiting for a Break of Structure (BoS) for confirmation ✅
This method allows me to stay precise, disciplined, and aligned with the market narrative, rather than chasing price.
💡 My Motto:
"Capital management, discipline, and consistency in your trading edge."
A positive risk-to-reward ratio, paired with a high win rate, is the backbone of any solid trading plan 📈🔐
⚠️ Losses?
They’re part of the mathematical game of trading 🎲
They don’t define you — they’re necessary, they happen, and we move forward 📊➡️
🙏 I appreciate you taking the time to review my Daily Forecast.
Stay sharp, stay consistent, and protect your capital
— FRNGT 🚀
FX:AUDJPY

AUD/JPY - Bearish Rejection from Key Zone📉 AUD/JPY Analysis 📉
Price is currently testing a key structure level after rejecting the upper zone. If bearish pressure continues, we could see a potential drop toward the highlighted Key Zones below. 🚨
🔑 Key Levels:
Resistance Zone: 96.10 – 96.30
Support Zones: 97.40 / 97.25
⚠️ Watch how price reacts around the resistance zone. A strong rejection could confirm the move toward the downside targets.
💬 Share your thoughts below – Do you expect AUD/JPY to continue bearish momentum or bounce back up?
#AUDJPY #ForexTrading #PriceAction #TechnicalAnalysis #FX #TradingView #ForexCommunity #ChartAnalysis #BearishSetup
✅ If you found this useful, don’t forget to LIKE 👍, COMMENT 💬, and FOLLOW 🔔 for more analysis!
📌 Disclaimer:
This analysis is for educational purposes only and not financial advice. Please do your own research before making any trading decisions.

Bearish drop off?AUD/JPY has rejected off the resistance level, which is an overlap resistance and could potentially drop from this level to our take profit.
Entry: 97.26
Why we like it:
There is an overlap resistance level.
Stop loss: 98.26
Why we like it:
There is a swing high resistance level.
Take profit: 96.13
Why we like it:
There is a pullback support that is slightly above the 61.8% Fibonacci retracement.
Enjoying your TradingView experience? Review us!
Please be advised that the information presented on TradingView is provided to Vantage (‘Vantage Global Limited’, ‘we’) by a third-party provider (‘Everest Fortune Group’). Please be reminded that you are solely responsible for the trading decisions on your account. There is a very high degree of risk involved in trading. Any information and/or content is intended entirely for research, educational and informational purposes only and does not constitute investment or consultation advice or investment strategy. The information is not tailored to the investment needs of any specific person and therefore does not involve a consideration of any of the investment objectives, financial situation or needs of any viewer that may receive it. Kindly also note that past performance is not a reliable indicator of future results. Actual results may differ materially from those anticipated in forward-looking or past performance statements. We assume no liability as to the accuracy or completeness of any of the information and/or content provided herein and the Company cannot be held responsible for any omission, mistake nor for any loss or damage including without limitation to any loss of profit which may arise from reliance on any information supplied by Everest Fortune Group.

AUDJPY sideways consolidation support at 96.80The AUDJPY currency pair continues to exhibit a bullish price action bias, supported by a sustained rising trend. Recent intraday movement reflects a sideways consolidation, suggesting potential continuation of the broader uptrend.
Key Technical Level: 96.80
This level marks the prior consolidation range and now acts as pivotal support. A corrective pullback toward 96.80 followed by a bullish rejection would reinforce the bullish trend, targeting the next resistance levels at:
97.80 – Near-term resistance
98.00 – Minor swing high
98.30 – Longer-term bullish objective
On the other hand, a decisive daily close below 96.80 would invalidate the bullish setup, shifting the outlook to bearish in the short term. This could trigger a deeper retracement toward:
96.60 – Initial support
96.40 – Key downside target
Conclusion:
As long as 96.80 holds as support, the technical outlook remains bullish, favouring long positions on dips. A confirmed break below this level would signal a shift in sentiment and open the door to a corrective pullback phase.
This communication is for informational purposes only and should not be viewed as any form of recommendation as to a particular course of action or as investment advice. It is not intended as an offer or solicitation for the purchase or sale of any financial instrument or as an official confirmation of any transaction. Opinions, estimates and assumptions expressed herein are made as of the date of this communication and are subject to change without notice. This communication has been prepared based upon information, including market prices, data and other information, believed to be reliable; however, Trade Nation does not warrant its completeness or accuracy. All market prices and market data contained in or attached to this communication are indicative and subject to change without notice.

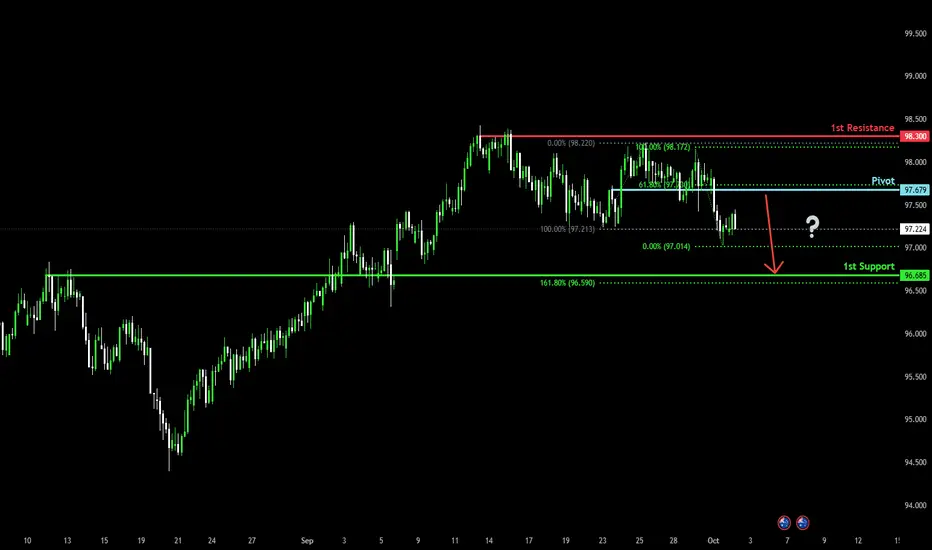
Heading into 61.8% Fibonacci resistanceAUD/JPY is rising towards the pivot which has been identified as a pullback resistance that lines up with the 61.8% Fibonacci retracement and could reverse to the 1st support ,which is an overlap support.
Pivot: 97.67
1st Support: 96.68
1st Resistance: 98.30
Disclaimer:
The above opinions given constitute general market commentary, and do not constitute the opinion or advice of IC Markets or any form of personal or investment advice.
Any opinions, news, research, analyses, prices, other information, or links to third-party sites contained on this website are provided on an "as-is" basis, are intended only to be informative, is not an advice nor a recommendation, nor research, or a record of our trading prices, or an offer of, or solicitation for a transaction in any financial instrument and thus should not be treated as such. The information provided does not involve any specific investment objectives, financial situation and needs of any specific person who may receive it. Please be aware, that past performance is not a reliable indicator of future performance and/or results. Past Performance or Forward-looking scenarios based upon the reasonable beliefs of the third-party provider are not a guarantee of future performance. Actual results may differ materially from those anticipated in forward-looking or past performance statements. IC Markets makes no representation or warranty and assumes no liability as to the accuracy or completeness of the information provided, nor any loss arising from any investment based on a recommendation, forecast or any information supplied by any third-party.
AUDJPY - Impulse wave underway?• Following a 3-wave corrective decline from July 2024 to April 2025, I’ve identified what appears to be a 5-wave impulsive move to the upside. There are multiple ways to count this structure, but treating wave (iv) as a running flat gives the most balanced outcome from both a Fibonacci retracement and extension perspective.
• From a higher-degree view, I believe Wave 1 and Wave 2 of a larger impulsive sequence are now complete, and we may currently be in Wave 1 of Wave 3 which is a high-probability rally zone.
• I entered the trade at 97.40 on Monday, 8th September, following a breakout above recent swing highs. Since then, price may have completed a Wave 2 retracement, and my stop loss remains at 96.30; the start of the current Wave 1 leg so the trade thesis is still valid.
• Key risk to this setup is upcoming inflation data, which could influence the Fed’s interest rate decision and impact global risk sentiment (AUDJPY being a risk-sensitive pair).
• View Daily Count for Broader Context -

AUDJPY FORECAST RESULTS AND PROFITSAUDJPY FORECAST RESULTS AND PROFITS - price traded as we projected and after target has been reached, it dump. Precision

AUDJPY Short-Term Sell SetupI’m watching this pair closely… Price already rejected from the supply zone above and is now sliding down.
On the chart, the fib retracement levels gave a clean reaction, and we’re now holding below 0.618. That tells me sellers are still active.
👉 I expect the drop to extend toward 97.460 – that’s my marked level.
This zone lines up with previous liquidity grabs and sits just before the strong support area (blue zone).
⚡ Personal thought: Unless buyers show sudden strength, the chance of this push lower looks high. I’m not rushing for buys until price hits that support.
Watch for 97.460 reaction.
- If price holds there, I may look for a bounce.
- If broken, next target is inside the blue demand zone.
Patience here is key. No chasing candles. Just waiting for price to come to my level.

AUDJPY Daily Forecast -Q3 | W40 | D30 | Y25|📅 Q3 | W40 | D30 | Y25|
📊 AUDJPY Daily Forecast
🔍 Analysis Approach:
I’m applying Smart Money Concepts, focusing on:
Identifying Points of Interest on the Higher Time Frames (HTFs) 🕰️
Using those POIs to define a clear trading range 📐
Refining those zones on Lower Time Frames (LTFs) 🔎
Waiting for a Break of Structure (BoS) for confirmation ✅
This method allows me to stay precise, disciplined, and aligned with the market narrative, rather than chasing price.
💡 My Motto:
"Capital management, discipline, and consistency in your trading edge."
A positive risk-to-reward ratio, paired with a high win rate, is the backbone of any solid trading plan 📈🔐
⚠️ Losses?
They’re part of the mathematical game of trading 🎲
They don’t define you — they’re necessary, they happen, and we move forward 📊➡️
🙏 I appreciate you taking the time to review my Daily Forecast.
Stay sharp, stay consistent, and protect your capital
— FRNGT 🚀
FX:AUDJPY

AUDJPY Daily Forecast -Q3 | W40 | D29 | Y25|FX:AUDJPY
📅 Q3 | W40 | D29 | Y25|
📊 AUDJPY Daily Forecast
🔍 Analysis Approach:
I’m applying Smart Money Concepts, focusing on:
Identifying Points of Interest on the Higher Time Frames (HTFs) 🕰️
Using those POIs to define a clear trading range 📐
Refining those zones on Lower Time Frames (LTFs) 🔎
Waiting for a Break of Structure (BoS) for confirmation ✅
This method allows me to stay precise, disciplined, and aligned with the market narrative, rather than chasing price.
💡 My Motto:
"Capital management, discipline, and consistency in your trading edge."
A positive risk-to-reward ratio, paired with a high win rate, is the backbone of any solid trading plan 📈🔐
⚠️ Losses?
They’re part of the mathematical game of trading 🎲
They don’t define you — they’re necessary, they happen, and we move forward 📊➡️
🙏 I appreciate you taking the time to review my Daily Forecast.
Stay sharp, stay consistent, and protect your capital
— FRNGT 🚀

AUDJPY breakout retest supported at 97.45The AUDJPY remains in a bullish trend, with recent price action showing signs of a corrective pullback within the broader uptrend.
Support Zone: 97.45 – a key level from previous consolidation. Price is currently testing or approaching this level.
A bullish rebound from 97.45 would confirm ongoing upside momentum, with potential targets at:
98.50 – initial resistance
98.80 – psychological and structural level
99.00 – extended resistance on the longer-term chart
Bearish Scenario:
A confirmed break and daily close below 97.45 would weaken the bullish outlook and suggest deeper downside risk toward:
97.20 – minor support
96.90 – stronger support and potential demand zone
Outlook:
Bullish bias remains intact while the AUDJPY holds above 97.45. A sustained break below this level could shift momentum to the downside in the short term.
This communication is for informational purposes only and should not be viewed as any form of recommendation as to a particular course of action or as investment advice. It is not intended as an offer or solicitation for the purchase or sale of any financial instrument or as an official confirmation of any transaction. Opinions, estimates and assumptions expressed herein are made as of the date of this communication and are subject to change without notice. This communication has been prepared based upon information, including market prices, data and other information, believed to be reliable; however, Trade Nation does not warrant its completeness or accuracy. All market prices and market data contained in or attached to this communication are indicative and subject to change without notice.

AUDJPY SELL opportunity There is a sell opportunity arround
Based on supply zone level
Entry: 98.150
Stoploss: 98.300
Take profit: 97.250
Comment your opinion pls


AUDJPY: Sell SignalLast week we did get a bearish CHoCH followed by new LHs and LLs. We are currently in this trade...
🔴 Entry 97.422
SL 97.9
TP1 96.122
TP2 96.822
TP3 96.422
TP4 95.63
If you decide to enter, make sure you are managing your trades.

AUD/JPY Bullish Breakout, Bulls Eye 99Earlier this week I outlined my bias for a bounce ahead of another leg lower on AUD/JPY. but looking at the strength of the bounce, I suspect we've already seen the corrective low.
AUD/JPY bounced cleanly from 97.40 support and posted its strongest session in five weeks. A Morning Star reversal formed at the 20-day EMA, HVN, and July high, suggesting the correction is complete. Bulls now eye resistance at 99.00, with a breakout targeting the 100.00 handle.
Matt Simpson, Market Analyst at City Index and Forex.com
