GBPUSD POSSIBLE BUY SETUP (This chart shows GBP/USD )This chart shows GBP/USD (British Pound vs US Dollar) on the 1-hour timeframe with a technical setup suggesting a potential bullish reversal.
Here’s a concise breakdown:
Downtrend Line (Black Line) – Price has been respecting a descending trendline, indicating consistent lower highs (bearish momentum).
Change of Character (ChoCH) – A “ChoCH” label appears near 1.335, suggesting that the market may be shifting from bearish to bullish structure — the first sign of a possible trend reversal.
Demand Zone (Green Box) – Around 1.3300–1.3320, this zone represents an area where buyers are expected to step in (potential reversal point).
Bullish Scenario (White Arrow) – The arrow forecasts price to:
Tap into the green demand zone,
Bounce upward, breaking the downtrend line,
Target higher resistance/supply zones near 1.3400–1.3460.
Supply Zones (Red Areas) – Mark previous sell zones or resistance levels where price could react during the upward move.
Summary:
Price is in a downtrend but showing early reversal signs (ChoCH). A bounce from the green demand zone could lead to a bullish move toward the upper resistance zones.
AUDUSD

AUDUSD H1 | Bullish Bounce Off SupportAussie (AUD/USD) has bounced off the buy entry which is a pullback support that aligns with the 61.8% Fibonacci retracement and could rise from this levle to the upside.
Buy entry is at 0.6492, which is a pullback support that aligns with the 61.8% Fibonacci retracement.
Stop loss is at 0.6476, whic is a multi swing low support.
Take profit is at 0.6526, which is a multi swing high ressitance.
Stratos Markets Limited (tradu.com ):
CFDs are complex instruments and come with a high risk of losing money rapidly due to leverage. 68% of retail investor accounts lose money when trading CFDs with this provider. You should consider whether you understand how CFDs work and whether you can afford to take the high risk of losing your money.
Stratos Europe Ltd (tradu.com ):
CFDs are complex instruments and come with a high risk of losing money rapidly due to leverage. 70% of retail investor accounts lose money when trading CFDs with this provider. You should consider whether you understand how CFDs work and whether you can afford to take the high risk of losing your money.

AUDUSD FRGNT Daily Forecast -Q4 | W43 | D24| Y25 |📅 Q4 | W43 | D24| Y25 |
📊 AUDUSD FRGNT Daily Forecast
🔍 Analysis Approach:
I’m applying Smart Money Concepts, focusing on:
Identifying Points of Interest on the Higher Time Frames (HTFs) 🕰️
Using those POIs to define a clear trading range 📐
Refining those zones on Lower Time Frames (LTFs) 🔎
Waiting for a Break of Structure (BoS) for confirmation ✅
This method allows me to stay precise, disciplined, and aligned with the market narrative, rather than chasing price.
💡 My Motto:
"Capital management, discipline, and consistency in your trading edge."
A positive risk-to-reward ratio, paired with a high win rate, is the backbone of any solid trading plan 📈🔐
⚠️ Losses?
They’re part of the mathematical game of trading 🎲
They don’t define you — they’re necessary, they happen, and we move forward 📊➡️
🙏 I appreciate you taking the time to review my Daily Forecast.
Stay sharp, stay consistent, and protect your capital
— FRNGT 🚀
OANDA:AUDUSD

NZD Buys & Sells Pending mitigation on both sides of this. The sweep to the upside takes out plenty of liquidity on the HTF, while the buys look like accumulation. Either setup valid, but I'd be mindful of AUD and the liquidity it's building up. Liquidity sweeps of AUD would further confirm these setups.

AUDUSD FRGNT Daily Forecast -Q4 | W43 | D23| Y25 |📅 Q4 | W43 | D23| Y25 |
📊 AUDUSD FRGNT Daily Forecast
🔍 Analysis Approach:
I’m applying Smart Money Concepts, focusing on:
Identifying Points of Interest on the Higher Time Frames (HTFs) 🕰️
Using those POIs to define a clear trading range 📐
Refining those zones on Lower Time Frames (LTFs) 🔎
Waiting for a Break of Structure (BoS) for confirmation ✅
This method allows me to stay precise, disciplined, and aligned with the market narrative, rather than chasing price.
💡 My Motto:
"Capital management, discipline, and consistency in your trading edge."
A positive risk-to-reward ratio, paired with a high win rate, is the backbone of any solid trading plan 📈🔐
⚠️ Losses?
They’re part of the mathematical game of trading 🎲
They don’t define you — they’re necessary, they happen, and we move forward 📊➡️
🙏 I appreciate you taking the time to review my Daily Forecast.
Stay sharp, stay consistent, and protect your capital
— FRNGT 🚀
OANDA:AUDUSD

Bullish reevrsal off pullback support?The Aussie (AUD/USD) could fall towards the pivot and could bounce to the 1st resistance which acts as a multi swing high resistance.
Pivot: 0.6500
1st Support: 0.6486
1st Resistance: 0.6522
Disclaimer:
The above opinions given constitute general market commentary, and do not constitute the opinion or advice of IC Markets or any form of personal or investment advice.
Any opinions, news, research, analyses, prices, other information, or links to third-party sites contained on this website are provided on an "as-is" basis, are intended only to be informative, is not an advice nor a recommendation, nor research, or a record of our trading prices, or an offer of, or solicitation for a transaction in any financial instrument and thus should not be treated as such. The information provided does not involve any specific investment objectives, financial situation and needs of any specific person who may receive it. Please be aware, that past performance is not a reliable indicator of future performance and/or results. Past Performance or Forward-looking scenarios based upon the reasonable beliefs of the third-party provider are not a guarantee of future performance. Actual results may differ materially from those anticipated in forward-looking or past performance statements. IC Markets makes no representation or warranty and assumes no liability as to the accuracy or completeness of the information provided, nor any loss arising from any investment based on a recommendation, forecast or any information supplied by any third-party.

AUDUSD: Monitoring Downside MomentumDaily Timeframe:
Yesterday's session closed with a doji (inside bar). There's a lot of indecision going on. Price is maintaining below the HTL, however, the ranging bars may indicate that there's a lack of selling pressure.
If momentum does not pickup, we might see a fakeout. For the time being, I still maintain a bearish stance on the daily timeframe.
H1 Timeframe:
Price is breaking below the ATL, which is the first indication that momentum may be picking up throughout the Asian session.
Price remains choppy around the EMAs, which is a less reliable momentum signal.
However, I do think this pair has potential if price does not close back above the ATL.

AUDUSD – The Downtrend Remains DominantOn the 4H chart, AUDUSD continues to move within a descending channel that has persisted since early October. Each time price touches the upper trendline, it gets sharply rejected — showing that sellers remain firmly in control.
Currently, the pair is hovering around the 0.6480 zone, just below both the EMA34 and EMA89, which are sloping downward — confirming that the medium-term downtrend is still intact.
From a fundamental perspective, weaker-than-expected Australian employment data and growing expectations that the RBA might cut rates sooner are weighing on the Aussie. Meanwhile, the U.S. dollar is supported by rising Treasury yields — further strengthening the bearish bias.
Short-term scenario: price may rebound slightly toward the 0.6500 area (testing EMA resistance + upper trendline) before continuing its decline toward the 0.6420 target zone — which also aligns with strong technical support and the bottom of the descending channel.

AUDUSD(20251023)Today's AnalysisMarket News:
The US Senate rejected the temporary funding bill for the 12th time as the shutdown continues.
Technical Analysis:
Today's Buy/Sell Levels:
0.6491
Support and Resistance Levels:
0.6524
0.6512
0.6504
0.6478
0.6470
0.6458
Trading Strategy:
If the price breaks above 0.6491, consider a buy entry with the first target at 0.6512.
If the price breaks below 0.6478, consider a sell entry with the first target at 0.6458

AUDUSD INTRADAY (15m)AUDUSD 15m TECHNICAL SNAPSHOT
Intraday Momentum Bias: Neutral-to-bullish rebound within broader down-channel.
🔴 OVERHEAD SUPPLY / INVALIDATION
0.65100 — 🔴 Sell Limit (prior supply shelf)
0.65050 — 🔴 Take Profit (first upside magnet/previous mid)
🟢 LONG PLAN — ENTRIES & RISK
0.64900 — 🟢 Buy Stop (break above micro range)
0.64850 — 🟢 Buy Limit (pullback to structure)
0.64800 — 🟢 Buy Limit (deeper demand / last defense)
Protective idea: If long on breakout, place SL below 0.64800 (invalidates higher-low structure).
If fading the pop, sellers likely defend 0.65050–0.65100; stop a few pips above 0.6510.
🎯 UPSIDE TARGETS (if 0.6490 triggers and holds)
0.65050 — 🎯 TP1 (range high retest)
0.65100 — 🎯 TP2 (supply touch / fade zone)
✍️ STRUCTURAL NOTES
Price recovered sharply from the morning dump and is compressing under 0.6490; breakout confirms higher-low sequence.
Failure back under 0.6485 → 0.6480 puts bulls on the back foot and re-opens downside into the session lows.
🧪 STRATEGY TEMPLATES
Breakout-Continuation (Conservative)
Entry: 0.64900
TP: 0.65050 → 0.65100
SL: 0.64800
Fade-Into-Supply (Aggressive)
Entry: 0.65050–0.65100
TP: 0.64900 → 0.64850
SL: above 0.6510

AUDUSD: Short Signal Explained
AUDUSD
- Classic bearish formation
- Our team expects pullback
SUGGESTED TRADE:
Swing Trade
Short AUDUSD
Entry - 0.6494
Sl - 0.6499
Tp - 0.6485
Our Risk - 1%
Start protection of your profits from lower levels
Disclosure: I am part of Trade Nation's Influencer program and receive a monthly fee for using their TradingView charts in my analysis.
❤️ Please, support our work with like & comment! ❤️

AUDUSD - Signal#AUDUSD - Signal
H4 - Formation of the 3rd wave + breakout of the trend line. Stop behind the high of the 1st wave.
Entry: 0.64814
TP: 0.64397 - 0.63867 - 0.63540 - 0.63010
Stop: 0.65295

AUDUSD H1 | Sharp Bearish DropAussie (AUD/USD) has rejected off the sell entry which is a pullback resistance that aligns with the 61.8% Fibonacci retracement and could drop from this level to the downside.
Sell entry is at 0.6508, which is a pullback resistance that lines up with the 61.8% Fibonacci retracement.
Stop loss is at 0.6542, which is a pullback resistance that lines up with the 127.2% Fibonacci extension.
Take profit is at 0.6459, whichis a pullback support.
Stratos Markets Limited (tradu.com ):
CFDs are complex instruments and come with a high risk of losing money rapidly due to leverage. 68% of retail investor accounts lose money when trading CFDs with this provider. You should consider whether you understand how CFDs work and whether you can afford to take the high risk of losing your money.
Stratos Europe Ltd (tradu.com ):
CFDs are complex instruments and come with a high risk of losing money rapidly due to leverage. 70% of retail investor accounts lose money when trading CFDs with this provider. You should consider whether you understand how CFDs work and whether you can afford to take the high risk of losing your money.

Mid week forecast: GOLD,EURUSD,GBPUSDHello traders, this is a complete multiple timeframe analysis of this pair. We see could find significant trading opportunities as per analysis upon price action confirmation we may take this trade. Smash the like button if you find value in this analysis and drop a comment if you have any questions or let me know which pair to cover in my next analysis.

AUDUSD FRGNT Daily Forecast -Q4 | W43 | D22| Y25 |📅 Q4 | W43 | D22| Y25 |
📊 AUDUSD FRGNT Daily Forecast
🔍 Analysis Approach:
I’m applying Smart Money Concepts, focusing on:
Identifying Points of Interest on the Higher Time Frames (HTFs) 🕰️
Using those POIs to define a clear trading range 📐
Refining those zones on Lower Time Frames (LTFs) 🔎
Waiting for a Break of Structure (BoS) for confirmation ✅
This method allows me to stay precise, disciplined, and aligned with the market narrative, rather than chasing price.
💡 My Motto:
"Capital management, discipline, and consistency in your trading edge."
A positive risk-to-reward ratio, paired with a high win rate, is the backbone of any solid trading plan 📈🔐
⚠️ Losses?
They’re part of the mathematical game of trading 🎲
They don’t define you — they’re necessary, they happen, and we move forward 📊➡️
🙏 I appreciate you taking the time to review my Daily Forecast.
Stay sharp, stay consistent, and protect your capital
— FRNGT 🚀
OANDA:AUDUSD

AUDUSD FRGNT Daily Forecast -Q4 | W43 | D21| Y25 | 📅 Q4 | W43 | D21| | Y25 |
📊 AUDUSD FRGNT Daily Forecast
🔍 Analysis Approach:
I’m applying Smart Money Concepts, focusing on:
Identifying Points of Interest on the Higher Time Frames (HTFs) 🕰️
Using those POIs to define a clear trading range 📐
Refining those zones on Lower Time Frames (LTFs) 🔎
Waiting for a Break of Structure (BoS) for confirmation ✅
This method allows me to stay precise, disciplined, and aligned with the market narrative, rather than chasing price.
💡 My Motto:
"Capital management, discipline, and consistency in your trading edge."
A positive risk-to-reward ratio, paired with a high win rate, is the backbone of any solid trading plan 📈🔐
⚠️ Losses?
They’re part of the mathematical game of trading 🎲
They don’t define you — they’re necessary, they happen, and we move forward 📊➡️
🙏 I appreciate you taking the time to review my Daily Forecast.
Stay sharp, stay consistent, and protect your capital
— FRNGT 🚀
OANDA:AUDUSD

AUDUSD(20251022)Today's AnalysisMarket News:
Citigroup has turned bearish on gold prices, predicting a drop to $4,000 within the next three months.
Technical Analysis:
Today's Buy/Sell Levels:
0.6493
Support and Resistance Levels:
0.6545
0.6526
0.6513
0.6473
0.6461
0.6441
Trading Strategy:
If the price breaks above 0.6493, consider a buy entry, with the first target at 0.6513.
If the price breaks below 0.6473, consider a sell entry, with the first target at 0.6461.

AUDUSD intraday timeframe 45m
This 45-minute chart highlights a short-term opportunity on AUD/USD, structured around a disciplined entry and tight risk management. The setup is based on price consolidation followed by bullish momentum confirmation.
🔹 Entry Level: 0.64903
🔹 Stop Loss: 0.64762
🔹 Take Profit: 0.65050
🔹 Risk/Reward Ratio: 1.12
🔹 Setup Date: October 22, 2025
🔹 Timeframe: 45-minute
🟦 Risk Zone: -0.00141 | -0.28% | 1650.9
🟧 Reward Zone: +0.00147 | +0.30% | 500
This setup favors traders who prioritize precision and efficiency. The trade aligns with intraday volatility patterns and offers a realistic reward-to-risk ratio. Ideal for those monitoring price action around key psychological levels and anticipating movement ahead of the Asian session.
---

Bearish reversal off 61.8% FIbonacci resistance?AUD/USD is rising towards the resistance level, which is a pullback resistance that aligns with the 61.8% Fibonacci retracement and could reverse from this level to our take profit.
Entry: 0.6508
Why we like it:
Why we like it:
There is a pullback resistance level that lines up with the 61.8% Fibonacci retracement.
Stop loss: 0.6542
Why we like it:
There is a pullback resistance that lines up with the 127.2% Fibonacci extension.
Take profit: 0.6443
Why we like it:
There is a multi-swing low support level.
Enjoying your TradingView experience? Review us!
Please be advised that the information presented on TradingView is provided to Vantage (‘Vantage Global Limited’, ‘we’) by a third-party provider (‘Everest Fortune Group’). Please be reminded that you are solely responsible for the trading decisions on your account. There is a very high degree of risk involved in trading. Any information and/or content is intended entirely for research, educational and informational purposes only and does not constitute investment or consultation advice or investment strategy. The information is not tailored to the investment needs of any specific person and therefore does not involve a consideration of any of the investment objectives, financial situation or needs of any viewer that may receive it. Kindly also note that past performance is not a reliable indicator of future results. Actual results may differ materially from those anticipated in forward-looking or past performance statements. We assume no liability as to the accuracy or completeness of any of the information and/or content provided herein and the Company cannot be held responsible for any omission, mistake nor for any loss or damage including without limitation to any loss of profit which may arise from reliance on any information supplied by Everest Fortune Group.

AUDUSD Is ready to go UP! great buy trade opportunity. AUDUSD Is currently inside a powerful support and resistance channel. It has recently broken a trendline which acted as resistance and is now forecasted to head to the next upper trend line (resistance). This is a great buy opportunity trade ahead!

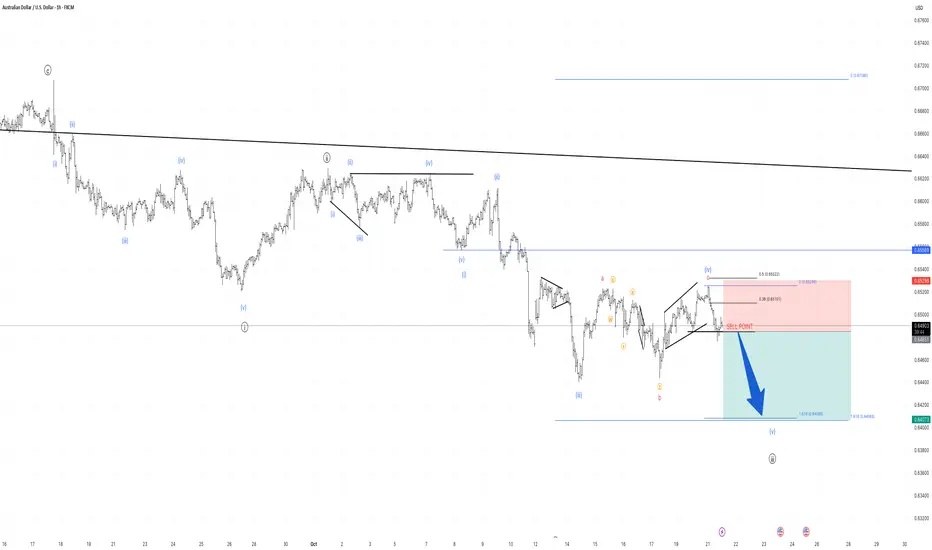
Bearish Outlook: Completion of Wave 5 Based on Elliott Wave and We're currently observing the end of Wave 3, based on Elliott Wave Principle, leading us to expect a downward shift towards Wave 5 completion. The bearish target is set at the 161.8% Fibonacci level, as measured from the height of Wave 3.
Despite a seemingly clear path to a bearish scenario, it's essential to incorporate risk management strategies and keep an eye on other contributing market factors, adjusting trade positions as necessary. Trade wisely and remember that market indicators are guides, not guaranteed predictions.
(Disclaimer: This analysis is intended for educational purposes; it's crucial to do your own research before making investment decisions.)
AUDUSD Will Go Higher! Buy!
Take a look at our analysis for AUDUSD.
Time Frame: 9h
Current Trend: Bullish
Sentiment: Oversold (based on 7-period RSI)
Forecast: Bullish
The price is testing a key support 0.648.
Current market trend & oversold RSI makes me think that buyers will push the price. I will anticipate a bullish movement at least to 0.655 level.
P.S
We determine oversold/overbought condition with RSI indicator.
When it drops below 30 - the market is considered to be oversold.
When it bounces above 70 - the market is considered to be overbought.
Like and subscribe and comment my ideas if you enjoy them!

Potential Reversal Ready To Flip AU On Its "Head"Price on OANDA:AUDUSD is almost complete with forming the Right and final Shoulder of the potential Inverted Head and Shoulders Pattern!
Once Price has visited the Neckline of the Pattern, it will be Confirmed and will suggest that Price is looking to head higher!!
Once Confirmed, we will want to wait for a Valid Breakout and a Retest to generate potential Long Opportunities to take up to the next Resistance @ .6620!
