AUDUSD FRGNT Daily Forecast - Q4 | W49| D2| Y25 |📅 Q4 | W49| D2| Y25 |
📊 AUDUSD FRGNT Daily Forecast
🔍 Analysis Approach:
I’m applying Smart Money Concepts, focusing on:
Identifying Points of Interest on the Higher Time Frames (HTFs) 🕰️
Using those POIs to define a clear trading range 📐
Refining those zones on Lower Time Frames (LTFs) 🔎
Waiting for a Break of Structure (BoS) for confirmation ✅
This method allows me to stay precise, disciplined, and aligned with the market narrative, rather than chasing price.
💡 My Motto:
"Capital management, discipline, and consistency in your trading edge."
A positive risk-to-reward ratio, paired with a high win rate, is the backbone of any solid trading plan 📈🔐
⚠️ Losses?
They’re part of the mathematical game of trading 🎲
They don’t define you — they’re necessary, they happen, and we move forward 📊➡️
🙏 I appreciate you taking the time to review my Daily Forecast.
Stay sharp, stay consistent, and protect your capital
— FRNGT 🚀
FX:AUDUSD
Audusdanalysis

AUDUSD Has Potential to Strengthen Amidst Dollar WeakeningThe Australian Dollar/US Dollar (AUD/USD) pair started the week quietly, trading below the mid-0.6500s (near a two-week high). Despite disappointing Chinese economic data, the positive bias on AUD/USD remains strong.
✅ Weak Chinese Data and Its Impact
Manufacturing PMI: Remained below 50.0 (contraction territory) for the eighth consecutive month in November.
- Non-Manufacturing PMI: Dropped to 49.5, marking the first contraction in nearly three years (lowest since December 2022).
- Market Reaction: Despite this poor data, the immediate market reaction was short-lived. Support came from:
- Easing US-China trade tensions.
Recently announced Chinese government measures to boost consumption.
✅ Support from the Australian Dollar (AUD)
RBA Hawkishness: Diminishing odds for further policy easing by the Reserve Bank of Australia (RBA) acted as a tailwind for the AUD.
✅ US Dollar (USD) Weakening
- Dovish Fed Expectations: The USD Index (DXY) languished near a two-week low amid growing acceptance that the Federal Reserve (The Fed) will lower borrowing costs again this month.
- Risk-On Market Sentiment: Underlying bullish sentiment in financial markets weakened the safe-haven US Dollar, which benefited the riskier AUD/USD pair.
✅ Technical Analysis and Outlook
- Bullish Signal: Friday's breakout through the 100-day Simple Moving Average (SMA) supports the case for further near-term appreciation.
- Cautionary Stance: Traders are reluctant to place aggressive bets and are opting to await the release of the US ISM Manufacturing PMI today and other key US macro data this week.

AUD/USD Extends Uptrend as Market Sentiment Turns BullishMarket Analysis: AUD/USD Extends Uptrend as Market Sentiment Turns Bullish
AUD/USD started a fresh increase above 0.6500 and 0.6520.
Important Takeaways for AUD USD Analysis Today
- The Aussie Dollar started a decent increase above 0.6500 against the US Dollar.
- There is a short-term contracting triangle forming with support at 0.6540 on the hourly chart of AUD/USD.
AUD/USD Technical Analysis
On the hourly chart of AUD/USD, the pair started a fresh increase from 0.6420. The Aussie Dollar was able to clear 0.6500 to move into a positive zone against the US Dollar.
There was a close above 0.6520 and the 50-hour simple moving average. Finally, the pair tested 0.6560. A high was formed near 0.6559 and the pair recently started a short-term downside correction. There was a minor decline below 0.6550.
On the downside, initial support is near a short-term contracting triangle at 0.6540 and the 50-hour simple moving average. The next area of interest could be 0.6520. If there is a downside break below 0.6520, the pair could extend its decline toward the 0.6490 zone and the 50% Fib retracement level of the upward move from the 0.6421 swing low to the 0.6559 high.
Any more losses might signal a move toward 0.6475 and the 61.8% Fib retracement. On the upside, the AUD/USD chart indicates that the pair is now facing resistance near 0.6560.
The first major hurdle for the bulls might be 0.6580. An upside break above 0.6580 might send the pair further higher. The next stop is near 0.6620. Any more gains could clear the path for a move toward 0.6650.
This article represents the opinion of the Companies operating under the FXOpen brand only. It is not to be construed as an offer, solicitation, or recommendation with respect to products and services provided by the Companies operating under the FXOpen brand, nor is it to be considered financial advice.

AUDUSD: Wait Until The Pullback Ends Before Selling!Welcome back to the Weekly Forex Forecast for the week of Dec. 1-5th.
In this video, we will analyze the following FX market: AUDUSD
AUDUSD had a surprisingly strong week. The weekly candle closed above the previous candle. This would indicate some follow through towards last week's high.
But... it is in a pullback on the HTFs, and could turn over mid to late week, towards the downside.
Wait for the market structure shift before entering new trades.
I'm sticking with the overall trend down until the market shifts the other way.
Enjoy!
May profits be upon you.
Leave any questions or comments in the comment section.
I appreciate any feedback from my viewers!
Like and/or subscribe if you want more accurate analysis.
Thank you so much!
Disclaimer:
I do not provide personal investment advice and I am not a qualified licensed investment advisor.
All information found here, including any ideas, opinions, views, predictions, forecasts, commentaries, suggestions, expressed or implied herein, are for informational, entertainment or educational purposes only and should not be construed as personal investment advice. While the information provided is believed to be accurate, it may include errors or inaccuracies.
I will not and cannot be held liable for any actions you take as a result of anything you read here.
Conduct your own due diligence, or consult a licensed financial advisor or broker before making any and all investment decisions. Any investments, trades, speculations, or decisions made on the basis of any information found on this channel, expressed or implied herein, are committed at your own risk, financial or otherwise.

AUDUSD FRGNT WEEKLY FORECAST -Q4 | W49 | Y25 |📅 Q4 | W49 | Y25 |
📊 AUDUSD FRGNT WEEKLY FORECAST
🔍 Analysis Approach:
I’m applying Smart Money Concepts, focusing on:
Identifying Points of Interest on the Higher Time Frames (HTFs) 🕰️
Using those POIs to define a clear trading range 📐
Refining those zones on Lower Time Frames (LTFs) 🔎
Waiting for a Break of Structure (BoS) for confirmation ✅
This method allows me to stay precise, disciplined, and aligned with the market narrative, rather than chasing price.
💡 My Motto:
"Capital management, discipline, and consistency in your trading edge."
A positive risk-to-reward ratio, paired with a high win rate, is the backbone of any solid trading plan 📈🔐
⚠️ Losses?
They’re part of the mathematical game of trading 🎲
They don’t define you — they’re necessary, they happen, and we move forward 📊➡️
🙏 I appreciate you taking the time to review my Daily Forecast.
Stay sharp, stay consistent, and protect your capital
— FRNGT 🚀
FX:AUDUSD

AUDUSD Bearish Bias!
HI,Traders !
#AUDUSD is making a
Retest of the horizontal
Resistance of 0.64759
So as we are locally
Bearish biased we will
Be expecting a further
Bearish move down !
Comment and subscribe to help us grow !

AUD/USD – Fundamentals Driving Downtrend | 24.11.2025Bearish Channel + Rate-Cut Expectation Pressure = Downside Continuation Setup
🔍 Technical Setup
AUD/USD continues to trade inside a falling channel, respecting the trendline resistance (multiple rejections marked). Price is currently moving toward the resistance zone, offering a potential sell-on-retest opportunity before further downside.
📌 Bias remains bearish as long as price stays below the channel resistance + Ichimoku cloud.
🎯 Trading Plan :
📌 Targets (Support Levels):
1st Support: 0.64130
2nd Support: 0.63912
📌 Invalidation / Risk:
A breakout above 0.6480 would reduce bearish bias.
⚠️ Today’s Fundamental Drivers :
1️⃣ Rate-cut expectations surged:
Markets now price 69% chance of a December rate cut, up from 44% last week → weakens AUD.
2️⃣ New York Fed statement shook sentiment:
Fed official highlighted weak job market as a bigger risk than high inflation, increasing probability of monetary easing → USD firming vs risk currencies like AUD.
➡️ When fundamentals + technical trend align, continuation move is likely.
AUDUSD analysis, AUD/USD forecast, AUDUSD sell setup, Forex signals, Australian dollar outlook, Rate cut impact on forex, AUD technical analysis, price action strategy
⚠️ Disclaimer
This chart is for educational purposes only — not financial advice.
Always manage risk and follow your own trading plan.
❤️ Support the Analysis
If you found this helpful — LIKE 👍 & COMMENT 💬
Your support motivates more daily high-quality chart setups!

AUDUSD Idea 23.11.2025For audusd I am approaching the set sfp level which could probably be at a price of 0.64, then I would put a possible long below the next low that the market gives us or at least a local low, if I were to consider a short then at a level around the monthly level at a price of 0.663 where the price could be surprised but I would wait for a reaction at a level around the golden pocket level of 0.660

AUDUSD FRGNT Daily Forecast -Q4 | W47| D21 | Y25 |📅 Q4 | W47| D21 | Y25 |
📊 AUDUSD FRGNT Daily Forecast
🔍 Analysis Approach:
I’m applying Smart Money Concepts, focusing on:
Identifying Points of Interest on the Higher Time Frames (HTFs) 🕰️
Using those POIs to define a clear trading range 📐
Refining those zones on Lower Time Frames (LTFs) 🔎
Waiting for a Break of Structure (BoS) for confirmation ✅
This method allows me to stay precise, disciplined, and aligned with the market narrative, rather than chasing price.
💡 My Motto:
"Capital management, discipline, and consistency in your trading edge."
A positive risk-to-reward ratio, paired with a high win rate, is the backbone of any solid trading plan 📈🔐
⚠️ Losses?
They’re part of the mathematical game of trading 🎲
They don’t define you — they’re necessary, they happen, and we move forward 📊➡️
🙏 I appreciate you taking the time to review my Daily Forecast.
Stay sharp, stay consistent, and protect your capital
— FRNGT 🚀
OANDA:AUDUSD

AUDUSD FRGNT Daily Forecast -Q4 | W47| D20 | Y25 |📅 Q4 | W47| D20 | Y25 |
📊 AUDUSD FRGNT Daily Forecast
🔍 Analysis Approach:
I’m applying Smart Money Concepts, focusing on:
Identifying Points of Interest on the Higher Time Frames (HTFs) 🕰️
Using those POIs to define a clear trading range 📐
Refining those zones on Lower Time Frames (LTFs) 🔎
Waiting for a Break of Structure (BoS) for confirmation ✅
This method allows me to stay precise, disciplined, and aligned with the market narrative, rather than chasing price.
💡 My Motto:
"Capital management, discipline, and consistency in your trading edge."
A positive risk-to-reward ratio, paired with a high win rate, is the backbone of any solid trading plan 📈🔐
⚠️ Losses?
They’re part of the mathematical game of trading 🎲
They don’t define you — they’re necessary, they happen, and we move forward 📊➡️
🙏 I appreciate you taking the time to review my Daily Forecast.
Stay sharp, stay consistent, and protect your capital
— FRNGT 🚀
OANDA:AUDUSD

AUD/USD – Bearish Breakout Signal Triggered AUD/USD – Bearish Breakout Signal Triggered (79% Backtest Probability)
A fresh SELL signal has been generated on AUD/USD, driven by a confirmed Breakout pattern on the current timeframe.
This setup aligns strongly with our automated trend-following model and carries a 79% historical backtest probability, indicating a high-quality bearish continuation opportunity.
🔍 Technical Breakdown
The price structure on AUD/USD is currently reflecting:
1. Bearish Breakout Structure
The pair recently pushed through a minor intraday structure, forming a lower high — a classic precursor to bearish continuation.
The breakout reflects rejection of upper liquidity, signaling sellers stepping in with control.
2. Trend Alignment
Our trend-following model confirms that:
The pair is trading below key dynamic levels.
Momentum indicators show downside pressure building.
The breakout pattern is clean and free from noise, improving its reliability.
This confluence increases the confidence that the downside move may continue.
🌍 Market Context & Macro Influence
Dollar strength continues to weigh heavily on AUD/USD, as:
Risk sentiment remains fragile
Interest rate differentials favor USD
Recent macro data prints support a stronger dollar outlook
AUD continues to show weakness due to commodity softness and cautious global sentiment
In short, the macro backdrop supports the bearish technical structure currently forming on the chart.
📌 Key Technical Levels to Watch
Immediate Resistance: 0.65297
Sellers are expected to defend this zone aggressively.
Immediate Support: 0.64907
A clean break below this region may accelerate bearish momentum.
Major Resistance: 0.65753
A strong structural ceiling — bullish invalidation sits above this level.
Major Support: 0.64451
The next major liquidity target for sellers if the present breakout expands.
🎯 Trade Parameters (Based on 0.10 Lot Size)
Parameter Level
Entry 0.65102
Stop Loss (SL) 0.65302
Take Profit (TP) 0.64702
Risk $50
Potential Profit $100
R:R Ratio 1 : 2
This structure offers a clean, mechanical setup with well-defined risk boundaries.
🛡 Risk Management Notes
Professional-grade risk practices include:
Never risk more than 1–2% of total capital per trade
Consider scaling into the position if price retests the breakout zone
Use a trailing stop after price moves in your favor
Avoid holding during high-impact USD or AUD economic events
Ensure proper position sizing based on your account balance
If volatility expands, consider partial profit-taking
Breakout trades can accelerate quickly — staying disciplined is essential.
📌 Final Thoughts
AUD/USD currently presents a high-probability bearish continuation setup, supported by both technical structure and macro context.
With backtested performance at 79%, clear levels, and defined risk, this opportunity fits well within professional trend-following models.
Traders should monitor price behavior near support at 0.64907 — a breakdown from this region may trigger the next wave of selling pressure toward 0.64702 and beyond.

AUDUSD FRGNT Daily Forecast - Q4 | W47| D18 | Y25 |📅 Q4 | W47| D18 | Y25 |
📊 AUDUSD FRGNT Daily Forecast
🔍 Analysis Approach:
I’m applying Smart Money Concepts, focusing on:
Identifying Points of Interest on the Higher Time Frames (HTFs) 🕰️
Using those POIs to define a clear trading range 📐
Refining those zones on Lower Time Frames (LTFs) 🔎
Waiting for a Break of Structure (BoS) for confirmation ✅
This method allows me to stay precise, disciplined, and aligned with the market narrative, rather than chasing price.
💡 My Motto:
"Capital management, discipline, and consistency in your trading edge."
A positive risk-to-reward ratio, paired with a high win rate, is the backbone of any solid trading plan 📈🔐
⚠️ Losses?
They’re part of the mathematical game of trading 🎲
They don’t define you — they’re necessary, they happen, and we move forward 📊➡️
🙏 I appreciate you taking the time to review my Daily Forecast.
Stay sharp, stay consistent, and protect your capital
— FRNGT 🚀
OANDA:AUDUSD

AUD/USD Holds Ground as Markets Watch Fresh UpsideMarket Analysis: AUD/USD Holds Ground as Markets Watch Fresh Upside
AUD/USD started a fresh increase above 0.6500 and 0.6550.
Important Takeaways for AUD USD Analysis Today
- The Aussie Dollar started a decent increase above 0.6500 against the US Dollar.
- There is a key bullish trend line forming with support at 0.6510 on the hourly chart of AUD/USD.
AUD/USD Technical Analysis
On the hourly chart of AUD/USD, the pair started a fresh increase from 0.6500. The Aussie Dollar was able to clear 0.6550 to move into a positive zone against the US Dollar.
There was a close above 0.6500 and the 50-hour simple moving average. Finally, the pair tested 0.6580. A high was formed near 0.6580 and the pair recently started a short-term downside correction. There was a minor decline below 0.6550.
There was a move below the 50% Fib retracement level of the upward move from the 0.6463 swing low to the 0.6580 high. On the downside, initial support is near a key bullish trend line at 0.6510 and the 61.8% Fib retracement.
The next area of interest could be 0.6490. If there is a downside break below 0.6490, the pair could extend its decline toward the 0.6465 zone. Any more losses might signal a move toward 0.6420.
On the upside, the AUD/USD chart indicates that the pair is now facing resistance near 0.6540 and the 50-hour simple moving average. The first major hurdle for the bulls might be 0.6550. An upside break above 0.6550 might send the pair further higher. The next stop is near 0.6580. Any more gains could clear the path for a move toward 0.6620.
This article represents the opinion of the Companies operating under the FXOpen brand only. It is not to be construed as an offer, solicitation, or recommendation with respect to products and services provided by the Companies operating under the FXOpen brand, nor is it to be considered financial advice.

AudUsd Next Move In This Chart Showing
Red Horizantal Lines = Strong Support
Blue Diagonal Line = Trendline support
Best Trade: Sell Setup ( High Probability )
Aud Usd Chart Showing A Downtrend So The Sell Side Is Stronger.
Sell Entry
Enter a SELL only when the blue trendline breaks:
A candle closes below the trendline
Then wait for a retest
Enter at the retest of the trendline from below
This gives the safest entry.
Stop Loss (SL)
Place SL above the broken trendline
→ Usually 50–100 pips on M1.
Take Profit (TP)
TP1: nearest swing low
TP2: next support zone
TP3: last liquidity area lower on the chart
On M1, typical targets:
TP1 = 100–150 pips
TP2 = 200–300 pips
2. BUY Setup (Low Probability)
A buy is only valid if price breaks the red resistance line.
Buy Entry
Candle closes above the red line
Then wait for a retest
Enter BUY on the retest
Stop Loss:
Below the red line (50–100 pips)
Take Profit:
TP1 — previous high
TP2 — next resistance
TP3 — liquidity above the last high
Buy Sell Your Own Research
For More Updates Stay Alert

AUDUSD Forming Bullish MomentumAUD/USD is currently showing signs of a constructive base around the 0.6450–0.6500 area, suggesting that buyers are stepping in around this key support zone. The pair has held this level multiple times, and the recent price action indicates a potential build-up for a bullish rebound. If momentum continues to shift, we could see a move towards the 0.6700 region, given enough follow-through and strength from macro drivers.
Fundamentally, the outlook for the Australian dollar remains mixed but tilted slightly in favor of the Aussie over the medium term. The Reserve Bank of Australia (RBA) has kept its interest rate at 3.6%, signaling that further rate cuts are not imminent, especially with inflation lingering near the upper end of its 2–3% target. ( ) At the same time, global risks — including trade uncertainty — continue to weigh. The RBA’s forecasts show modest GDP growth heading into 2026, with private demand expected to strengthen as real household incomes recover.
Commodity prices remain a tailwind for AUD, as Australia is a major exporter of iron ore, coal, and other raw materials. Elevated commodity demand, combined with a moderate interest rate differential versus the U.S., could provide support for AUD strength. That said, downside risks persist: the RBA faces a delicate balance between controlling inflation and supporting growth, and any unexpected deterioration in global trade could pressure the currency.

AUDUSD FRGNT Daily Forecast -Q4 | W46 | D14 | Y25 |📅 Q4 | W46 | D14 | Y25 |
📊 AUDUSD FRGNT Daily Forecast
FRGNT FUN COUPON FRIDAY
🔍 Analysis Approach:
I’m applying Smart Money Concepts, focusing on:
Identifying Points of Interest on the Higher Time Frames (HTFs) 🕰️
Using those POIs to define a clear trading range 📐
Refining those zones on Lower Time Frames (LTFs) 🔎
Waiting for a Break of Structure (BoS) for confirmation ✅
This method allows me to stay precise, disciplined, and aligned with the market narrative, rather than chasing price.
💡 My Motto:
"Capital management, discipline, and consistency in your trading edge."
A positive risk-to-reward ratio, paired with a high win rate, is the backbone of any solid trading plan 📈🔐
⚠️ Losses?
They’re part of the mathematical game of trading 🎲
They don’t define you — they’re necessary, they happen, and we move forward 📊➡️
🙏 I appreciate you taking the time to review my Daily Forecast.
Stay sharp, stay consistent, and protect your capital
— FRNGT 🚀
OANDA:AUDUSD

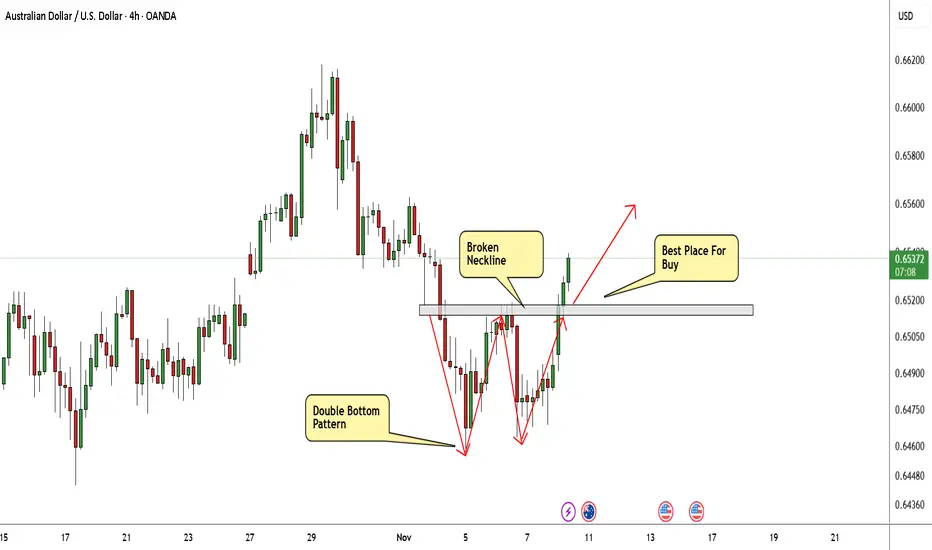
AUD/USD Made Clear Reversal Pattern,Long Setup To Get 150 Pips !Here is my 4H Chart On AUD/USD , The price creating a very clear reversal pattern ( Double Bottom Reversal Pattern ) and the price made a very good bullish price action now And the price confirmed the pattern by closing above the neckline. so we can enter a buy trade when the price go back to retest the broken neckline to can use a small stop loss , or we can enter now if you are aggressive trader but the stop loss will be bigger , and we can targeting from 50 to 100 pips with a decent stop loss .
Reasons To Enter :
1- Perfect Touch For The Area .
2- Clear Bullish Price Action .
3- Bigger T.F Giving Good Bullish P.A .
4- Clear Reversal Pattern .
5- Pattern Confirmed .
AUDUSD FRGNT Daily Forecast & Full Pre LDN Open Breakdown Q4 W46📅 Q4 | W46 | D13 | Y25 |
📊 AUDUSD FRGNT Daily Forecast & Full Pre LDN Open Breakdown
🔍 Analysis Approach:
I’m applying Smart Money Concepts, focusing on:
Identifying Points of Interest on the Higher Time Frames (HTFs) 🕰️
Using those POIs to define a clear trading range 📐
Refining those zones on Lower Time Frames (LTFs) 🔎
Waiting for a Break of Structure (BoS) for confirmation ✅
This method allows me to stay precise, disciplined, and aligned with the market narrative, rather than chasing price.
💡 My Motto:
"Capital management, discipline, and consistency in your trading edge."
A positive risk-to-reward ratio, paired with a high win rate, is the backbone of any solid trading plan 📈🔐
⚠️ Losses?
They’re part of the mathematical game of trading 🎲
They don’t define you — they’re necessary, they happen, and we move forward 📊➡️
🙏 I appreciate you taking the time to review my Daily Forecast.
Stay sharp, stay consistent, and protect your capital
— FRNGT 🚀
OANDA:AUDUSD

AUDUSD FRGNT Daily Forecast - Q4 | W46 | D13 | Y25 |📅 Q4 | W46 | D13 | Y25 |
📊 AUDUSD FRGNT Daily Forecast & Full Pre LDN Open Breakdown
🔍 Analysis Approach:
I’m applying Smart Money Concepts, focusing on:
Identifying Points of Interest on the Higher Time Frames (HTFs) 🕰️
Using those POIs to define a clear trading range 📐
Refining those zones on Lower Time Frames (LTFs) 🔎
Waiting for a Break of Structure (BoS) for confirmation ✅
This method allows me to stay precise, disciplined, and aligned with the market narrative, rather than chasing price.
💡 My Motto:
"Capital management, discipline, and consistency in your trading edge."
A positive risk-to-reward ratio, paired with a high win rate, is the backbone of any solid trading plan 📈🔐
⚠️ Losses?
They’re part of the mathematical game of trading 🎲
They don’t define you — they’re necessary, they happen, and we move forward 📊➡️
🙏 I appreciate you taking the time to review my Daily Forecast.
Stay sharp, stay consistent, and protect your capital
— FRNGT 🚀
OANDA:AUDUSD

AUDUSD FRGNT Daily Forecast & Breakdown - Q4 | W46 | D11 | Y25 |📅 Q4 | W46 | D11 | Y25 |
📊 AUDUSD FRGNT Daily Forecast
🔍 Analysis Approach:
I’m applying Smart Money Concepts, focusing on:
Identifying Points of Interest on the Higher Time Frames (HTFs) 🕰️
Using those POIs to define a clear trading range 📐
Refining those zones on Lower Time Frames (LTFs) 🔎
Waiting for a Break of Structure (BoS) for confirmation ✅
This method allows me to stay precise, disciplined, and aligned with the market narrative, rather than chasing price.
💡 My Motto:
"Capital management, discipline, and consistency in your trading edge."
A positive risk-to-reward ratio, paired with a high win rate, is the backbone of any solid trading plan 📈🔐
⚠️ Losses?
They’re part of the mathematical game of trading 🎲
They don’t define you — they’re necessary, they happen, and we move forward 📊➡️
🙏 I appreciate you taking the time to review my Daily Forecast.
Stay sharp, stay consistent, and protect your capital
— FRNGT 🚀

AUDUSD FRGNT Daily Forecast - Q4 | W46 | D11 | Y25 |📅 Q4 | W46 | D11 | Y25 |
📊 AUDUSD FRGNT Daily Forecast
🔍 Analysis Approach:
I’m applying Smart Money Concepts, focusing on:
Identifying Points of Interest on the Higher Time Frames (HTFs) 🕰️
Using those POIs to define a clear trading range 📐
Refining those zones on Lower Time Frames (LTFs) 🔎
Waiting for a Break of Structure (BoS) for confirmation ✅
This method allows me to stay precise, disciplined, and aligned with the market narrative, rather than chasing price.
💡 My Motto:
"Capital management, discipline, and consistency in your trading edge."
A positive risk-to-reward ratio, paired with a high win rate, is the backbone of any solid trading plan 📈🔐
⚠️ Losses?
They’re part of the mathematical game of trading 🎲
They don’t define you — they’re necessary, they happen, and we move forward 📊➡️
🙏 I appreciate you taking the time to review my Daily Forecast.
Stay sharp, stay consistent, and protect your capital
— FRNGT 🚀
OANDA:AUDUSD

AUDUSD FRGNT Daily Forecast 3% BREAKDOWN & PROFIT TAKE LIVE -Q4 📅 Q4 | W46 | D10 | Y25 |
📊 AUDUSD FRGNT Daily Forecast 3% BREAKDOWN & PROFIT TAKE LIVE
🔍 Analysis Approach:
I’m applying Smart Money Concepts, focusing on:
Identifying Points of Interest on the Higher Time Frames (HTFs) 🕰️
Using those POIs to define a clear trading range 📐
Refining those zones on Lower Time Frames (LTFs) 🔎
Waiting for a Break of Structure (BoS) for confirmation ✅
This method allows me to stay precise, disciplined, and aligned with the market narrative, rather than chasing price.
💡 My Motto:
"Capital management, discipline, and consistency in your trading edge."
A positive risk-to-reward ratio, paired with a high win rate, is the backbone of any solid trading plan 📈🔐
⚠️ Losses?
They’re part of the mathematical game of trading 🎲
They don’t define you — they’re necessary, they happen, and we move forward 📊➡️
🙏 I appreciate you taking the time to review my Daily Forecast.
Stay sharp, stay consistent, and protect your capital
— FRNGT 🚀
OANDA:AUDUSD

AUDUSD FRGNT Daily Forecast 3% BREAKDOWN ! -Q4 | W46 | D10 | Y25📅 Q4 | W46 | D10 | Y25 |
📊 AUDUSD FRGNT Daily Forecast 3% BREAKDOWN !
🔍 Analysis Approach:
I’m applying Smart Money Concepts, focusing on:
Identifying Points of Interest on the Higher Time Frames (HTFs) 🕰️
Using those POIs to define a clear trading range 📐
Refining those zones on Lower Time Frames (LTFs) 🔎
Waiting for a Break of Structure (BoS) for confirmation ✅
This method allows me to stay precise, disciplined, and aligned with the market narrative, rather than chasing price.
💡 My Motto:
"Capital management, discipline, and consistency in your trading edge."
A positive risk-to-reward ratio, paired with a high win rate, is the backbone of any solid trading plan 📈🔐
⚠️ Losses?
They’re part of the mathematical game of trading 🎲
They don’t define you — they’re necessary, they happen, and we move forward 📊➡️
🙏 I appreciate you taking the time to review my Daily Forecast.
Stay sharp, stay consistent, and protect your capital
— FRNGT 🚀
OANDA:AUDUSD
