AUDUSD rally hangs on China stimulus or Head & ShouldersThe Australian dollar was a top performer on Thursday, surging to test the 0.6700 resistance despite a rising US dollar. But the Aussie is now at a critical technical junction. Is this a move that could be fuelled by China's new stimulus and record gold prices, or are we forming the right shoulder of a dangerous H&S pattern?
We analyse the tailwinds lifting the AUD against the bearish technical risk of a head and shoulders formation on the daily chart. We map out the key levels at 0.6727 and 0.6660 that will decide the next major move.
Key topics:
China stimulus & commodities: The PBOC's decision to cut policy rates on January 19 is a direct boost for Australia's economy, while gold ($4,600) and silver (nearing triple digits) provide more support.
Danger zone: The rally faces resistance at 0.6727 (the previous corrective peak). A failure here could confirm the right shoulder of a head and shoulders pattern, risking a drop to 0.6660 and 0.6592.
Bullish breakout: If momentum clears 0.6727, the bearish structure would be invalidated. This would likely confirm a double bottom or (running) triangle breakout targeting multi-year highs at 0.6766.
Trade scenarios:
Bearish : Rejection at 0.6700/0.6727 + Break below 0.6660 = Head and Shoulders confirmation.
Bullish : Hold above 0.6660 + Break above 0.6727 = Triangle/Double Bottom breakout to 0.6766+.
Are you betting on the China stimulus breakout or fading the resistance at 0.67? Let us know in the comments!
This content is not directed to residents of the EU or UK. Any opinions, news, research, analyses, prices or other information contained on this website is provided as general market commentary and does not constitute investment advice. ThinkMarkets will not accept liability for any loss or damage including, without limitation, to any loss of profit which may arise directly or indirectly from use of or reliance on such information.
Aussie

AUD/USD | Weekly Outlook – Reversal Setup Forming from HTF SweepAUD/USD is showing early signs of a potential reversal on the higher timeframe, in alignment with broader USD strength.
We can see a clear sweep of buyside liquidity, followed by a potential shift in structure, hinting at short-term exhaustion on the upside.
Price is now positioned near a weekly order block, which aligns closely with a weekly fair value gap (FVG) just above it.
This confluence forms a key point of interest (POI) — an area where reactions may develop if bearish momentum continues to hold.
For the week ahead, the focus remains on how price behaves around this high-timeframe zone, particularly if USD momentum remains strong.
Disclaimer: This analysis is for educational purposes only and does not constitute financial advice. Always do your own research (DYOR) before trading.

AUDUSD at 15-month high: Breakout or wedge trap?In today's video, we break down why the Australian dollar rallied to a 15-month high at 0.6767 despite a drop in Australian inflation to 3.4%. We analyse the confusing mix of fundamentals—including a hawkish RBA, surging iron ore prices on China stimulus hopes, and a broadly weaker US dollar—against rising geopolitical tensions following China's dual-use export ban to Japan.
Technically, the Aussie is forming a potential rising wedge pattern with double RSI divergence. We explain why 0.6700 is the critical line in the sand: holding it keeps the bullish "buy the dip" scenario alive, while a break below could trigger a correction toward the 0.6590 Fibonacci cluster. Watch to see if we get a Head and Shoulders top or a continuation into 2026.
Key drivers:
Inflation vs. RBA : Why a 35% chance of a February hike remains despite cooling CPI.
China stimulus :How PBOC liquidity plans are driving iron ore to 4-month highs.
Technical analysis : Mapping the "spinning top" candle, RSI divergence, and the critical 0.6700 support level.
Trade scenarios : Bullish continuation vs. bearish reversal targets at 0.6634 and 0.6593.
Are you buying the dip at 0.67 or fading the rally? Let us know in the comments!
This content is not directed to residents of the EU or UK. Any opinions, news, research, analyses, prices or other information contained on this website is provided as general market commentary and does not constitute investment advice. ThinkMarkets will not accept liability for any loss or damage including, without limitation, to any loss of profit which may arise directly or indirectly from use of or reliance on such information.

EURAUD LONGS AT DEMAND - H4EURAUD longs in play at a H4 demand post a liquidity sweep. Clean setup with 8:1 RR

Aussie: Double Scenario!Hello everyone!
This is the double Scenario for AUDUSD!
Any Breaks over the 0.6700 Zone, Is a sign of more powerful buyers!
Any breaks below the 0.6600 zone means sellers will take control till 0.6450!
My general bias is a little more bullish than bearish!

AUDUSD moves sideways after the RBA holds rates steady
The RBA turned hawkish after holding the rate at 3.60%. The central bank acknowledged that inflation risks have increased despite three rate cuts since Feb, noting that recovering demand and rising wages are making it more difficult to return inflation to the target.
Governor Bullock emphasized that the RBA remains focused on inflation and signaled that, if price pressures persist, the bank may need to take appropriate action.
With policy divergence widening between the Fed and the RBA, the aussie dollar may continue to appreciate against the US dollar.
AUDUSD slightly broke below the ascending channel's lower bound before consolidating within the range of 0.6620–0.6650. The price remains above bullish EMAs, indicating a potential uptrend extension.
If AUDUSD reenters the ascending channel, the price may retest the following resistance at 0.6650.
Conversely, if AUDUSD breaks below EMA21 and the support at 0.6620, the price may retreat toward the next support at 0.6580.

How I Spot Trading Opportunity?Today, I will share the trading aspect—specifically how we can quickly spot opportunities using a simple structure.
During a studio interview earlier this week, I was asked about my preference between investing and trading.
I answered promptly: if both work, why limit myself to only one? I enjoy both trading and investing.
Similarly, I often receive question which market is the best for trading?
If you already have a trading methodology that you’re confident in, why restrict yourself to just one market or product? Cast the net as wide, applying the same trading concept across different markets to narrow down the best trade for the day.
Australia Dollar
Ticker: 6A
Minimum fluctuation:
0.00005 per AUD increment = $5.00
Disclaimer:
• What presented here is not a recommendation, please consult your licensed broker.
• Our mission is to create lateral thinking skills for every investor and trader, knowing when to take a calculated risk with market uncertainty and a bolder risk when opportunity arises.
CME Real-time Market Data help identify trading set-ups in real-time and express my market views. If you have futures in your trading portfolio, you can check out on CME Group data plans available that suit your trading needs www.tradingview.com

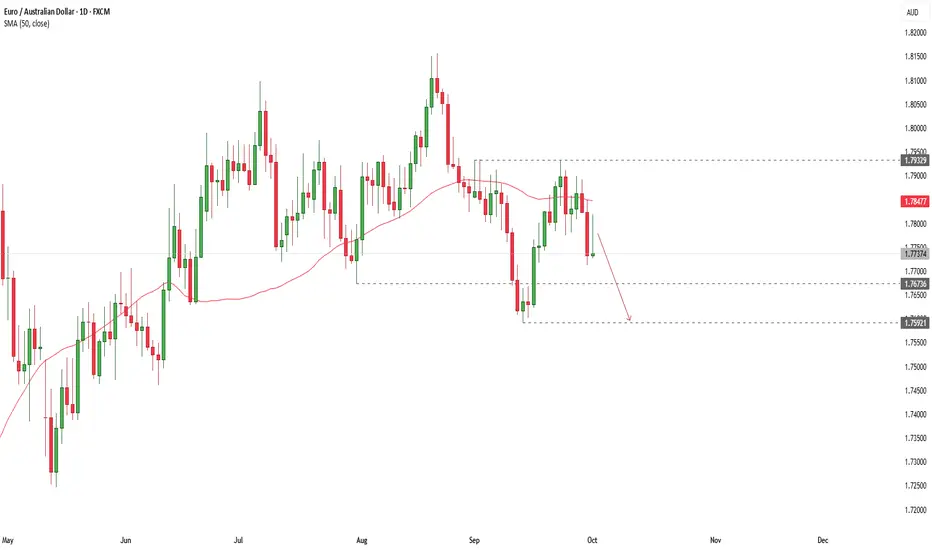
EURAUD: Short After Break!Next week we are going to have important news for AUSSIE. If it aligns with our analysis, we will short the pair after breaking below the PURPLE level of 1.7550!
Regarding the EQUAL daily levels, we have seen a great reaction and wait for more bearish moves!
This is a great ZONE we are facing now!
We see that the last bearish move was considerably STRONG!
We expect a break below the zone; I'll put my orders then!

Aussie Resumes Its RecoveryAussie came nicely to the downside in the last few months with clearly three waves down from the highs, so apparently this was a correction, a completed one, after a very nice rebound from the 0.6420 area, from where we can now see impulsive move that broke the trendline and even coming back above the previous triangle swing resistance. This certainly looks like a turning point, and ideally it will take us even higher after some new retracement, so watch out for more upside while the market trades above the November lows.
Even on the daily chart you can clearly see some very choppy and messy price action for the last few months, so sooner or later we think that bulls are ready to hit new highs,, and maybe we are now at the beginning of this thrid wave up; C or 3.

Dollar sinks as Hassett odds surge | FX ResearchThe dollar index is sliding to its weakest level since late October as markets increasingly price in Kevin Hasset, now seen with roughly 85 percent odds as the next Fed chair following President Trump’s public signaling, a development expected to weigh on the dollar, steepen the curve, and support risk assets.
Aussie dollar is also pushing higher after RBA Governor Bullock struck a hawkish tone, warning that firming inflation pressures may require a policy response even as Australia’s softer than expected Q3 GDP headline masks stronger domestic demand and a sharp rebound in business investment. Swiss inflation surprised slightly to the downside, with core CPI at its lowest since 2021, though the data is unlikely to shift SNB policy expectations.
Ahead today, US markets turn to the ADP employment report and ISM services for directional cues, while comments from ECB President Lagarde and the BOE’s Mann will round out the central bank narrative.
Exclusive FX research from LMAX Group Market Strategist, Joel Kruger

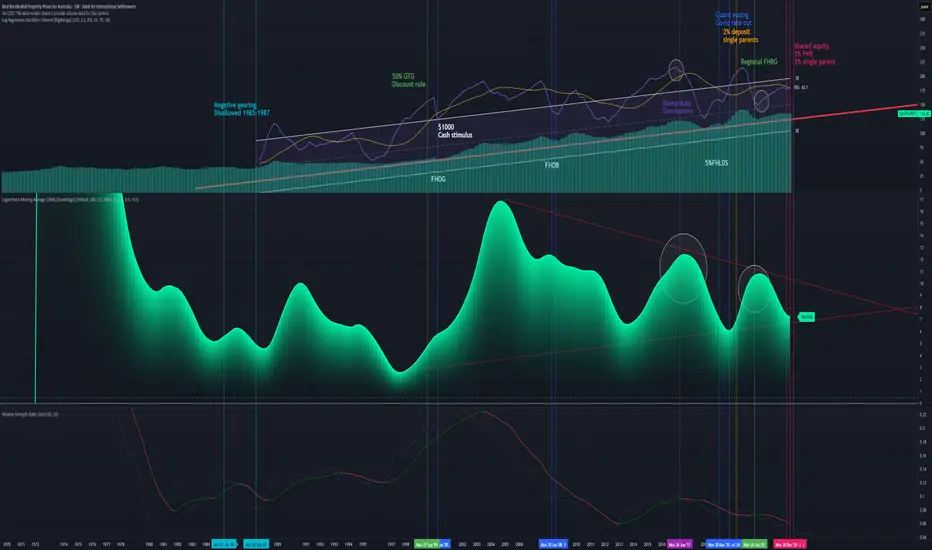
Bearish divergence, bigger number not always better for housingFull disclosure I got Ai to compose this because I'm dyslexic and a scatter brain.
and this is a duplicate because I tried to delete it once I found out it scaled bad on mobile, and trading views delete function MIA! ( within the cool down ) go figure.
I definitely have a bias to btc and maybe a long position on the JPY. Have a read have a look.
I have loosely marked some economic data on here showing Policy might not be working well enough because wages didn't keep up with CPI causing a real value losses after 2022.
I have supplied the ratio chart for gold as a indicator at the top.
Structural Policy Drivers (The Cause of the Bull Trend)
These points explain why the long-term trend line (the logarithmic regression) slopes upward:
1. The Foundation of Investment (1999): The introduction of the 50% Capital Gains Tax (CGT) Discount in September 1999 was the single most powerful structural stimulus. It transformed property investment (combined with Negative Gearing) into the primary wealth-creation strategy, ensuring sustained investor demand.
2. GFC Policy Proof (2008-2009): The market's low point during the GFC was immediately arrested by the First Home Owners Boost (FHOB) and broad cash payments (October 2008). This showed that the government would deploy massive, rapid stimulus to prevent a structural price fall, reinforcing investor confidence.
3. The Liquidity Flood (March 2020): The RBA's emergency COVID Rate Cuts and Quantitative Easing (QE) injected unprecedented liquidity, creating the conditions for the most recent Nominal Higher High.
II. The Bearish Divergence Signal (The Warning)
These points explain why the recent peak is weak and unsustainable:
4. Technical Exhaustion: The Bearish Divergence observed between the Nominal HPI Price (making a \text{Higher High} in 2022) and the RSI/Momentum (making a \text{Lower High}) signals that the momentum required to sustain the uptrend is exhausted.
5. The Illusion of Value: The Nominal Higher High is highly misleading. When adjusted:
Purchasing Value: The Price-to-Income Ratio reached a \text{record high} (\sim 8.0 times income), meaning the price peak was actually a Lower Low in affordability.
Real Value: When measured in Ounces of Gold, the HPI peaked at a massive Lower Low (\sim 206 ounces in 2024 vs. \sim 874 ounces in 2004), demonstrating the fragility of AUD-denominated property wealth.
III. The Policy Constraint (The System Strain)
These points explain the high risk and fragility of the current market:
6. Diminishing Returns: The market required the extreme, combined stimulus of near-zero rates (RBA) and low-deposit guarantees (5% FHB schemes}) to reach its 2022 peak. The Bearish Divergence confirms this level of effort produced a historically weak momentum result, indicating policy inefficiency.
7. The Investor Exit Trigger: The current high interest rates and the {Lower Low in Purchasing Value} are highly likely to encourage a rotation of capital. A sell-off of just 5\% of investment equity (\approx \$104 Billion) could overwhelm {FHB} demand and force a Nominal Price Correction a {Lower Low}) by late 2026 / mid-2027.
8. The "Double Whammy" Risk: Recent low-deposit buyers face extreme risk: their equity is thin (vulnerable to price drops) while their debt servicing remains stretched, as large wage increases are structurally unlikely (due to the RBA's mandate to curb inflation).
🛑 INVESTMENT PROPERTY HEDGE: The Exit Strategy
This strategy is for owners of non-owner-occupied property facing the convergence of the {AU} Housing {Bearish Divergence} and the Global {JPY} Unwind.
✅ Core Hedges: Replacing Inefficient Investment Equity
The goal is to move capital from a low-momentum, illiquid, highly-taxed, AUD-denominated asset (investment property) into a high-liquidity, real-value store.
1. Physical Gold & Silver (The Devaluation Defense):
WHY: Gold is the essential hedge against the currency risk. Our analysis shows that your property's value has collapsed when measured in Gold {Lower Low} on the {House Price-to-Gold Ratio}). Converting illiquid property equity into physical metals protects wealth from the {AUD} devaluation caused by both domestic policy strain and global policy shocks.
Investment Action: This should be prioritized for preserving the real wealth that may be lost if Nominal {QAUR628BIS} corrects.
2. Defensive Japanese Yen {JPY}) Exposure:
WHY: This is the most direct hedge against the global liquidity shock. The {JPY} is the "funding currency" for the global risk trade. When the carry trade unwinds, investors must buy {JPY} to repay their debt, causing a sharp appreciation. This {JPY} strength would directly offset losses incurred by the domestic housing slowdown.
Investment Action: Provides protection against the {2026-2027} global market crash that the {JPY} unwind is predicted to trigger.
3. Bitcoin (The Non-Sovereign Liquidity Drain):
WHY: Bitcoin provides the fastest, most tax-efficient (long-term {CGT} relief applies) exit route for capital leaving a strained domestic financial system. It is the perfect liquid asset to absorb the {\$104B} of equity that a 5\% investor sell-off would create.
Investment Action: A strategic allocation here hedges against both {AUD} devaluation and the systemic policy risks you've identified.
❌ Liabilities to AVOID: The System's Vulnerabilities
1. Australian Bank Stocks {CBA, Westpac, etc.}):
WHY NOT: Their fate is tied to your property's mortgage risk. The {Bearish Divergence} on the (QAUR628BIS) directly increases their credit risk. The {JPY} unwind will also hurt them by disrupting global financial stability and reducing lending capacity. They are a concentrated liability.
2. Leveraged US Stock Indices {S\&P 500/Nasdaq}):
WHY NOT: The {US} market is a primary target of the {JPY} carry trade unwind. Leveraged investors will be forced to sell these high-performing assets to close their debt positions, leading to a non-fundamental, sharp correction. The risk of sudden {JPY}-driven liquidation is too high.
Thanks for reading I made this for my Father who recently had to ( forced hand) purchase another home (above what he lived for "reasons") convinced cash and the property are safe and cannot afford to lose more money.
Leave a comment for him.
Or add to the conversation share your own views.
AUDJPYHello Traders,
We are waiting for a confirmation from CPI news! Any big surprise means we should not trade against it!
This is out Daily Chart!
A bullish chart it really is!
We are searching for middle of the channel to react!
The trend-line could be used as Liquidity hunt!

Could this week’s RBNZ cut mark the peak in AUD/NZD? Is it too early to call the Aussie dollar peaking against the New Zealand dollar? Several analysts suggesting the AUD/NZD rally is losing momentum ahead of this week’s Reserve Bank of New Zealand decision.
Markets expect the RBNZ to deliver a 25-basis-point cut, taking the Official Cash Rate to 2.25%.
Strategists at Bank of New Zealand and National Australia Bank say the currency pair, which recently traded near decade-high levels, may start to retreat toward 1.14 if the RBNZ indicates it is close to ending its easing cycle.
Technical signals could be reinforcing the idea that AUD/NZD may be nearing a turning point. A bearish candlestick resembling a shooting star formed on 13 November, a pattern often associated with reversals after extended uptrends.
Still, not all factors favour the kiwi. Australia maintains a sizable rate advantage over New Zealand

AUDUSD: Complexity is in it's peak!Dear Traders, The Aussie is not easy to trade these days! However, I've been asked for an analysis. I suggested to risk less than an ordinary trade!
This is the daily chart
We might have seen newly form bearish channel! However, it might be just a correction!
We'll see
While we are ready for long in this setup!
A shorting from here with stop-loss over the bearish trendline is also considerable.

I'm Bearish on the Aussie DollarCHOCH + BOS + Liq (IND) + H1 OB
Unfortunately, yesterday's sweet zone @0.6160 didn't hold
New signal Alert 🚨
AUDUSD
Pair: AUD/USD (Aussie Dollar)
Side: Sell (Sell Limit)
Entry: 0.6508
QP/STP: 0.6483 (25 pips)
TP 1: 0.6453 (50 pips)
TP 2: Open
Stop Loss: 0.6518 (10 pips - enough space for price to breathe)
Do not over-leverage your account, use proper risk and money management.
I8.11.25
Ask me any question !!!

AUD/USD Holds Above 100-day EMAWhile the Aussie saw two-way volatility last week and a narrow open-to-close range between Tuesday and Friday, my bias remains bullish with scope for a move towards the 0.6580 high.
Risk reversals point to limited downside for AUD/USD on the options market. The pair also posted four consecutive daily closes above the 100-day EMA, with prices attempting to hold above the 20-day EMA. Monday’s strong bullish candle set the tone for the current range, and Thursday’s spinning-top doji highlights demand sitting just above the 200-day EMA.
The one-hour chart shows volumes rising during Friday’s rally but fading during the pullback, suggesting the move lower lacks real bearish intent. If AUD/USD can hold above the September low, the oversold hourly RSI(2) supports a bounce towards 0.6550. A break above that level exposes the weekly R1 near the 0.6580 high.
Matt Simpson, Market Analyst at City Index.

Can The Yen Fight Inflation While Rates Stay Low?The AUD/JPY currency pair's surge above 101.00 is a direct result of two opposite forces. The Australian Dollar (AUD) is strong because inflation is unexpectedly high, forcing the RBA to keep its interest rate at 3.60%. This high rate attracts global investment, as traders move money to Australia for better returns. Meanwhile, the Japanese Yen (JPY) is weak because the BoJ maintains an extremely low interest rate, near zero, to boost its economy. This wide gap in rates makes the AUD/JPY a favorite for the "Carry Trade," where investors earn the difference, pushing the pair higher.
Beyond just interest rates, geopolitics is playing a crucial role. The recent US-China trade deal, which saw a truce on certain tariffs and export controls on rare earth minerals, strongly benefits the commodity-linked AUD. Australia is a major exporter of these minerals. This trade calm reduces global risk and boosts demand for Australian goods. Conversely, the JPY suffers from political choices, as Japan's new government plans aggressive spending. This combination of low rates and high spending ensures the JPY remains weak, reinforcing the strong case for continued AUD/JPY strength.

MASTERCLASS: INTRADAY & SWING TRADE AUDUSD 🦘 AUDUSD (0.66112) - COMPREHENSIVE TECHNICAL MASTERCLASS: INTRADAY & SWING TRADE BLUEPRINT 🦘
October 27-31, 2025 | Advanced Multi-Timeframe Trading Forecast
🎯 MARKET OVERVIEW & ANALYSIS SCOPE 🎯
Current Spot Price: 0.66112 | Analysis Date: Oct 25, 2025 | Timeframes: 5M-1D Complete Spectrum | Trading Style: Intraday Scalp + Swing Trade | Conviction: Medium-High
━━━━━━━━━━━━━━━━━━━━━━━━━━━━━━━━━
📊 1. MULTI-TIMEFRAME TREND STRUCTURE & DOW THEORY VALIDATION 📊
🔍 Daily (1D) Timeframe - Primary Market Direction
The 1D chart exhibits mixed consolidation with bearish undertone . Dow Theory framework shows LOWER HIGHS pattern emerging (0.6640 → 0.6620 → 0.6615), signaling potential downtrend initiation. Elliott Wave structure suggests completion of 5-wave impulse (up) targeting reversal near 0.6580-0.6600 levels. RSI reading 48-52 (neutral zone, showing weakness as bearish bias forms). VWAP at 0.6605 acting as temporary support with breach implications downward.
⏰ 4H Timeframe - Swing Trade Risk Structure
Four-hourly demonstrates bearish flag formation with downside target potential . Price consolidating below 0.6625 resistance after failed breakout attempts. Bollinger Bands tightening (squeeze pattern)—volatility expansion imminent. RSI declining from 55 to 48 range (bearish momentum deterioration). Ichimoku Cloud configuration: price trapped between Kijun-sen (resistance) & Senkou Span B (dynamic support)—indecision zone. Downside target: 0.6580-0.6560.
🔥 1H to 5M Intraday Setup - Micro Timeframe Dynamics
One-hour shows head-and-shoulders pattern developing with neckline at 0.6610. Left shoulder complete (0.6625), head forming (0.6620), right shoulder declining (0.6618). Harmonic pattern: Bearish Bat identified at 0.6595 (D-point) suggesting short entry opportunity. 30M timeframe displays EMA50 crossing below EMA200 (bearish crossover just initiated). Volume declining on attempted rallies = selling pressure dominance. 5M shows bear trap formation near 0.6625—trapping bullish retailers before reversal.
━━━━━━━━━━━━━━━━━━━━━━━━━━━━━━━━━
🎯 2. ENTRY & EXIT PROTOCOL + WYCKOFF DISTRIBUTION PHASE 🎯
SWING TRADE SHORT ENTRIES (4H/1D): Sell breakdown below 0.6610 (H&S neckline) with stop @ 0.6635 (Risk:Reward 1:3 minimum). Wyckoff Distribution phase activated—institutional selling pressure accumulating. Target: 0.6560-0.6540 (swing trade 3-5 days hold).
INTRADAY SHORT SCALPS (5M/15M/30M): Multiple entry opportunities: (1) Head-and-shoulders neckline break = 0.6610 entry | (2) Bearish Bat PRZ completion = 0.6595-0.6590 aggressive short | (3) EMA crossover rejection on 30M = 0.6615-0.6620 pullback short entry.
PRIMARY PROFIT TARGETS: 1D: 0.6560 | 4H: 0.6575 | 1H: 0.6600 | 30M: 0.6610 (quick 15-20 pip scalp gains) | Extended: 0.6540 (major support level).
STOP LOSS PLACEMENT STRATEGY: Swing shorts: 0.6640 (above H&S left shoulder) | Intraday: 0.6625 (tight 15-20 pip stops) | Trail stops below Bollinger Band upper band as price descends.
💡 Pro Trading Tip: Use Ichimoku Kijun-sen (26-period) as dynamic resistance/stop level. Lock profits at each support zone identified via Gann angles.
━━━━━━━━━━━━━━━━━━━━━━━━━━━━━━━━━
⚡ 3. REVERSAL SIGNALS & JAPANESE CANDLESTICK PATTERN ANALYSIS ⚡
✅ BEARISH REVERSAL CONFIRMATIONS:
Engulfing pattern visible on 30M chart—red candle engulfing previous green (seller dominance confirmed). Shooting star candlestick near 0.6625 (failed rally rejection). Dark cloud cover pattern on 1H signals seller takeover at highs. Head-and-shoulders neckline (0.6610) acts as critical reversal zone. Ichimoku Chikou Span trading BELOW price action = confirmed bearish structure. Stochastic showing bearish divergence (lower highs on RSI/price higher highs).
⛔ BULLISH REVERSAL WARNINGS & BULL TRAP IDENTIFICATION:
Bull trap currently IN PROGRESS near 0.6625 resistance—retailers buying resistance, institutions distributing. If price breaks above 0.6630 with declining volume, false breakout confirmed. Morning Star pattern absent—no reversal higher probability. VWAP rejection combined with closing below 0.6610 = strong bearish confirmation. Gann resistance at 0.6640 acts as major distribution zone where selling accelerates.
⚠️ CRITICAL LEVEL: 0.6610 (H&S neckline) = REVERSAL THRESHOLD. Break below = Bearish Continuation | Hold above with volume = Bull trap intact
━━━━━━━━━━━━━━━━━━━━━━━━━━━━━━━━━
🔴 4. BREAKDOWN DYNAMICS & BEARISH PATTERN FORMATIONS 🔴
✅ PRIMARY BEARISH BREAKDOWN SCENARIO (65% PROBABILITY):
Head-and-shoulders breakdown below 0.6610 neckline on 1H timeframe with volume confirmation (need 20%+ volume spike below average). Elliott Wave target: 0.6540-0.6500 (5th wave decline in new downtrend cycle). Bollinger Band lower band at 0.6560 = natural extension target. Measured move from pattern: H&S height (0.6625-0.6610 = 15 pips) projected downward = 0.6595 target.
🔷 HARMONIC PATTERN PRECISION DOWNSIDE TARGETS:
Bearish Bat pattern (XA:BC 0.618) D-point entry: 0.6595 with target 0.6540 (161.8% extension downward). Bearish Butterfly on 4H suggesting potential extended move to 0.6480 (extreme scenario). Crab pattern confluence identifies 0.6570 as intermediate support-bounce zone.
⚠️ BULLISH PATTERN - FALLING WEDGE (BULL TRAP) (35% PROBABILITY):
If price holds above 0.6610, 4H chart displays falling wedge formation that could breakout bullishly to 0.6650+. Stochastic confluence on 1H indicates potential bounce setup. However, volume analysis suggests limited upside conviction. Bear trap possible if institutions accumulate after distribution climax. Watch for climactic volume spike—wedge collapse likely either direction.
━━━━━━━━━━━━━━━━━━━━━━━━━━━━━━━━━
📉 5. VOLATILITY METRICS & PRICE ACTION COMPRESSION 📉
🌊 Bollinger Bands - Critical Squeeze Signal:
Band width compressing to 180 pips on 1D (lowest in 12 days)—explosive volatility breakout imminent within 36-48 hours. Intraday Bollinger Bands (5M/15M/30M) showing initial expansion toward lower band—bearish volatility thesis strengthening. Price approaching lower Bollinger Band (0.6580) = oversold setup potential or trend continuation signal depending on volume.
📍 SUPPORT & RESISTANCE ARCHITECTURE:
MAJOR RESISTANCE ZONES: 0.6630 (Bull trap distribution level) | 0.6625 (Recent swing high) | 0.6640 (Gann angle resistance) | 0.6650 (Weekly pivot)
CRITICAL SUPPORT LEVELS: 0.6610 (H&S neckline/VWAP area) | 0.6595 (Harmonic D-point) | 0.6575 (4H support) | 0.6560 (Bollinger lower band) | 0.6540 (Major support)
VWAP PROFILE: Daily VWAP: 0.6605 (trending downward) | Weekly VWAP: 0.6615 (secondary resistance)
📊 Moving Average Divergence - Bearish Alignment:
EMA 50 below EMA 200 on 1H/4H (bearish structure forming). SMA 20 crossing below SMA 50 on 30M = momentum deterioration signal. 5M chart: EMA50 recently crossed below EMA200—intraday downtrend initiation confirmed. Price trading BELOW all major moving averages = weakness confirmed. Wyckoff Distribution phase in progress—institutional selling continuing.
🎯 OVERBOUGHT/OVERSOLD CONDITIONS & MOMENTUM EXHAUSTION:
RSI Status: 48-52 range (neutral sliding toward oversold)—RSI approaching 40 = potential for capitulation move lower. Stochastic on 15M: Declining from 55 toward 30 zone = bearish momentum acceleration. Ichimoku RSI below midline transitioning lower—downside potential significant. CCI on 5M declining below zero (strong bearish momentum without extreme oversold exhaustion). Fast Stochastic declining toward 20 level—room for extended downside run.
━━━━━━━━━━━━━━━━━━━━━━━━━━━━━━━━━
🎓 6. ADVANCED TECHNICAL THEORY INTEGRATION & FRAMEWORKS 🎓
⭐ ELLIOTT WAVE STRUCTURE: 5-wave impulse (up) completed near 0.6625 | Wave A (down) declining toward 0.6595-0.6540 | Correction target: 50% retracement = 0.6575 | Extended target: 161.8% extension = 0.6480 maximum (9-12 trading days)
⭐ GANN THEORY APPLICATION: 45-degree angle resistance @ 0.6640 (broken support becomes resistance) | Square of Nine support @ 0.6540 | Time-Price intersection: 6-8 trading days for major swing completion | Gann fan support @ 0.6560
⭐ WYCKOFF METHODOLOGY - DISTRIBUTION PHASE: Spring pattern failed (no spring reversal) = Distribution confirmation | Markup phase ended, Distribution phase INITIATED | Test & Decline pattern active = institutional distribution continuing | Expected breakdown: 0.6595-0.6540 over 5-7 trading days | Climax alert: Watch for volume spike + wide range candle = distribution completion
⭐ DOW THEORY BEARISH CONFIRMATION: Lower highs: 0.6640 → 0.6625 → 0.6620 | Lower lows: 0.6590 → 0.6585 | Volume declining on rallies = downtrend validation | Trend now firmly bearish-biased
━━━━━━━━━━━━━━━━━━━━━━━━━━━━━━━━━
✨ COMPLETE TRADING ACTION PLAN ✨
🔴 PRIMARY BEARISH SCENARIO (65% Probability):
Entry Zone: 0.6610 (H&S breakdown) or 0.6615-0.6620 (pullback short)
Stop Loss: 0.6640 | Target 1: 0.6595 | Target 2: 0.6575 | Target 3: 0.6560
Risk/Reward: 1:3+ | Hold Duration: Swing (3-5 days) + Intraday scalp (1-3 hours)
Conviction Level: 65% | Setup Quality: Premium Bearish | Volume: Confirming
🟢 SECONDARY BULLISH SCENARIO (35% Probability - Contingency):
Trigger: Hold above 0.6625 + Stochastic bounce + Volume expansion upward
Entry: 0.6630 long | Stop: 0.6610 | Target: 0.6650 (bounce setup only)
Probability: 35% (Lower conviction bull trap risk) | Pattern: Falling wedge breakout
⏱️ TIMEFRAME STRATEGY HIERARCHY: 1D (macro structure) + 4H (swing foundation) + 1H (entry confirmation) + 15M/5M (execution precision)
💰 POSITION SIZING & RISK RULES: Risk max 1-2% portfolio per trade | Scale shorts on 50% pullbacks toward 0.6625 | Trail stops above Bollinger upper band
🔔 PRICE ALERT SYSTEM: Sell signal @ 0.6610 (neckline break) | Stop loss alarm @ 0.6640 | Take profit 1 @ 0.6595 | Full target @ 0.6560 | Extended @ 0.6540
📱 EXECUTION BLUEPRINT: Aggressive breakdown entries (30% position) + Patient pullback shorts (70% position) = risk-balanced approach | Scale out profits at each support zone
⚠️ RISK MANAGEMENT: Bull trap alert at 0.6625-0.6630 | Volume confirmation mandatory on entry | Trail stops religiously | Close to breakeven if volume fails
━━━━━━━━━━━━━━━━━━━━━━━━━━━━━━━━━
⚖️ COMPLIANCE DISCLAIMER: This analysis provided for educational & information purposes ONLY. NOT financial/investment advice. All trading carries substantial risk of loss. Trade only with capital you can afford to lose. Always implement proper risk management. Consult qualified financial advisors before trading. Past performance ≠ future results. Markets unpredictable.

Inside the AUD/USD Pullback SetupsAs gold surges above $4,100 and the U.S. government faces fiscal paralysis. Learn how traders are using pullbacks trades with 30–50 pip stop-losses to capture explosive rebounds in AUD/USD.
RBA September 2025: Hawkish Tilt vs August - Shorted EURAUDNow that we have the 30 Sept 2025 RBA statement, here’s a side-by-side comparison with the prior (August) statement, highlighting the specific new remarks, data changes, and tone shifts that matter for markets in the short term.
Key Differences: September vs August
Inflation
August: Inflation had eased into the 2–3% band, with underlying momentum lower, helped by rebates and easing pressures.
September: “The decline in underlying inflation has slowed… recent data suggest Q3 inflation may be higher than expected.”
🔹 New: Clearer warning that disinflation is stalling, with upside surprise risk. This is a hawkish tilt, raising doubt about how quickly the RBA will cut again.
Domestic demand & growth
August: Growth outlook was subdued, public demand dominant, consumption weak, risks tilted to downside.
September: “Private demand is recovering… private consumption is picking up as real household incomes rise… housing market is strengthening.”
🔹 New: Stronger domestic recovery narrative. This is a shift away from a purely dovish, weak-growth picture, suggesting easing might not need to be as aggressive.
Labor market
August: Labor conditions softening somewhat, unemployment ~4.3%, some easing in demand.
September: “Labor market conditions broadly steady… unemployment unchanged at 4.2%, underutilization low… wages growth has eased, but productivity weak and unit labor costs high.”
🔹 New: Balanced message — employment growth slowed, but overall labor market remains tight. The mention of unit labor costs high is a hawkish insertion, as it points to sticky wage-price dynamics.
Global risks
August: Emphasized uncertainty, trade headwinds, geopolitical risks, downside to global demand.
September: “More clarity on US tariffs — extreme outcomes avoided, but still adverse effect expected… geopolitical risks remain.”
🔹 New: Slightly more optimistic (less extreme trade risks), but still cautious. Market read: less urgent downside risk, neutral for AUD.
Policy stance / guidance
August: Dovish, emphasized “data dependency,” readiness to act, conditional forward guidance.
September: “Signs that demand is recovering, inflation may be persistent in some areas, labor market stable… appropriate to remain cautious… policy well placed to respond if needed.”
🔹 New: Stronger caution against rushing into more cuts. Less dovish than before, reinforcing a wait-and-see bias.
Tone shift: Compared to August, the September statement is less dovish. It highlights stronger domestic demand, slower disinflation, and sticky unit labor costs.
Implication: This reduces near-term probability of another immediate cut. Markets may pare back November cut expectations slightly.
AUD reaction: Near term (this week and next), AUD likely supported on dips, especially if global risk sentiment doesn’t collapse. AUD currency crosses may see AUD outperformance, while AUDUSD may remain also supported but also more dependent on USD drivers.
Unless we see a major surprise from U.S. Jobs data I will remain short with minimum target at 1.7593
If you have any questions don't hesitate to drop them in the comments below.
AUUDSD: Sells? Wait For It... Wait For It...!Sept 17 marked the Swing High, taking out buy side liquidity. We've been in retracement since then. The structure looks to be turning bearish. Combine that with the strength of the US Dollar versus the current weakness in the AUD... look for an opportunity to sell, my people.
Enjoy!
May profits be upon you.
Leave any questions or comments in the comment section.
I appreciate any feedback from my viewers!
Like and/or subscribe if you want more accurate analysis.
Thank you so much!
Disclaimer:
I do not provide personal investment advice and I am not a qualified licensed investment advisor.
All information found here, including any ideas, opinions, views, predictions, forecasts, commentaries, suggestions, expressed or implied herein, are for informational, entertainment or educational purposes only and should not be construed as personal investment advice. While the information provided is believed to be accurate, it may include errors or inaccuracies.
I will not and cannot be held liable for any actions you take as a result of anything you read here.
Conduct your own due diligence, or consult a licensed financial advisor or broker before making any and all investment decisions. Any investments, trades, speculations, or decisions made on the basis of any information found on this channel, expressed or implied herein, are committed at your own risk, financial or otherwise.

COH Re-Entry Setup: High Dividend Play With Upside PotentialCochlear (ASX: COH) continues to stand out as one of the premier dividend stocks on the ASX, currently paying A$2.15 per share semi-annually (A$4.30 annually). With the next ex-dividend date falling on 18 September 2025, investors who accumulate positions within the coming weeks can secure strong passive income while also positioning for potential capital growth. This dividend flow adds a layer of consistency to the portfolio, making COH a defensive yet opportunistic play in uncertain markets. Unlike many high-growth names, COH offers a blend of stability and upside potential, which is attractive for investors aiming to compound both yield and price appreciation.
From a technical perspective, COH has cleanly respected the weekly Fair Value Gap (FVG), offering a well-defined buy zone between A$276.05 – A$291.70. This zone aligns with a retracement into structural demand, giving confluence for a high-probability long setup. Should price continue to hold above this level, the next logical upside targets sit around A$350+, with intermediate liquidity resting at A$322.75. Price has built significant buyside liquidity pools above prior highs, which the market tends to seek in order to rebalance inefficiencies. For dividend-focused investors, this setup is especially compelling — not only is there steady income from the semi-annual payout, but also the possibility of capturing 30%+ capital growth from current levels. COH therefore provides a dual benefit: reliable cash returns and strong technical momentum that could fuel a multi-month rally.

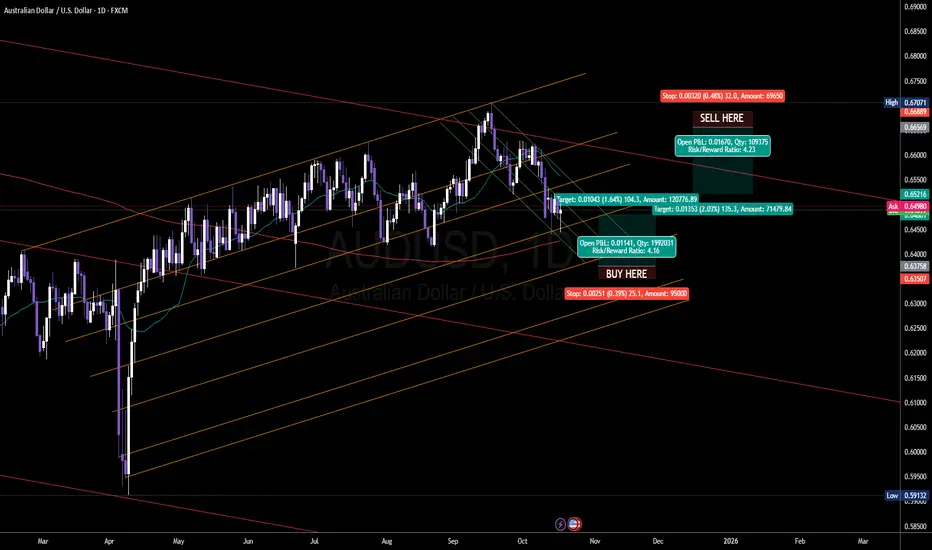
AUD/USD Long Trade Setup – Buying at the Channel LowOANDA:AUDUSD
🔍 Technical Overview:
The pair is trading within a well-defined ascending channel.
A potential bullish reversal is forming at the confluence of:
Channel support
Local structural support (highlighted in orange circle)
Bullish wick rejections and slowing downside momentum
📈 Trade Idea: BUY AUD/USD
Entry: Market buy or buy near 0.6450 – 0.6465
Stop-Loss: Below the swing low and channel support at 0.64160
Target 1: 0.65150
Target 2: 0.6566
Target 3: 0.66160
Risk-to-Reward: ~1:3 R:R ratio
Monitor price action near mid-channel resistance
🧠 “If the structure speaks to you, let it echo.” – Let the price action confirm your bias before committing fully.
Previous Sell Setup at the top of channel:
Psychology Always Matters:
