AVAX | ANOTHER DUMP IS LOADING | CHOO CHOOOOCRYPTOCAP:AVAX looks ready for another potential dump. In my CRYPTOCAP:AVAX analysis of August 26 we nailed the entry and exit pixel perfect.
The CRYPTOCAP:AVAX analysis of September 11 was also on point.
I believe that we're not setting up for another hard leg down. Lets look at the data to validate our thesis.
We’re currently in a textbook compression before expansion phase. Price has been moving sideways for days.
CVD Spot is trending down while price holds flat.
CVD Stablecoin-Margined Contracts is also trending down.
CVD Coin-Margined Contracts is trending down even more aggressively.
This tells us that while price is stable, market participants are hitting the bid — selling through the order book. The only reason price hasn’t dropped yet is because passive buyers (limit bids) are absorbing that selling pressure. Once that liquidity weakens or gets pulled, price can easily air pocket lower.
Now, here’s where it gets interesting.
Open Interest (Stablecoin-Margined) is flat.
Open Interest (Coin-Margined) is rising steadily.
At the same time, Coin-Margined CVD continues to drop, and price remains flat inside the range.
Conceptually, this combination is very bearish. Rising OI means new positions are being opened. Falling CVD means those positions are being opened via market sells — in other words, traders are adding shorts. The steady rise in coin-margined OI tells us these are leveraged positions taken directly against the asset, not just speculative stablecoin longs.
This pattern shows that new short exposure is building quietly under the surface, while spot and stablecoin flows fail to show any real buying. It’s the kind of distribution that looks like “accumulation” on the chart — but it’s actually leveraged sellers being absorbed by patient buyers. When those buyers step away, the imbalance resolves sharply to the downside.
In plain English:
Price is holding up because someone keeps catching the falling knife. But the knife is still falling.
Unless Spot CVD turns positive and stablecoin OI starts rising with it (showing real demand returning), this setup points to one thing — another leg down is coming for AVAX.
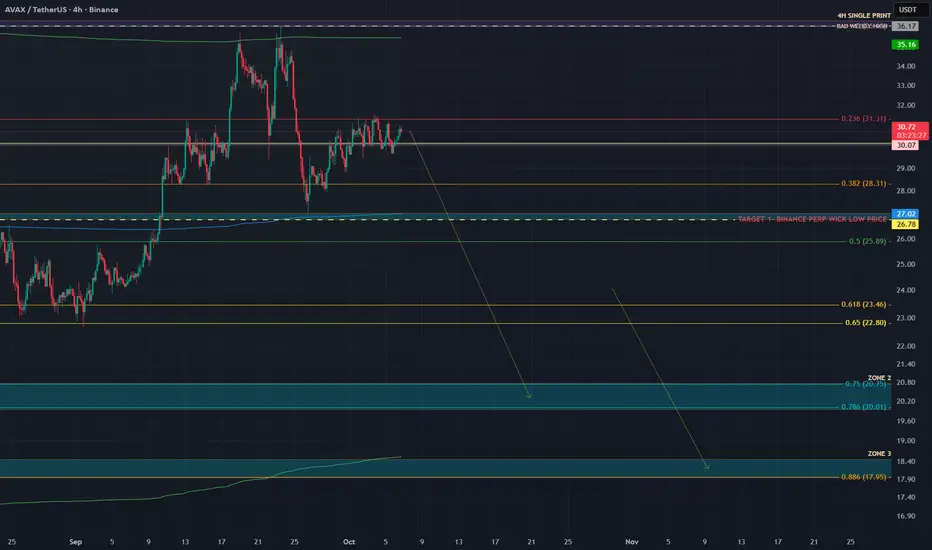
I'm targeting ZONE 2 and ZONE 3. Check the Order Flow Data here: ibb.co
Trade safe, Nomads!
Avaxprice
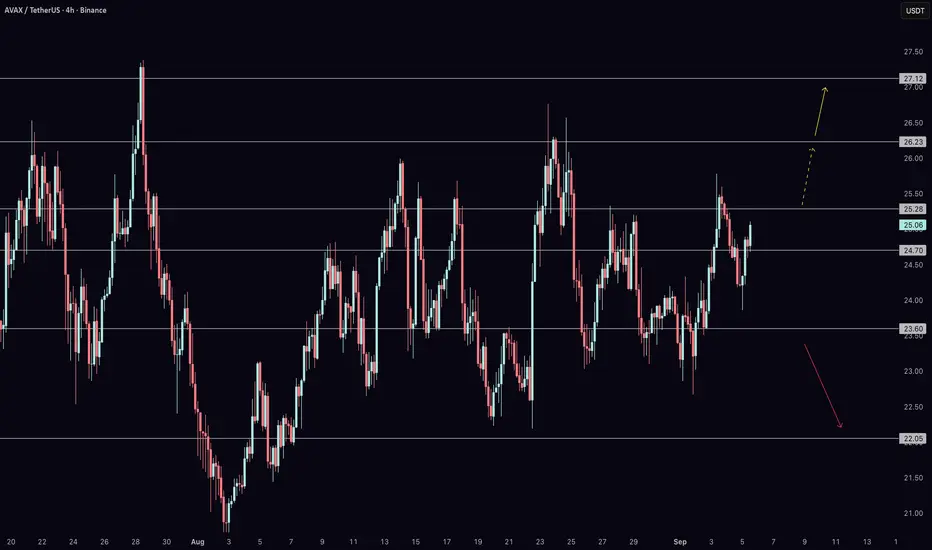
AVAX Ready for Breakout After NFP Shock?Avalanche (AVAX) is holding key support and showing signs of strength after today’s NFP report came in much weaker than expected. That release sparked volatility across risk assets, and with Bitcoin leaning bullish, AVAX could be setting up for its next leg higher. In this video, I break down both the daily and 4-hour charts to map out the critical levels you need to watch.
From $22 support to resistance levels at $26.2, $27.1, and $30.6, the structure remains constructive as long as AVAX holds above its floor. A decisive breakout opens the path toward $39 and potentially $48 in the medium term. Join me as I explain the bullish roadmap, the downside risks, and how this all connects back to Bitcoin’s momentum after NFP.
AVAX - CAME TO GLOBAL RESISTANCEAnalyzing the chart, it becomes obvious that the price is trading within the global resistance zone spanning from 44 to 56.
Given this context, it is wise to look for attractive short-term setups, as they are quite reasonable at this stage.
The initial target could be to remove liquidity behind the wick (x) at 27.24, and further targets could be to fill the imbalance on the daily timeframe (FVG) around 23.70.
The third target involves withdrawing liquidity at 18.90(x) and then targeting a significant imbalance (FVG) over a one-week period.
Here we can already start looking for good setups in the downward movement, we are waiting for our confirmation!

AVAX → Avalanche At Resistance! Reversal Time? Let's Answer.Avalanche had one more nudge toward the 2021/2022 resistance level since my last analysis, creating a bearish divergence and setting us up for a short trade. Should we short now?
How do we trade this? 🤔
As stated in my last analysis and this one, we need a short signal and confirmation for justification to short AVAX. Our proposed third push up from the previous analysis never rendered a sell signal and has now created a bearish divergence with the RSI. This means the price had a higher high and the RSI a lower high, signaling weakening bulls.
This does *not* mean we enter a short now, it's too risky without more price action. We need a strong sell signal and preferably, a break below the channel support and a re-test for resistance. Then short down to the Daily 200EMA at a 1:2 Risk Reward Ratio. It's also reasonable to take half profits at a 1:1 Risk Reward (around $28.00) and swing the remainder at a 1:3 risk reward or until a reversal signal shows itself.
💡 Trade Idea 💡
Short Entry: $34.00
🟥 Stop Loss: $25.00
✅ Take Profit: $40.00
⚖️ Risk/Reward Ratio: 1:2
🔑 Key Takeaways 🔑
1. Bull Channel, Bias to Long!
2. Three Pushes up in Trend with Sell signal, Signal to Change Trend.
3. Gap to Second Push Support Line.
4. RSI at 63.00 and below Moving Average, Divergence.
5. Wait for Short Confirmation bar before entering a position.
💰 Trading Tip 💰
Divergences between price action and the RSI are not strong signals on their own. Combined with three pushes up in a trend, a major resistance area, and a sell signal, renders a higher probability of profit for reversal trading.
⚠️ Risk Warning! ⚠️
Past performance is not necessarily indicative of future results. You are solely responsible for your trades. Trade at your own risk!
Like 👍 and comment if you found this analysis useful!

AVAX → Avalanche About to Reverse!? Or Continue to the Upside?Avalanche has been roaring through a nice curving bull channel until the top of the third push at $42.75! A nice sell signal formed on yesterdays daily candle, now we need to see how today closes to make our next move.
How do we trade this? 🤔
Avalanche had its third push up in the bull channel, a typical number of legs before the trend changes into a trading range or reverses. Given Bitcoins recent sell-off at a key resistance level, I believe it will drag AVAX down with it. AVAX has a sell signal on yesterdays candle and if today closes with a strong bear candle, we're likely looking at putting in some more lows. The RSI is also over 75.00 and below the moving average, all supporting at least a short-term bearish sentiment.
We need follow-through! Yesterdays signal is not enough justification to enter a short. It's best to wait for the price to fall to the 30EMA and see what happens there. If we get a bounce then another rejection to the downside, we'll have a head and shoulders reversal pattern on our hands at which time, a short will be justified.
💡 Trade Idea 💡
Short Entry: $26.00
🟥 Stop Loss: $32.00
✅ Take Profit: $14.00
⚖️ Risk/Reward Ratio: 1:2
🔑 Key Takeaways 🔑
1. Bull Channel, Bias to Long!
2. Three Pushes up in Trend with Sell signal, Signal to Change Trend.
3. Gap to Second Push Support Line.
4. RSI at 75.00 and below Moving Average, Bias to Short
5. Wait for Short Confirmation at potential Right Shoulder.
⚠️ Risk Warning! ⚠️
Past performance is not necessarily indicative of future results. You are solely responsible for your trades. Trade at your own risk!
Like 👍 and comment if you found this analysis useful!

Avax is about to explodeAvax is following Solana. may give a good rally. I gave this call when avax was 9$ and after that it is making continuously up rally.

AVAX Avalanche: 1D Chart ReviewHello friends, today you can review the technical analysis idea on a 1D linear scale chart for Avalanche (AVAXUSDT).
The chart is self-explanatory. The price is inside a triangle and approaching an area, which the price could fall back into a consolidation zone. AVAX price is inside the EMA ribbons and above the 200 SMA. If price continues to go down or consolidate, the 50 SMA may come down and complete a Death Cross with the 200 SMA. The RSI support line was broken and the RSI is going back up to re-test it and attempt breakout. MFI support line intact. Keep an eye on the two S/R lines I noted. Lastly Volume is still declining even though it makes attempts to move back up.
Included in the chart: Trend line, Support and Resistance Lines, Ichimoku Cloud, Volume, RSI, MFI ( Money Flow Index), EMA Ribbons, and 50 and 200 Simple Moving Average.
If you enjoy my ideas, feel free to like it and drop in a comment. I love reading your comments below.
Disclosure: This is just my opinion and not any type of financial advice. I enjoy charting and discussing technical analysis . Don't trade based on my advice. Do your own research! #cryptopickk
