AVAX/USDT - Heads Into Major Demand Zone — Bounce or Breakdown?AVAX is currently standing at one of its most critical decision points since 2023. After failing to hold its multi-year ascending trendline, the price finally broke down and closed the weekly candle below the structural level at $15.7. This isn’t a normal correction — this is a signal that the market structure has shifted, and AVAX is entering a survival phase.
But the story is far from over. Price is now sliding into a zone that has historically acted as a deep accumulation region:
$10.7 – $8.5
This yellow block is where large-volume buyers previously stepped in during the 2022 crash and later consolidated before major moves.
The long wick sweeping into this zone indicates early buyer activity — but not enough to reclaim structural levels yet.
Right now, AVAX is in the middle of a high-timeframe battlefield between two major outcomes:
Bullish Reversal Scenario → Price reclaims $15.7 and climbs back above the broken trendline.
Bearish Breakdown Scenario → Price loses $10.7, falls deeper into the accumulation block, and risks testing historical lows near $5.7.
---
Bullish Scenario — (Reversal Trigger: $15.7)
A bullish reversal starts to form if AVAX can:
1. Bounce strongly from $10.7–$8.5, and
2. Close a weekly candle back above $15.7.
This would signal that significant accumulation has taken place and that smart money is re-entering the market.
Major upside targets become:
$20.80 → First structural resistance
$32.90 → Mid-range breakout
$54.30 → High-timeframe trend reversal confirmed
This is the “comeback path” for AVAX.
---
Bearish Scenario — (Breakdown Trigger: $10.7)
If AVAX fails to hold above $10.7 on the weekly, the long-standing demand zone collapses.
Downside implications:
Immediate drop toward $8.5
If $8.5 also breaks →
Price opens the door to a deeper decline toward the historical low around $5.7
This would confirm a major redistribution phase, not just a pullback.
---
Price Action & Market Structure
AVAX is forming lower highs and lower lows, confirming a weekly downtrend.
Breaking the ascending trendline marks a clear character shift.
The $10.7–$8.5 zone now acts as the final defense for bulls before entering a multi-year lower range.
Expect liquidity sweeps & stop hunts in this region — patience and weekly confirmation are key.
---
AVAX is now sitting inside a make-or-break zone that will determine its multi-month direction.
Hold $10.7–$8.5 → Potential strong reversal back toward $20–$30
Break below $10.7 → Deeper bearish continuation toward the $5.7 region
This is the type of price zone where professional traders wait for confirmation, not quick reactions.
---
#AVAX #Avalanche #CryptoTA #AVAXUSDT #TechnicalAnalysis #Altcoins #PriceAction #MarketStructure #CryptoOutlook #SupportAndResistance
Avaxusdc

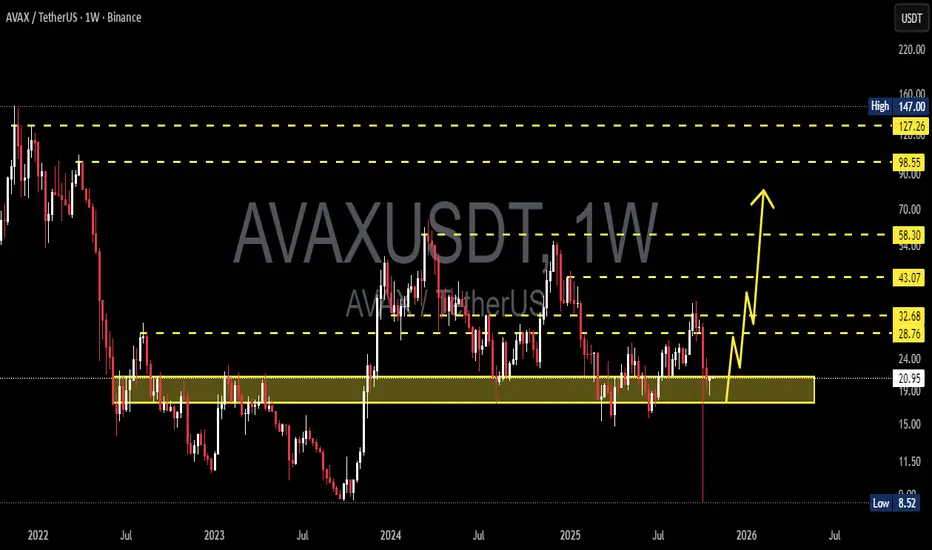
AVAXUSDT – Critical Support Zone: Will Decide the Next Trend?Yellow Block (Support Zone): 21 – 17.5 (Weekly)
This zone is the bulls’ last stronghold, an area that has historically marked AVAX’s major turning points. Price has now returned to this critical region — and what happens next could define the next macro trend.
---
Market Structure & Big Picture
After a long downtrend since 2022, AVAX has entered a macro consolidation phase, ranging between $17.5 and $43.
The current movement sits right at the bottom of this range, making the upcoming weekly close extremely important.
Major Range: 17.5 – 43
Key Support: 21 – 17.5
Main Resistance: 28.7 – 32.7 → 43.1 → 58.3
Historical High: 127 – 147
Historical Low: 8.5
This yellow zone isn’t just a technical area — it’s a battleground between long-term accumulation and potential distribution.
Every time AVAX touched this region in the past, price rebounded significantly, suggesting a possible mid-term reversal opportunity if bulls defend it again.
---
Pattern & Technical Characteristics
The chart currently shows a sideways accumulation pattern over more than a year.
Each retest of the 21–17.5 zone has produced deep wicks and strong rejections — signals of institutional absorption or smart money re-entry.
However, if this support fails, it could trigger a structural breakdown and re-open the path toward the lower double-digit region.
Potential pattern formations:
Double Bottom (Reversal) if price bounces and breaks above 28–33
Descending Channel Breakdown if price loses 17.5 with a confirmed close
---
Bullish Scenario – “Bounce From The Abyss”
If the weekly candle closes above 21, the support remains intact — and this could mark the start of a strong reversal swing.
Bullish confirmation signals:
Strong rejection with long lower wick
Rising volume during recovery
Weekly close > 24
Upside targets:
1. 28.7 → First resistance zone
2. 32.7 → Structural breakout confirmation
3. 43.1 → Major swing target
4. 58.3 → Mid-term continuation goal
Potential gain: 35% up to 170% from current levels if the bullish setup plays out.
---
Bearish Scenario – “Breaking the Last Line of Defense”
If the weekly close falls below 17.5, it confirms a macro breakdown.
AVAX could enter a new redistribution phase, targeting 12.0 – 9.0, and possibly 8.5 if a market-wide capitulation occurs.
Bearish confirmation signals:
Weekly close < 17.5
High-volume selling pressure
Failed retest (17.5 flips into resistance)
This would shift the macro bias fully bearish, and patient traders might wait for a new accumulation phase at much lower levels.
---
Conclusion & Macro Sentiment
AVAX currently sits in a golden decision zone — the line between collapse and recovery.
As long as the price holds above 21–17.5, the potential for a macro rebound remains strong.
But a confirmed breakdown below that area would signal that the accumulation phase isn’t over yet, and the market might need one final washout before a full recovery.
---
#AVAX #AVAXUSDT #CryptoAnalysis #TechnicalAnalysis #WeeklyChart #CryptoMarket #AltcoinAnalysis #TradingView #SwingTrading #SupportAndResistance #Avalanche #CryptoReversal #MarketStructure #CryptoUpdate
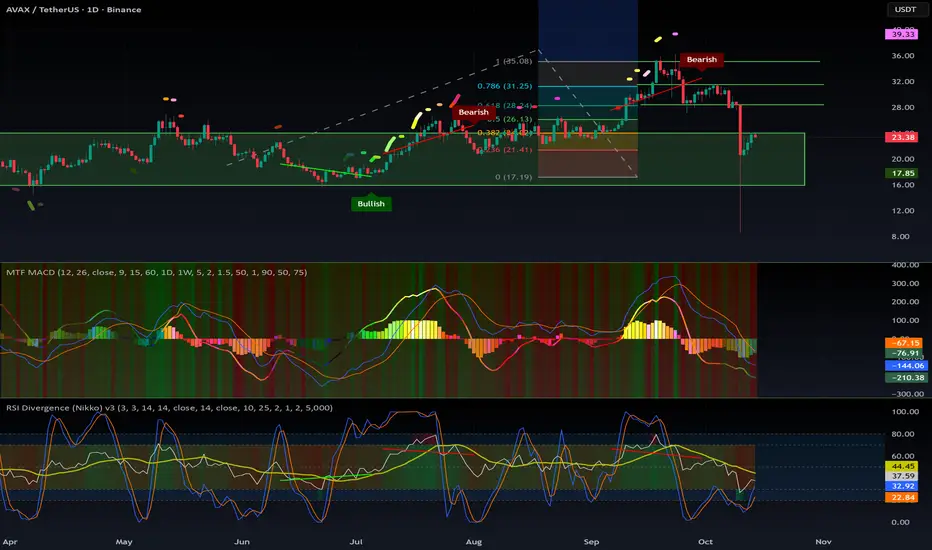
$AVAX: time to refill our bags!CRYPTOCAP:AVAX remains a solid project that’s not going anywhere. It’s now evolving into a game-oriented blockchain, which adds an interesting new use case to what was once a fairly mature ecosystem.
The current price range of $22–$23 sits in a strong demand zone, a level that has historically triggered major pumps.
With the Multi Timeframe MACD deeply oversold, the RSI low, and the Stochastic RSI bottomed out on the 1D, this looks like an excellent opportunity to build a position with a favorable risk/reward ratio.
It may take some time to fully clear the bearish divergence from the last rally, but the October 11th crash likely reset the structure — suggesting a bullish outlook moving forward.
Fibonacci targets:
🎯 TP1: $28.5
🎯 TP2: $31.4
🎯 TP3: $35.08
If the market enters a true altseason, CRYPTOCAP:AVAX could climb significantly higher — but for now, these are the most reasonable targets.
As always, DYOR before entering any trade.
#AVAX #CryptoAnalysis #Altcoins #TechnicalAnalysis #RSI #MACD #StochasticRSI #TradingSetup #Bullish #GameFi #Altseason #DYOR
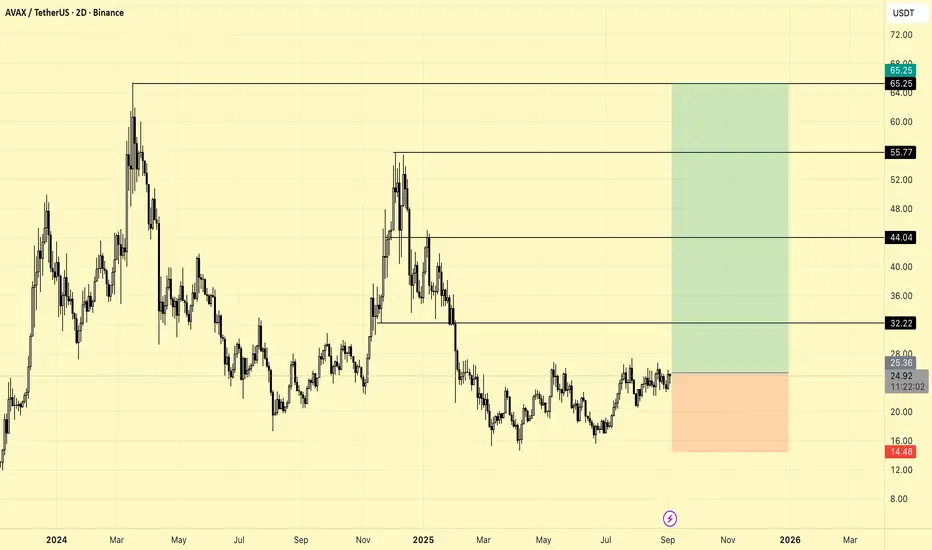
AVAX MID TERM TRADE IDEAKey Features and Explanation
Main support zone is marked at 14.48 USDT, indicating the stop-loss level for the setup.
Major resistance zones are drawn at 32.22, 44.04, 55.77, and 65.25 USDT as potential upside targets.
The green zone shows the reward/risk area for a bullish scenario, while the red zone visualizes the risk if price drops below support.
Current price is around 24.95 USDT, in a sideways consolidation near local resistance.
Trade Setup Summary
The chart captures a medium-term opportunity favoring a move up from the current range, aiming for the outlined resistance targets with managed stop-loss.
Level markings help define clear entries, exits, and targets for risk management.
Overall, this chart offers a structured technical outlook for AVAXUSDT, combining price levels with visual risk/reward parameters for effective trading assessment.
AVAX 1D Analysis – Key Triggers Ahead💀 Hey , how's it going ? Come over here — Satoshi got something for you !
⏰ We’re analyzing AVAX on the 1-Day timeframe timeframe.
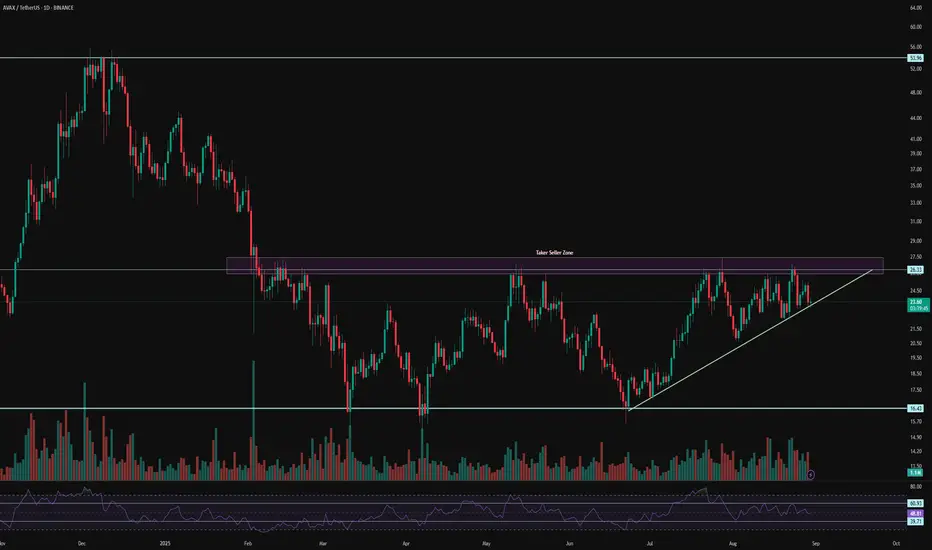
👀 In the daily timeframe of AVAX, after the drop it experienced, AVAX entered a box with a long-term range. The ceiling and floor of this box are in the area of $16 and $26. The time range of this box or its length is almost 170 days. At the ceiling of this box, there are strong seller tickers that get their sell orders activated every time the price reaches this area. To break this zone and for a good rise of AVAX, we need a very strong and high-volume momentum that causes a price jump and fills the sell orders.
💰 In the daily timeframe of AVAXBTC we can see a relatively good compression formed in this area, and with the breakout of the Bitcoin ceiling, more Bitcoin will be converted into AVAX and it can be a good confirmation for a long position and some spot buying. The area considered for the alarm zone is 0.0002286.
⚙️ Two key areas for RSI have been considered. Passing the swing limits of 61 and 40 can bring good volatility to AVAX and help it break out of this RSI compression that is seen as a box.
🕯 The area considered as the seller ticker is a strong one, and every time the price reached this area, we faced selling pressure. The size of the green candles is also larger compared to the red candles, and each time the compression area became smaller and the price is ready for a breakout and reaction (not today but next week).
🔔 The area we considered as the alarm zone for AVAX is $26, and with the breakout of this area, AVAX can move towards higher price levels. Price behavior at $26 can give us complete awareness for trading.
❤️ Disclaimer : This analysis is purely based on my personal opinion and I only trade if the stated triggers are activated .
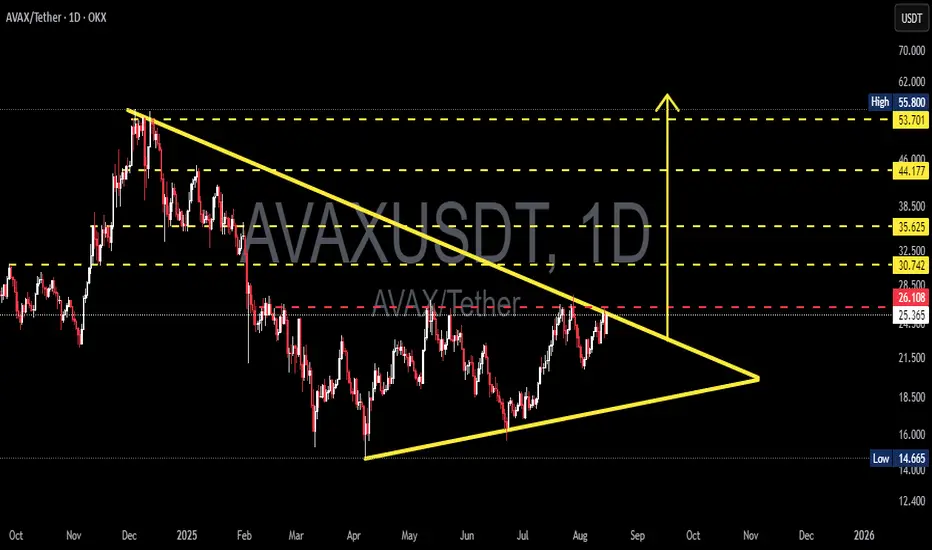
AVAX/USDT — Symmetrical Triangle Approaching Breakout?Overview:
The daily chart shows AVAX forming a symmetrical triangle (converging trendlines) since the Dec–Jan peak. Price is now testing the upper resistance trendline (~26.1 USDT) — we’re at a critical point heading toward the apex (late September). Volume behavior and a confirmed daily candle close will be key to determining the breakout direction.
---
1) Pattern Description
Pattern: Symmetrical Triangle — characterized by lower highs (descending resistance line from the peak) and higher lows (ascending support line from the April bottom). Price range is narrowing → volatility dropping → usually leads to a strong move when the pattern resolves.
Context: The broader trend before the triangle was bearish (drop from ~55.8). Symmetrical triangles can be neutral but often resolve in the direction of the prior trend — technical confirmation is essential.
---
2) Key Levels (from chart)
Upper resistance trendline / critical level: ~26.10 USDT (red dashed line), current price ≈ 25.3 USDT.
Major resistance targets: 30.74, 35.62, 44.18, 53.70 – 55.80.
Ascending support trendline: around 18–22 USDT depending on timing.
Structural low: 14.665 USDT (chart low).
(Values estimated visually from chart — verify with live data before trading.)
---
3) Bullish Scenario (if breakout upward)
Bullish Trigger
Daily close above descending trendline (~26.1) with strong volume → breakout confirmation.
Preferably supported by bullish technical indicators (RSI, MACD bullish crossover, rising OBV).
Targets
Step targets: 30.7 → 35.6 → 44.2 → 53.7 (partial profit-taking recommended).
Measured move theoretical target:
− Height ≈ 55.800 − 14.665 = 41.135.
− Added to breakout point (~26.108) → theoretical target ≈ 67.24 USDT (for reference, not guaranteed).
Risk Management
Stop-loss: daily close back below breakout trendline or under nearest swing low (e.g., conservative SL < 21–22 USDT).
Strategy: scale in — partial entry before breakout, add after confirmation. Monitor risk/reward closely.
---
4) Bearish Scenario (if rejected / breakdown)
Bearish Trigger
Rejection at upper trendline + bearish daily candle (and/or rising sell volume) → drop to ascending support.
Breakdown confirmation: daily close below ascending trendline with strong volume.
Targets
Initial drop to ascending support ~18–22 USDT.
If breakdown continues → possible retest of 14.66 USDT low.
Risk Management for Shorts / Cut-loss
SL for shorts: daily close above resistance (~>28 USDT) or above fake breakout highs.
Beware of bull traps — volume confirmation reduces risk.
---
5) Practical Trade Plans (example)
Conservative Long: Wait for daily close > 26.1 + strong volume → enter 50% position; add after retest. Targets: 30.7 / 35.6. SL under retest zone (~21–22).
Conservative Short: If clear rejection at upper trendline → short toward lower trendline. SL above recent high (~28).
Range Trading: Buy near lower trendline, sell near upper trendline until breakout confirmed.
---
6) Risk & Confluence Checks
Broader market/Bitcoin sentiment: AVAX is often correlated, which can amplify moves.
Supporting indicators: check volume, RSI, MACD, EMA(50/200) for confirmation.
Watch for false breakouts — confirm with volume + retests.
---
7) Summary
> AVAX is forming a Symmetrical Triangle. Critical resistance at ~26.1 USDT — daily close + volume will decide the next move. Valid breakout → step targets at 30.7 / 35.6 / 44.2 (measured move theoretical ~67.2). Rejection / breakdown → support at 18–22 and possible drop to 14.66. Manage risk with confirmation, stop-loss, and partial profit-taking.
#AVAX #AVAXUSDT #Crypto #TechnicalAnalysis #Triangle #Breakout #SupportResistance #Altcoin #SwingTrading
AVAX BUYING OPPORTUNITY AT 40 - 42 RANGEAVAX broke 50 psychological level and appears to be correcting. We can expect few more correction up to 40.
SL at 35
Targets would be 58 and above.

AVAX ROADMAPIf price can stay above 14$ than next step will be 16$ around.
If price can not stay above 14$ than we can see 11$-12$ levels.
Take your risk, make some profit !

AVAX long$AVAX has formed a bull-flag pattern. The continuation of bullish movement to resistance level at 97% is expected to happen.

AVAXUSDT, Its time to have some move down Hello everybody
If you want to learn Fundamental & Technical analysis send us messages ---> Our id is in profile
AVAX is one of the most powerful project that is working on many property base and it can be the future because ...
According to the chart and previous analysis, exactly the price recovery it self from the support zone area and had some rised.
But until now the trend of the price was not changed and the trend is downward and we should only take short position because is according to the trend.
Also you can put your stop loss at the higher shadow of the candle a little upper and put our target exactly very we put and observe your capital management.
Good Luck
Abtin
Previous analysis :

AVAXUSDT, We are in wave C or 2 ??Hello everybody
According to the chart and previous analysis, we shown on chart 3 zone that is the support zone of the price and the point of swing can be happen in there zone.
In here exactly first support zone was activated exactly.
We need to have correction of our breakwave that make ATH in here we have a wave that we can say it can be A or ABC both of the is correct and the acceptance of that to know which one we should name it is if the price can break this first support zone below the name of the wave is A and we are going to complete wave C and if the price rise up from here and can break the resistance zone at the top (ATH) we name it ABC.
Because of the movement that is hard to say which scenario can be happen we shown on chart that you can but 1 step in first support and if the second scenario happend you can buy in other support zone area to reduce average purchase.
This is analysis and you can entrance in position and spot trading with your own analysis and capital management this is just view of the analysis for helping anyone.
Good Luck
Abtin
Previous analysis :

AVAXUSDT , This route can be happen because ...Hello
Good night guys
According to the chart you can see , the momentum of the rising is becoming weak and now we are ready to make correction to recover is rally of movement
If you look at the chart carefully you can see we made 2 top and we should break the neck of the top and pullback to the neck then we are ready to drop the price the distance of the top and neck , and this mean that we can move like our route that shown on chart .
The one of the most important point is to use stop loss and observe money management dont entrance in position with your emotional sense
Previous analysis of AVAX :
Good Luck
Abtin

AVAXUSDT , Exactly active our buy zoneHello guys
Do you hear about AVAX ?
Do you know AVAX ?
Exactly moved to the buy zone are that we shown and move up
I have nothing to say about it , its amazing just i can say its amazing and powerful , it is future
According to the chart that we shown , we are in rally and we make new breakwave , there is a powerful momentum is behind this breakwave but we think the momentum is becoming weak and we need pullback and some correction to recovery the power and after that continuing the trend and move up .
We shown on chart support zone that the price can support , you can buy in part of part and low your buy price
Previous analysis :
Dont forget use stop loss and attention to money management
Good Luck
Abtin

AVAXUSDT , The price should have some pullbackHi guys
Did you take the profit of last week that we published ? or Not ?
Today we have analysis another amazing layer 2 blockchain coin
In last days AVAX is moving powerful toward new target and made new ATH because of the fundamental and news that published , at this time in technical view we need pullback for the price to be attractive for the investor and trader to be in buy position and buy some money of portfolio to AVAX .
We shown on chart a buy zone area and here we have nice R/r but this is market and anytime can happen anything we should be conscious about the market and the movement of trader .
BECAREFUL GUYS , MAYBE MARKET WILL STOP HUNTERING THE POSITION
Dont forget to attention to money management
Good Luck
Abtin

Avax Mooing Soon #AvaxAutumn Long this Project Now!Alright Guys here is my Fibonacci pull on the AVAX As we can see we have broken out of the ATH, let me know your thought on this strategy.

AVAX USDT CHARTI think it is worth accumulating AVAX here, it is a very good underrated cryptocurrency, in my opinion very big in #DEFI
If it falls, I will not think about buying it below, but I will do it immediately

AVAX 4-Hour Analysis (Go long)AVAX has formed a bullish pattern and seems the end of correction is here!
the pattern is a nice Flag with high gain.
your stop-loss could be below 32 with high target. we will update our chart.
Good luck
Drop like and write your comment below.

AVAXUSDT - accumulation Preconditions:
- accumulation
- global uptrend
- locally uptrend
- key level
- buy after break out
Push like if you think this is a useful idea!
Before to trade my ideas make your own analysis.
Thanks for your support!
