AXLUSDT — Demand Zone Defense or Bearish Breakdown?📝 Overview
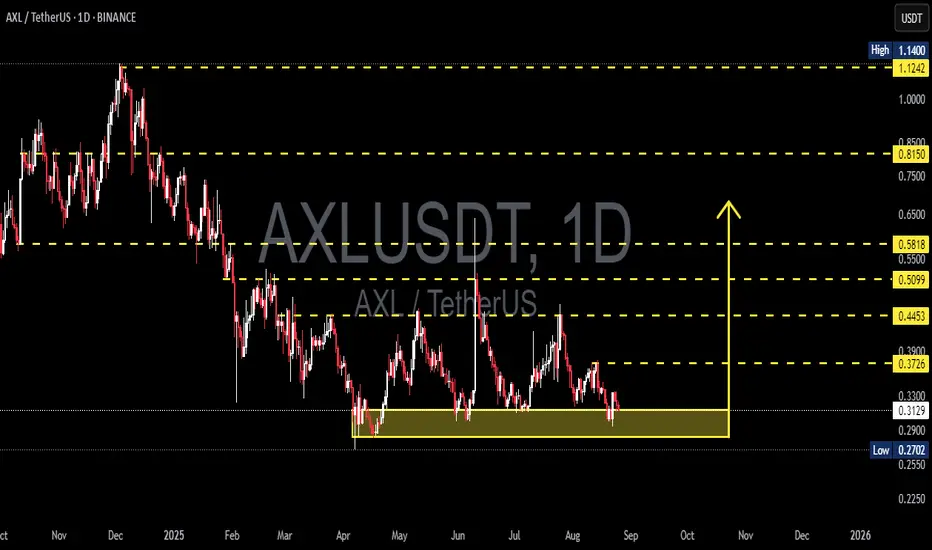
Currently, AXLUSDT (1D, Binance) is trading inside a key demand zone between 0.27–0.33 (yellow box on the chart). This area has been tested multiple times since April 2025, showing strong buying interest whenever price dips into it.
However, the broader structure still shows a clear downtrend with consistent lower highs, meaning the market is now at a critical decision point: will this demand zone hold and trigger an accumulation phase leading to reversal, or will sellers push price into a deeper bearish continuation?
---
📍 Key Technical Levels
Main Demand/Support Zone: 0.27 – 0.33
Lowest wick: 0.2702
Current mid-range: around 0.3143
Major Resistances above:
0.3726 → 0.4453 → 0.5099 → 0.5818 → 0.8150 → 1.1242 / 1.14 (High)
---
🔎 Structure & Pattern
Range base at the bottom of a downtrend: Price has been consolidating within this range since April.
Liquidity sweeps (fakeouts): Long wicks below the zone were quickly absorbed, signaling strong buyers defending the area.
Reversal confirmation: Only valid if price can close daily above 0.3726 and sustain it with a successful retest. Until then, risk of sideways chop or breakdown remains.
---
🚀 Bullish Scenario
1. Price sustains above 0.30 without a daily close below 0.27.
2. Breakout trigger: Daily close > 0.3726, followed by a successful retest → reversal confirmation.
3. Upside targets:
🎯 TP1: 0.4453
🎯 TP2: 0.5099
🎯 TP3: 0.5818
🎯 Extended: 0.8150 → 1.12–1.14 if momentum strengthens.
4. Bullish invalidation: Daily close < 0.27.
Aggressive approach: Buy around 0.30–0.31, SL below 0.27.
Conservative approach: Wait for breakout above 0.3726 and buy the retest.
---
📉 Bearish Scenario
1. Failure to hold the 0.27–0.33 demand will weaken structure further.
2. Daily close below 0.27 opens the door for deeper downside.
3. Next bearish targets:
First support: 0.2550
If broken, potential new lows due to lack of historical demand below.
---
⚖️ Conclusion
The 0.27–0.33 demand zone is a make-or-break level for AXLUSDT.
As long as price holds above it, the possibility of accumulation and reversal remains alive, especially with a breakout above 0.3726.
But if the zone fails, sellers may extend the downtrend to fresh lows.
In short: This is the golden zone for a decisive move — either accumulation to fuel a reversal, or a breakdown to continue the bearish trend.
#AXLUSDT #AXL #CryptoAnalysis #PriceAction #SupportResistance #DemandZone #RangeTrading #BreakoutSetup #BearishScenario #BullishScenario #CryptoTrading #DYOR
Axlanalysis
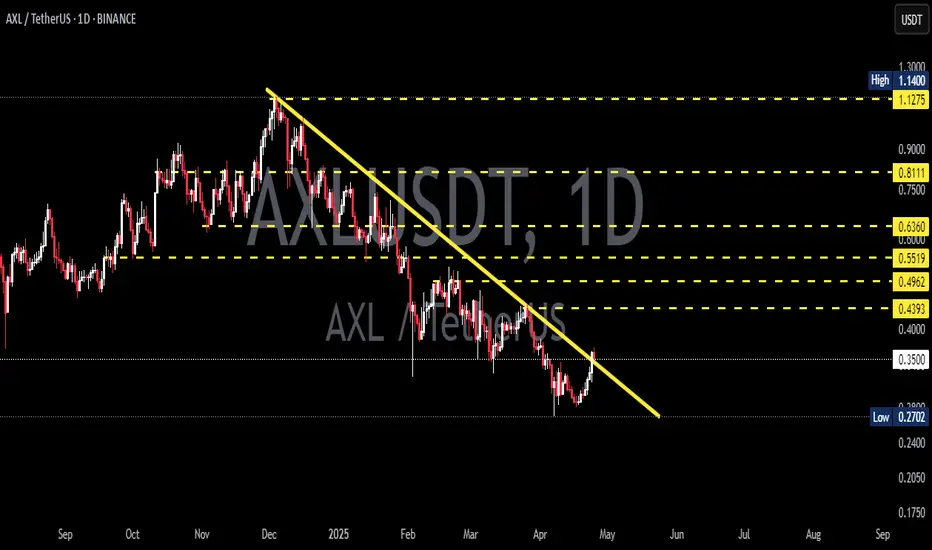
AXLUSDT Forming Descending Wedge bullishAXLUSDT is currently showing strong bullish signals after consolidating at a significant support level, with a notable uptick in trading volume. This renewed volume interest often precedes a breakout move, and the technical structure is shaping up for a potential surge. With momentum building and price action tightening, a projected gain of 60% to 70% is realistically within reach in the short to mid-term. This aligns well with historical price behavior and upcoming support-to-resistance flips.
Axelar (AXL) continues to attract investor interest due to its foundational role in cross-chain communication and interoperability. As more blockchains develop in silos, the need for protocols like Axelar grows. Its ability to facilitate seamless transfers across multiple chains makes it a strong contender in the next wave of infrastructure-focused crypto projects. Market participants are increasingly positioning themselves in utility-driven tokens like AXL that solve real scalability and connectivity problems in DeFi and the broader crypto ecosystem.
From a technical perspective, AXLUSDT is forming a bullish continuation pattern, suggesting that the recent consolidation is simply a pause before another impulsive leg to the upside. The presence of strong support zones, combined with increased volume and investor sentiment, makes this a high-probability setup for breakout traders and swing investors alike. If bullish momentum continues, the upside targets fall well within the 60% to 70% projected gain range.
Traders should keep a close watch on breakout confirmation signals and volume spikes, which could mark the start of a sustained bullish rally. As adoption and attention around cross-chain solutions grow, AXL is likely to see further market traction and price appreciation.
✅ Show your support by hitting the like button and
✅ Leaving a comment below! (What is You opinion about this Coin)
Your feedback and engagement keep me inspired to share more insightful market analysis with you!

AXLUSDT 1D AnalysisAXL ~ 1D Analysis
#AXL Managed to penetrate this resistant line and is currently trying to maintain it. As long as the price is above this S/R line, bullish can still encourage prices.
#AXL/USDT#AXL
The price is moving within a descending channel on the 1-hour frame, adhering well to it, and is heading for a strong breakout and retest.
We are experiencing a rebound from the lower boundary of the descending channel, which is support at 0.3360.
We are experiencing a downtrend on the RSI indicator, which is about to break and retest, supporting the upward trend.
We are looking for stability above the 100 Moving Average.
Entry price: 0.4040
First target: 0.4336
Second target: 0.4580
Third target: 0.4925

AXLUSDT 1DAXL ~ 1D Analysis
#AXL High risk trading, Buy after successfully penetrating this resistant line or buy after successfully testing this support block. with a short -term target of at least 10%+.

AXLUSDT 2DAXL ~ 2D Analysis
#AXL Test this support, buy from here if you still have a Conviction on this Coin with a minimum target of 15%+

The Banana Zone Series - AXL Buy the Dip Levels (10 of 10)Alt-season is here. BTC breakout has been confirmed. If you missed positioning for the next level of exponential moves, what are some of the buy the dip zones while still have time for the bigger moves into the banana zone.
We continue the series with Axelar ( NYSE:AXL ).
As you can see in my analysis, pull backs to $0.7397 and below is my new accumulation zone. I will initiate some leveraged longs for new trades in preparation for the moves to the banana zone in the alt season.
For more aggressive traders, $0.76 and below can be the trigger longs with tight stops.
Not a financial advice so DYOR.

AXLUSDT 2DAXL ~ 2D
#AXL We would say Bullish on this Token once it breaks the resistance line of this descending pattern.

AXL 8R Trade Idea with Entry, Targets, and Stop LossAXL is down from entry and has tagged the previous weekly entry that sent price down 32% and then up 500% (47 cents entry to 32 cents low, and finally a rally to $2.7). Price has retraced this move back to the previous entry of 47 cents AND made another weekly entry at 57 cents.
Targets based on the risk from that entry have been drawn.
Yellow Stop loss of -20% is based on previous lows.
Orange stop loss of -33% is based on how low price went after the previous weekly entry of 48 cents before the rally (-32% from weekly entry)
