Alibaba - Preparing a major buying opportunity!🥇Alibaba ( NYSE:BABA ) creates a major break and retest:
🔎Analysis summary:
For the past three years, Alibaba has perfectly been respecing all structure. And with the recent retest of a major resistance, Alibaba is now heading for a decent correction. But with the emerging bullish break and retest, Alibaba will soon create a major reversal.
📝Levels to watch:
$135
SwingTraderPhil
SwingTrading.Simplified. | Investing.Simplified. | #LONGTERMVISION
BABA

BABA – Breakout Follow-Through | Wave 5 In ProgressContext
- Weekly and daily timeframes
- Multi-year base already completed
- Prior impulsive advance followed by a controlled Wave 4 retracement
- Breakout confirmed last week
What I see
- Wave 4 pullback resolved cleanly
- Breakout last week confirmed the end of the corrective phase
- Price has advanced +20% from the breakout area in the last two weeks
- Momentum accelerated after price rejected a pullback toward the breakout zone
- Yesterday’s near +4% close and strong pre-market action signal continued demand
- Structure is now consistent with an active Wave 5 advance
What matters now
- The 50-day MA and former breakout area near $156 should now act as support
- Holding above this level keeps the impulsive structure intact
- Next resistance sits at the prior Wave 3 high around $192
- A clean break above $192 confirms Wave 4 completion beyond doubt
Buy / Accumulation zone
- Initial breakout already played
- Ideal adds come only on controlled pullbacks toward support
- Risk remains clearly defined against the recent higher low
Targets
- Wave 5 target remains the $230 area
- This level aligns with the next major upside reference within the broader reversal
Portfolio note
- NYSE:BABA currently represents ~3% of my portfolio
- Comfortable holding this position into 2026
- Acts as a solid diversification hedge versus the US market

BABA: holding the mid-term support NYSE:BABA price is still holding the mid-term support zone outlined in the October update (see "previous" section bellow) and continues to act constructively. The structure suggests a potential start of a new uptrend toward the next target resistance zone at 205–230.
Chart:
As long as price holds above 155 in the short term and above the January lows, I am expecting the right-hand side of a new base (from the October highs) to form, with price following through toward 200+.
Previously:
• On macro support (Jun 24):
www.tradingview.com
• On potential upside reversal (Jul 15):
www.tradingview.com
• On support and bullish corrective structure (Aug 19):
www.tradingview.com
• On bullish structure (Aug 29):
www.tradingview.com
• On mid-term support (Oct 13):
www.tradingview.com

$BABA Breaking Out Of A Bull FlagAlibaba has been trading within a downward channel for last few months, but the structure still looks corrective due to the clear overlaps. Because of that, traders can still watch for a potential turn higher, especially now after a rebound from 147.68 support area, which was also the high back in March 2025. If price can close and finish the day out of a downward channel, as well as above the bullish level at 163.94, then another fifth wave higher could unfold.
At the same time, it is important to keep an eye on 134.35, as a break below that level would question the impulsive trend. Also note the weekly chart, which suggests the market may be in the later stages of wave C, with potential strong resistance later this year near the 78.6% retracement, slightly above the 200 level.
Highlights
– Overlapping structure suggests the move lower is corrective
– Key support to watch is around 147.68
– Daily close above 163.94 would open the door for wave five higher
– Invalidation sits at 134.35
–

BABA: Multi-Year Rounding Bottom Breakout — Wave 4 Support CheckThis chart for Alibaba (BABA) showcases a massive multi-year accumulation pattern, specifically a "Rounding Bottom" or "Cup" formation that began in late 2022. From an Elliott Wave perspective, the stock appears to have completed a primary Wave 3 impulse peak near the $190 level in late 2025 and is currently in the late stages of a Wave 4 corrective pullback.
The long-term outlook for BABA remains highly bullish as it successfully transitions from a multi-year basing phase into a structural uptrend. The recent pullback from the October 2025 highs represents a textbook Wave 4 correction, which has found precision support at the 0.382 Fibonacci retracement level ($143.58). This level aligns perfectly with the breakout point of the major rounding base, transforming old resistance into new support.
Key Technical Levels:
* Support Zone: The $143 - $150 area is critical; as long as the pivot at point 4 holds, the impulsive structure remains intact.
* Wave 5 Target 1: A 1.0 Fibonacci extension projects an initial target of $205.42, which would reclaim the 52-week highs.
* Wave 5 Target 2: The primary 1.618 extension sits at $242.59, aligning with major historical supply zones from early 2021.
* Invalidation: A sustained daily close below the Wave 2 low (approx. $70-$80) would invalidate this specific count, though the $143 level is the immediate "line in the sand" for bulls.
Projected Outlook:
The current price action at $150.96 is forming what looks like a bullish consolidation (handle) following the massive cup breakout. With cloud and AI demand accelerating revenue growth into 2026, the fundamental narrative supports a re-rating toward the $200+ consensus analyst targets. Traders should watch for a breakout above the Wave 3 peak to confirm the start of the final fifth-wave leg higher.

$BABA - Falling Wedge BreakoutAlibaba ( NYSE:BABA ) continues to respect classic trading patterns.
We’ve seen a number of bullish continuation patterns (falling wedge & bullish pennant) before, each one ended up with a sharp growth.
At the moment the price is forming another Falling Wedge above the $146 key support. As long as Baba holds above this area, the priority of price movement is strictly UPWARDS .
Losing $146 would invalidate this setup.

BABA trade ideaI think entry area between 125-140 if falling wedge broken, its strong support there with 200ma and MACD, PT +200.

BABA🌎Alibaba's AI Ambitions Gain Momentum: Qwen's Record-Breaking Launch and Strategic Investments
Alibaba is experiencing strong growth, fueled by the impressive success of its AI assistant, Qwen. Just a week after the public beta release, the app has surpassed 10 million downloads, marking the fastest launch of any such tool in history.
This success signals the company's decisive entry into the consumer AI market and strengthens its position as a direct competitor to ChatGPT and other global leaders in generative AI.
Why Qwen is More Than Just a Chatbot
The company positions Qwen as an "intelligent gateway to everyday life."
Unlike many Western subscription-based models, Alibaba is emphasizing a freemium model and deep integration of AI into its ecosystem. Plans include implementing "agent-based AI" features to automate tasks such as food ordering, travel booking, and shopping on platforms like Taobao.
The app is currently available in China, but an international version is expected soon.
Sizable Investments and Financial Results
To support its ambitions, Alibaba is mobilizing significant resources. The previously announced AI investment plan of RMB 380 billion (~$53 billion) over three years demonstrates a scale comparable to that of American IT giants.
These investments are already bearing fruit:
Revenue Growth: In Q1 FY26, revenue from the Cloud Intelligence division grew 26% year-on-year to RMB 33.4 billion, largely driven by strong demand for AI computing power and cloud services.
Explosive Growth in AI Products: Revenue from AI-based products has shown triple-digit growth for the eighth consecutive quarter, demonstrating the active adoption of technology by enterprises in China.
Increasing the profitability of the cloud business, which is under pressure from the high cost of building AI infrastructure, remains a key challenge.
Technological Innovation in the Face of Restrictions
In response to US export restrictions, Alibaba is finding creative ways to improve efficiency. Aegaeon's recently introduced GPU pooling system dramatically reduces dependence on Nvidia chips. During beta testing, this technology reduced the number of GPUs required by 82%—from 1,192 to 213—to support dozens of AI models.
This achievement highlights the company's ability to mitigate the impact of sanctions through software optimization.
Alibaba is one of the few global platforms offering a full stack of AI services. Strategic investments in promising areas such as international expansion and partnerships (for example, upcoming XPeng robotaxis trials using Amap maps in 2026) provide the foundation for long-term growth.
On the downside, the current stock valuation is already overly optimistic, and sustaining accelerated growth requires continued high investment and impeccable strategy execution.
In our view, we are in Wave 4, where after a strong momentum, the stock needs a breather to continue its growth.
In general, we don't see the stock being distributed. Many factors point to a correction to future growth.

BABA – Weekly Structure UpdateThesis
BABA, after multi year base, is completing an intermediate corrective phase within a broader bullish reversal structure.
Context
- Weekly timeframe
- Multi-year base completed
- Price trading above key long-term levels
What I see
- Impulsive advance followed by a controlled pullback
- Structure suggests intermediate wave (4) nearing completion
- Pullback is respecting prior breakout area
- Pullback is holding rising moving-average support
- Consolidation is forming above former resistance
What matters now
- Structure remains constructive while the recent higher low holds
- Resolution of consolidation should define the next directional leg
Buy / Accumulation zone
- Current pullback range aligned with wave (4) retracement
Targets
- Intermediate upside reference near the $230 area

Alibaba (BABA) - Structure Reload Before the Next Expansion?📈After a powerful impulsive leg higher, BABA is now doing exactly what strong trends are supposed to do: correct, not reverse. Price is pulling back into a key structural support, aligning perfectly with the lower bound of the rising blue channel.
⚔️This area is critical. As long as this structure holds, the market remains overall bullish, and pullbacks are viewed as opportunities rather than threats.
The plan is simple and disciplined:
🏹I’ll be looking for trend-following longs around the intersection of structure support and the rising channel, with continuation toward the upper channel and higher levels.
Only a clean breakdown below structure would invalidate this bullish scenario. Until then, the trend remains intact and patience is rewarded.
Is this consolidation the calm before the next expansion leg? 🤔📊
⚠️ Disclaimer: This is not financial advice. Always do your own research and manage risk properly.
📚 Stick to your trading plan regarding entries, risk, and management.
Good luck! 🍀
All Strategies Are Good; If Managed Properly!
~Richard Nasr

BABA: when China allows growth againAlibaba remains one of the most undervalued mega-cap tech companies globally. After years of regulatory pressure and weak macro conditions in China, the company is entering a stabilization phase. Regulatory risks have eased, and Chinese authorities are signaling support for the technology sector and domestic consumption. Alibaba continues to generate strong cash flow, operates a massive ecosystem across e-commerce, cloud, and logistics, and actively executes share buybacks, reducing float. At current levels, the market is pricing in excessive pessimism, creating asymmetric upside if macro conditions improve.
From a technical perspective, price is trading inside a rising channel. After a strong impulse, the market moved into a corrective phase, forming a swing zone. Price remains above key EMA levels, confirming a valid medium-term uptrend. The current area represents a buyer interest zone aligned with structural support and Fibonacci levels. Declining volume during the pullback supports the idea of a healthy correction rather than trend reversal.
Trading plan: as long as price holds above the current support zone and confirmation appears, long positions become attractive. The first target is a return to previous highs, followed by Fibonacci extensions. Medium-term targets align with the upper boundary of the channel. A breakdown below the swing zone would invalidate the bullish scenario and signal deeper correction.
The best opportunities often appear when fear fades but confidence hasn’t returned yet.

ALI BABA : SELL OR BUY ??The last time that the price was around 100 $ was at the IPO (2014) and then between AUG 2016- JAN 2017
TOTALL ASSET :
IPO(2014) : 41.27 B
2016: 73.55 B
2017: 114.01 B
2020: 257.86 B
2021 :276.25 B (UNTIL Q3)
GROSS PROFIT :
IPO(2014) : 8.12 B
2016: 14.05 B
2017: 20.66 B
2020: 42.09 B
2021: Q1 + Q2 +Q3 =37.25 + Q4(9.03)(IF WE CONSIDER SAME AZ Q4 OF 2020) = 46.28 B
P/E FORWARD = 7.40 !!!
P/S =2.12 !!!
P/CASH FLOW = 0.10
P/B = 1.79
RETURN ON ASSET = 3.86%
QUICK RATIO = 1.65
DEBT / ASSET RATIO = .08
All these items show the prices are not permanent.

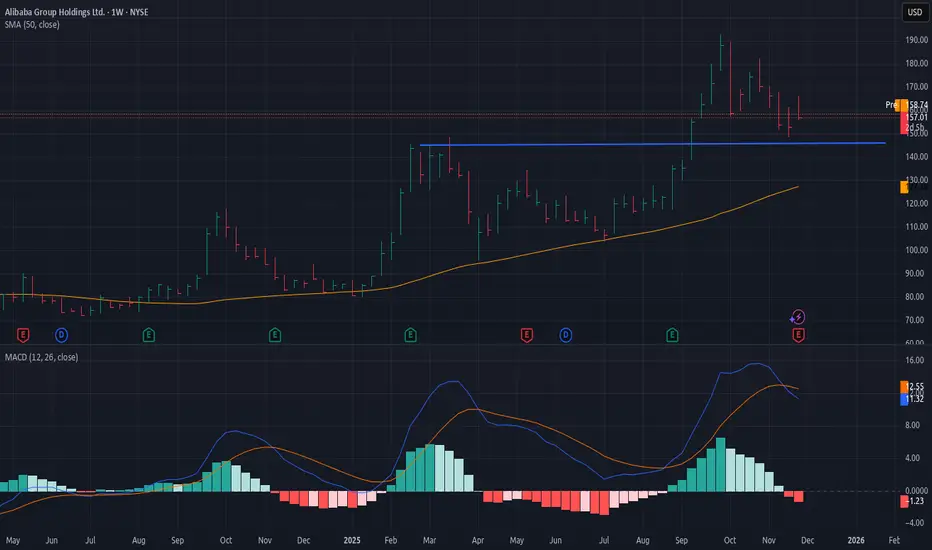
Alibaba (BABA) Weekly – BABA is holding above a major structural support zone and remains inside a rising channel from the 2023 lows. The bullish scenario activates only if price stays above support and reclaims key levels.
Entry Trigger:
• Break and close above 156–162 zone (confirmation of bullish momentum)
Targets:
• Target 1: 192
• Target 2: 219
• Target 3: 232
• Extended Target: 303
Invalidation / Stop Levels:
• Conservative stop: below 129
• Aggressive stop: below 140–142 (trendline support)
• Full bullish bias invalidated if weekly closes below 129
Why Bullish:
• Rising weekly structure
• Higher lows respecting trendline
• Strong demand zone between 129–142
• Clean upside imbalances toward 192 and 219
Bullish bias remains valid only as long as price holds above the 129 support zone. Reclaiming 156 is the key to upside continuation.

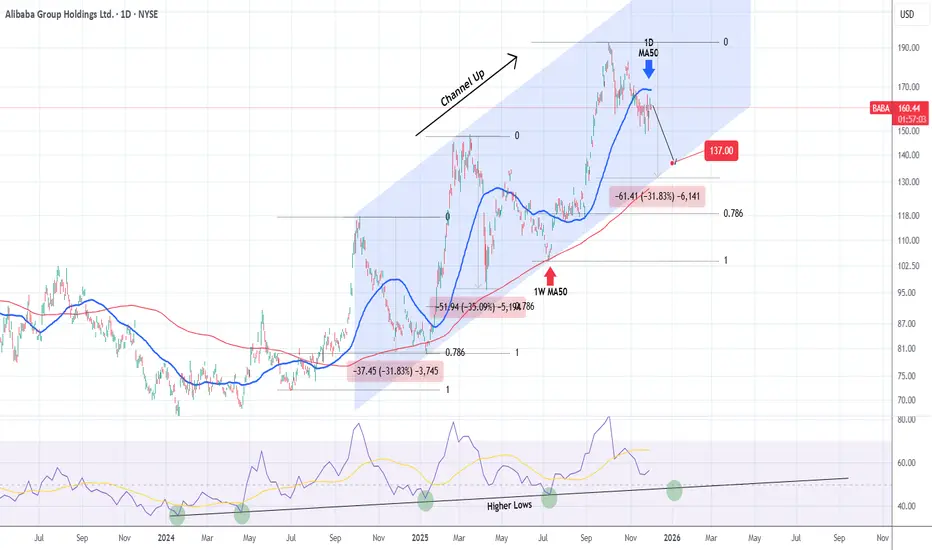
ALIBABA This correction isn't over.Alibaba (BABA) has been trading within a Channel Up since the October 07 2024 High. Right now it is on the 3rd Bearish Leg of this pattern, confirmed below the 1D MA50 (blue trend-line).
Both previous Bearish Legs touched the 1W MA50 (red trend-line) and the 1W RSI Higher Lows trend-line.
We expect that to happen at $137.00 (at least), which still puts the stock above both the 0.786 Fibonacci retracement level of the Bullish Leg and the -31.83% drop of the first Bearish Leg.
---
** Please LIKE 👍, FOLLOW ✅, SHARE 🙌 and COMMENT ✍ if you enjoy this idea! Also share your ideas and charts in the comments section below! This is best way to keep it relevant, support us, keep the content here free and allow the idea to reach as many people as possible. **
---
💸💸💸💸💸💸
👇 👇 👇 👇 👇 👇
BABA long-term TAOk Alibaba, it's in a good and strong uptrend on weekly time frame and it has a potential to continue its growth even the next year. Yes it has recently released its AI app, but don't be too excited yet, don't pay too much attention to the news, BABA is currently in distribution on mid-term which has started about a week ago, and any pump is a danger. Watch for $146 level to hold the support, if it's broken it may dive all the way to $130ish area.
Alibaba Group Holding Limited ($BABA) Announced Q4 Earnings Alibaba Group Holding Limited (BABA) announces her earnings reports today before the bell. The stock is up 5% with RSI at 47 NYSE:BABA shares are eyeing the $200 resistant should bullish momentum increase.
In the news, Alibaba reported cloud computing revenue up 34% year-on-year in its fiscal second quarter, beating market expectations. Investors are focused on Alibaba’s cloud division which books its revenue related to artificial intelligence.
In September, the company said it plans to increase spending on AI models and infrastructure development, on top of the 380 billion yuan ($53 billion) over three years it announced in February. Alibaba said on Tuesday it has spent around 120 billion yuan in capital expenditure toward AI and cloud infrastructure over the past four quarters.
In 2024, Alibaba's revenue was 996.35 billion, an increase of 5.86% compared to the previous year's 941.17 billion. Earnings were 129.47 billion, an increase of 62.36%.
Analyst Summary
According to 13 analysts, the average rating for BABA stock is "Strong Buy." The 12-month stock price target is $187.31, which is an increase of 16.54% from the latest price.
About BABA
Alibaba Group Holding Limited, through its subsidiaries, provides technology infrastructure and marketing reach to help merchants, brands, retailers, and other businesses to engage with their users and customers in the People's Republic of China and internationally. It operates digital retail platforms under the Taobao and Tmall names; wholesale marketplaces through 1688.com and Alibaba.com; global e-commerce platform under the AliExpress name; e-commerce platforms under the Lazada, Trendyol, and Daraz names;

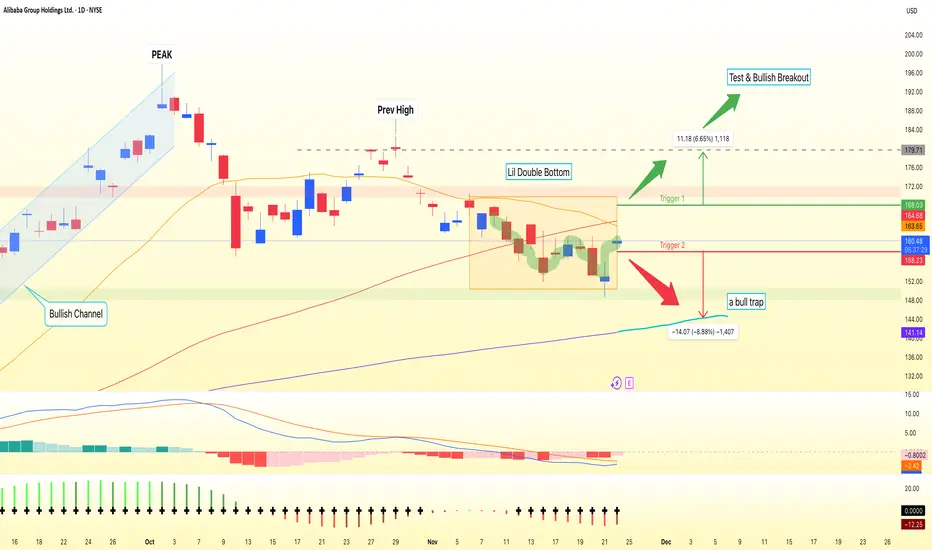
BABA Breakout WatchBABA’s daily chart has shifted from a strong August–October rally into a corrective phase, with price now around 160 and printing a clear sequence of lower highs and lows. Price sits below the MA20 and MA60 but still above the rising MA120 near 141. This keeps the broader uptrend technically alive while short-term pressure remains bearish. A potential Double Bottom is developing in the 150–153 demand zone, with a strong bullish reaction from the second trough and a neckline around 168.
For bulls, the key is clearing the moving-average “ceiling” first. A daily close above 165 would show that buyers are absorbing supply at resistance and open the path toward a retest of the 168 neckline. A confirmed daily close above 168 would validate the Double Bottom and put 175–179 initially, and then 184, on the radar as measured-move targets. For this bullish idea, a sustained move back below 158, and especially a break under 150, would be a clear invalidation and shift focus back toward 148–144 near the MA120.
If price instead loses 158 on a daily close without ever reclaiming 165, the bounce looks more like a relief rally inside the downtrend, with sellers likely pressing for a deeper test of 150 and potentially 144. Until either 165 breaks topside or 158 fails, expect noisy consolidation between support at 150 and resistance near 165. This is a study, not financial advice. Manage risk and invalidations.
Thought of the Day 💡: Let the level confirm the idea, not the other way around.
------------------------
Thanks for your support!
If you found this idea helpful or learned something new, drop a like 👍 and leave a comment, I’d love to hear your thoughts!
High 80s soon and will it rally towards 200?After a long break its back again with AI, self-driving software and much more. This can go down to high 80s in the near term. I think next year this can hit low 200s. All the best!!
Not a financial advice.

$BABATechnical Outlook for NYSE:BABA : Navigating Key Levels After a Strong Rally
NYSE:BABA has demonstrated significant strength over the past several months, establishing a well-defined and respected upward trendline on its chart. This consistent pattern of higher lows indicates sustained bullish momentum and has been the foundational support for the rally.
The key to determining the next major directional move lies in observing how the price interacts with critical Fibonacci retracement levels, drawn from the stock's previous significant swing low to its recent high.
Key Support Levels to Monitor:
Our primary support levels, derived from the Fibonacci sequence, are:
First Support (0.382 Fib): $144.52 - This is the most immediate and crucial level. A bounce here would suggest the underlying bullish trend remains intact, with the momentum merely pausing.
Second Support (0.5 Fib): $129.65 - This level represents a halfway retracement of the recent upswing and is a common area for buyers to re-enter.
Major Support (0.618 Fib): $114.78 - A deeper retracement to this level would signal a stronger pullback but would still keep the primary bullish structure alive from a classical technical perspective.
Critical Scenario for a Trend Reversal:
The most immediate threat to the current bullish structure would be a decisive break below the $144.52 level. Such a move would accomplish two technically significant events simultaneously:
It would breach the 0.382 Fibonacci support.
It would likely break the upward trendline that has guided the stock higher for months.
A confirmed break below this confluence of supports would be a strong indicator that the uptrend has exhausted itself in the short term, opening the door for a more pronounced downtrend. In this scenario, the market would then likely target the next supports at $129.65 and $114.78.
Ultimate Major Support:
Beyond the Fibonacci levels, the psychological and technical $100 mark stands as the ultimate major support. A decline to this level would represent a full retracement of the recent bullish wave and would be a critical make-or-break zone for the long-term outlook of the stock.

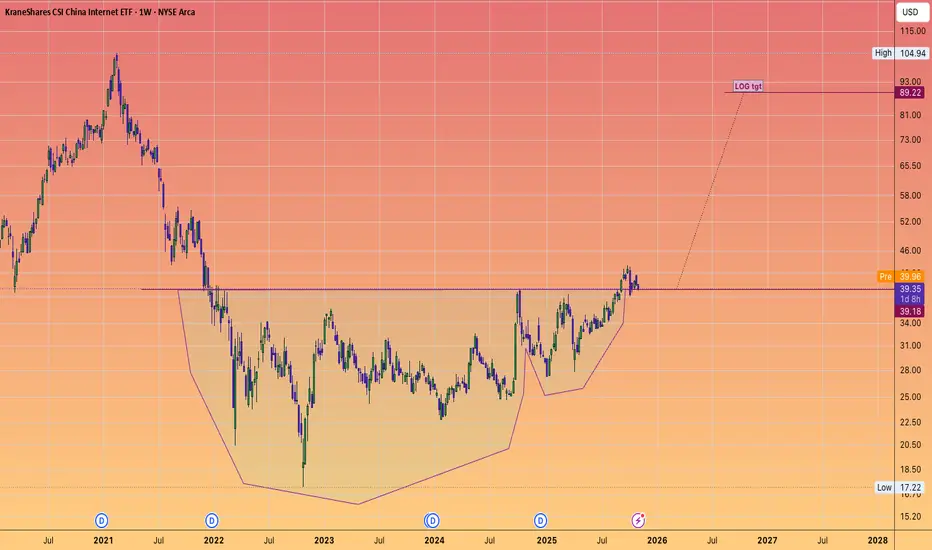
CHINA INTERNET ETF $KWEB to $90Components:
1 ALIBABA GROUP HOLDING LTD 11.02%
2 TENCENT HOLDINGS LTD 10.94%
3 PDD HOLDINGS INC 8.31% #PDD
4 BAIDU INC-CLASS A 5.07%
5 JD.COM INC-CLASS A 4.97%
6 MEITUAN-CLASS B 4.95%
7 JD HEALTH 4.60%
8 KUAISHOU TECHNOLOGY
9 TENCENT MUSI-ADR 4.24% #TME
10 KANZHUN LTD - ADR 4.03% #BZ
Clean Cup and Handle
China stocks can continue their recovery
BABA Breakout Watch: Close Above 171 Opens Path to 190Alibaba (BABA) ripped higher from late August and topped near $190 in early October. Since then, price has been correcting inside a descending channel while holding above the 60-day moving average. Short-term momentum has cooled (MACD histogram negative), but the broader structure remains constructive: buyers defended the $158.00 demand zone and price is compressing toward the channel’s upper boundary.
Primary path: I’m looking for a daily close above ~$171.00 (break and hold over the channel top / short-term resistance) to signal a continuation of the prior uptrend. If confirmed with rising volume, the next waypoint sits near the upper band/near-term supply around $175.00–$180.00, followed by a retest of the October highs into $190.00–$191.50. That area remains the key supply zone where the last rally stalled.
Alternative: If buyers fail and $158.00 gives way, the corrective leg likely extends. A decisive break of that floor would put the lower channel line in play and opens room toward the next major support clustered around the 120-day context near $140.00. For positioning, longs can lean on $158.00 as the clean invalidation; below there, the bullish thesis is off the table.
This is a study, not financial advice. Manage risk and invalidations

Jd catalysts are in place for $43 Interestingly enough , the technicals are aligning perfectly for a sharp move in the coming 2-3 weeks for JD. The breakout of a large wedge , retest of the breakout and consolidation near the support are all bullish signs. The 1.618 fib extension for wave 3 takes it to about $43. Low and behold, this level aligns with the red downsloping trendline that connects 2 previous highs.
All this needs is a spark, which will be the tweet Donald Trump will put out once the deal is finalized. His photo op with Xi will be the icing on top. I wouldnt be surprised to see a nice pop into the previois range around $35-$37. The subsequent earnings in mid Nov could be another leg in what will be a journey to $43.

Alibaba Weekly Elliot Waves AnalysisBABA is currently in Wave 5. I believe BABA Wave 5 will be an ABC correction. With that being said, I expect a relief pump (wave B) to happen which will last for 1-2 weeks before we continue dumping. I have buy orders set for $85/$86 and at worse, $58. $100 support looks weak based on the lower Fibonacci targets. Be diligent with this one!
(Side Note: Wave 1 was also an ABC correction which is why the last wave will be similar to the first.)
You can learn more about this analysis by researching ABC corrections and Zigzags. Thank you!
