BABA updateGood earnings for alibaba can lead to a monster rally for wave 3. Keep on watch the 20day/50day MA cross. Heres the chart ...
Note : Yesterday HSI broke out of the flag right at 50dayMA... is it the beginning of the china reversal ?...
BABA

US Stock In Play: $BABA (Alibaba Group Holdings Ltd.)$BABA is caught in a 15-month downtrend channel but there could be short term upside opportunity ahead.
trading above Q2 earnings VWAP & 10/20MA. also attempted to re-capture its 50MA, with MA convergences taking place. price action behavior is very similar to oct'21 period.

$BABA Reversal in Play Took a position @ 126
MACD turned positive.
CMF is positive
Holding ema cloud beautifully
Needs to hold SMA10 to keep the trend bullish.

$UPS $BA $DIS $BABA I OptionsSwing WatchlistUPS 4H I UPS possible ascending triangle. Seems to be testing the bottom of the pattern we can attempt to catch the bottom on this name with a tight stock below $206.
BA 1H I The breakout we wanted above $219 happened last week. BA can hit $230 resistance this week before pulling back as earnings approach on 01/26.
DIS 2H I Strong bounce on DIS at the bottom of our channel. We've picked up unusual activity betting it could fill the gap to $155. Watching a break above 01/14's high.
BABA 1D I Jumped to a high of $138.70 last week. Retraced as the markets pulled back and it is now holding support above $130. Possible breakout on the 15M time frame.

Baba Possible bottom around 100$Baba Possible bottom around 100$… excluding ~20$ of cash per shares, it will reach a 10PE..

baba accurate forecastmy thoughts were accurate for the 3 Chinese stocks and now we are waiting for re-entry after the decline.
the positions were closed half yesterday and half before yesterday trading day
disclaimer

$FXI — SHORTDrop in vlume on the way up, doji forming, gaps open below the market, oscillators wayyy overbought — this is ripe for puts and I bought puts on BABA.

BABA Good buyBaba after all the news is down 70% and is at higher time frame support.
A good buy for 20% and more targets, Also a good buy for long term.

LIFETIME OPPORTUNITY IN CHINESE STOCKS ?BZUN :
Chinese stocks have been beaten down badly. Is this the opportunity of a lifetime to buy them cheap? I don't know.
Tell me what you think.
I like the chart and it looks like we could have a substantial bounce here. I'm buying some January calls.
All resistances mentioned on the chart are potential targets. Let's regain the 50 MA and see.
NIO and BABA charts look also good.
Trade safe!

Bullish $BABA setup$BABA Daily chart bullish setup, we have been calling out $BABA all of last week for a move higher based out of the TTM Squeeze and the bullish flow we saw on our Options flow in $KWEB the Chinese Tech ETF.
$BABA has been the laggard along with other Chinese name all of last year when Tech stocks were making new all time highs. In the blood bath in tech sector last week $BABA , $JD , $BIDU stood well and were showing relative strength (possibly new money flowing into Chinese stocks). $BABA has TTM Squeeze formed here and the momentum is positive here looking for a move higher into the $140 1.618 extension and then opening of the gap $148. $BABA has gap fill job at $161. We are long $BABA calls Feb 18th 2022 strike and staying in it.

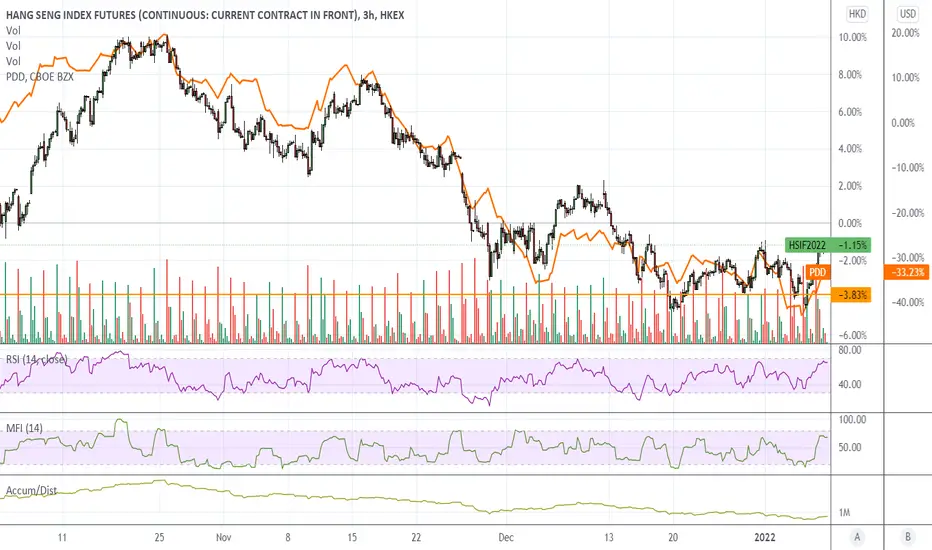
Why I keep looking at HSINot sure why I'm responding to a troll, but here's the reason why I track HSI....
The orange line is PDD. I don't trade HSI futures, PDD options have better return. BABA chart is similar.
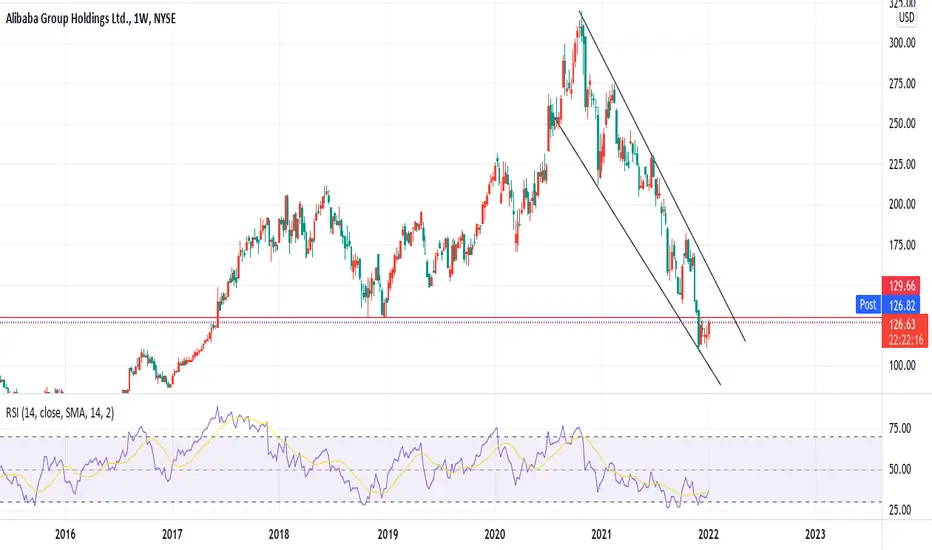
BABA Decided to go South..!In the weekly charts, you clearly see BABA broke its Bullish trend line after 297 weeks and finished the pullback, and continues its way to the south.
I believe it will see 150 and 130 if it closes below 170.
if you are eager to buy the dips be careful, and wait for coming dips, do not jump the gun until a clear reversal pttern.
Most Chinese stocks build strong bearish trends..!


BABA reversal ?We can see that BABA made a 5 Waves down on daily. BABA recently made the 1-2 to setup for the reversal. We can see a big green candle near demand with the volume validating the move. BABA retraced perfectly to the 0.618 for wave 2. It also broke neutral and 20day MA is reclaimed and curling up.
However, overall its still making higher lows and we don't know if HSI reversed. With all China uncertainty, becareful and manage risk.
Is this the first wave on daily for the reversal or only intra waves for earnings ? Is it the floor ? We don't know but it looks good keep it on watch...

Open SesameAlibaba found strong support and wants a reversal. One of the stocks that showed considerable strength during the recent market turmoil.

$BABA - Weekly TF analysisAli Baba holdings looks to be at historic levels...it has completed a 5 wave move from 2015 to 2020 and has now retraced 61.8% of that move in a 5 wave impulsive move down.
This is a great place to add some Chinese e-commerce exposure for the long term with weekly RSI having been oversold in sept and now forming a higher high as price formed a lower low.
With a a low to trade against, the R:R here is fantastic, with downside risk at 108.70 and upside targets is 175 and 240.

$baba #alibaba #stockstobuy $nasdaq #chinese #stockbaba out of triangle and above of 21 and 10 DMA ..
keep calm an you will be reward soon..
my aim to close the gap at $160
the worst have finished for Chinese big-tech
disclaimer

Have Started Buying BABA Here.I don't see this company shutting its doors, stock down 60% and this looks like a solid weekly bottom forming. Low time frames look great also. Not advise archiving thoughts.
Alibaba signaling a reversal?BABA has spent the last year in a bear market. It's down about 60% from it's highs. Based on the charts, the sellers look exhausted and most of the downward momentum has been spent. There's bullish divergence on the daily and 4hr charts. It may take a couple months for bullish momentum to return in force, but it looks like we are at, or near the floor. I'm anticipating short-term bullishness followed by perhaps one more low, and then solid growth.
----------------------------------------------------------------
These are my personal views and not financial advice. Please do your own research before investing.
I'd love to hear your thoughts, ideas and feedback. Feel free to Comment and I'll try and get back to you quickly.
If you appreciated this analysis, consider Liking or Following . Thanks!

📌🦤🦤 Update: $PDD Weekly$PDD is one of (if not) my favorite charts and companies for 2022. Growth in digital commerce/advertising, unique product and deep discount given China turmoil. Weekly bullish divergence ...
Jan ‘23 $100C 💡
$BABA $KWEB $ASHR $SPY $QQQ #Pinduoduo #China #Stocks #Options #Trading

BABA, 4 Hrs, Bat Harmonic PatternMYX:BAT , 4 Hours
BABA, 4 Hrs, Bat Harmonic Pattern
Buy @ 111.43 - 108.82
Sell @ T1: 117.11 , T2: 122.12
Stop Loss @ 106.08
Please. Read the disclaimer, and do your own diligence.
------------------
DISCLAIMER:
I am not a financial /investment advisor. All information I am sharing here is for entertainment purposes only and should not be considered personal investment advice. While the information provided is accurate, it may include errors or inaccuracies. Please, do your diligence when it comes to investing or trading in the market. You are responsible on your choice. Thank you


Alibaba Analysis 04.01.2021Hello Traders,
welcome to this free and educational analysis.
I am going to explain where I think this asset is going to go over the next few days and weeks and where I would look for trading opportunities.
If you have any questions or suggestions which asset I should analyse tomorrow, please leave a comment below.
I will personally reply to every single comment!
If you enjoyed this analysis, I would definitely appreciate it, if you smash that like button and maybe consider following my channel.
Thank you for watching and I will see you tomorrow!
