Alibaba - Preparing a major buying opportunity!🥇Alibaba ( NYSE:BABA ) creates a major break and retest:
🔎Analysis summary:
For the past three years, Alibaba has perfectly been respecing all structure. And with the recent retest of a major resistance, Alibaba is now heading for a decent correction. But with the emerging bullish break and retest, Alibaba will soon create a major reversal.
📝Levels to watch:
$135
SwingTraderPhil
SwingTrading.Simplified. | Investing.Simplified. | #LONGTERMVISION
Bababuy

ALI BABA HIGH PROBABILITY SETUP SOON!!!🚨 BABA HIGH PROBABILITY BUY SETUP 🚨
* Here We Can See Clearly The Next Potential Moves For BABA Coming Hours/Days.
* Keep Your Eyes Close On Your Trading Positions.
* Happy PIP Hunting Traders.
FXKILLA.

ALIBABA HIGH PROBABILITY SETUP SOON!!!🚨 BABA HIGH PROBABILITY BUY SETUP 🚨
* Here We Can See Clearly The Next Potential Moves For BABA Coming Hours/Days.
* Keep Your Eyes Close On Your Trading Positions.
* Happy PIP Hunting Traders.
FXKILLA.

BABA Perfect long positionNYSE:BABA is at a strong level ahead of its next upcoming earnings, I am looking for it to continue within its already formed parallel channel on the weekly chart. The daily shows a strong rejection of its 50ema, consequently breaking a previous swing high. the break indicates possibility of bullish momentum through the level. The current consolidation phase into the long term trend and the consolidation occurring on the long term volume profile POC, all act as positive confluence to the general idea of a mid-long term buy position on BABA. CN50 is also showing great strength on the monthly chart, which is a great confluence with BABA's overall performance.
Constriction of Bollinger daily bands is an added confluence, indicating the potential for increased volatility and a large move to come out of this consolidation phase in the near term.
I have entered a large long position, with stops shown at levels shown on chart to allow the trade to breath in the midst of unexpected volatility around earnings etc. Stops and tp may be adjusted as conditions change.
Goodluck trading ;)
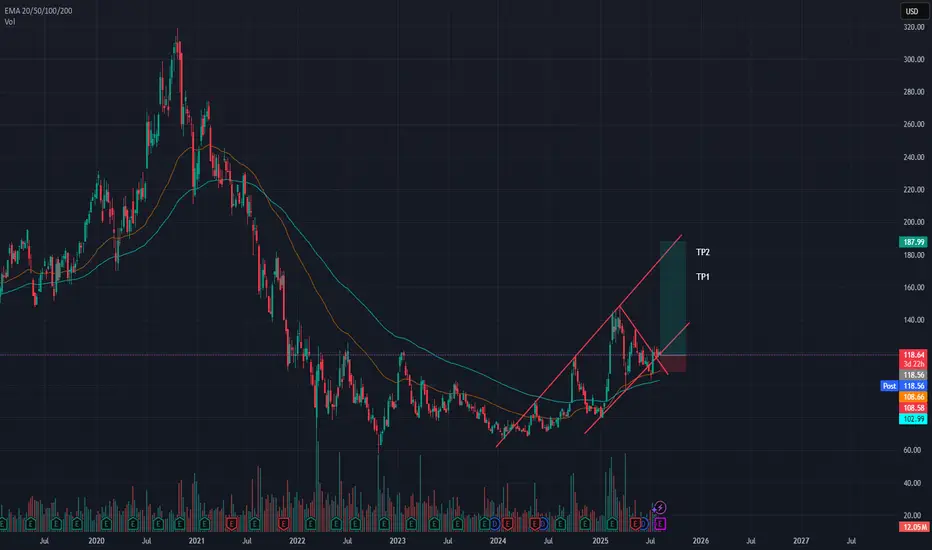
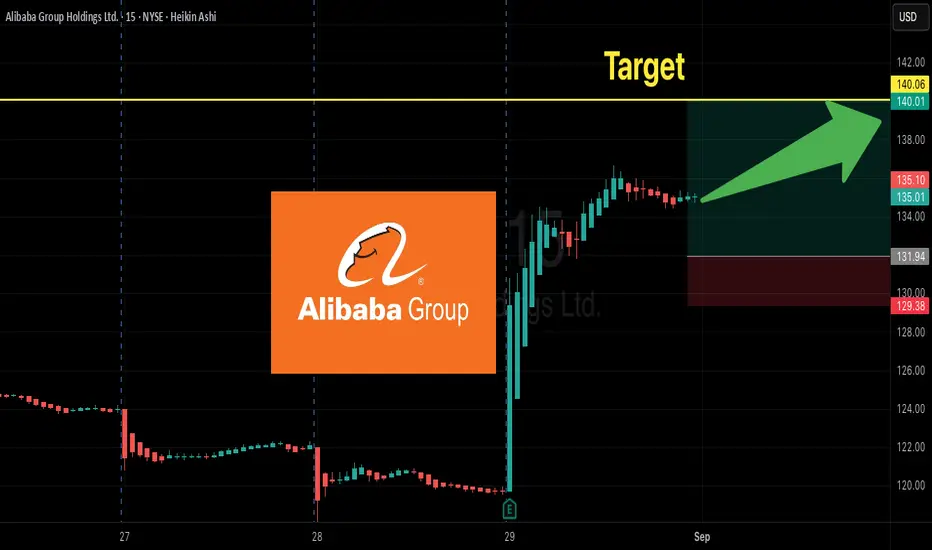
Ali BABA Potential Huge Up Targets ALi BABA have Potential Huge Up Targets with potential 3 years accumulation range from March 2022 to today 15 August 2025.
P&F Chart targets calculations
ATR 20 1 Box Size 3.5 calculated on 15-08-2025
Position Opened on 13-08-2025
News on 15-08-2025:
Saudi Investment Sold all 1.6 Million American Depository shares in BABA in Q2 2025 Ending its investment in the Company!!!!!!!
Lets see what this chart will unfold in the future
Alibaba - Here we have the final bottom!🏮Alibaba ( NYSE:BABA ) finally created its bottom:
🔎Analysis summary:
As we are speaking, Alibaba finally managed to create a long term bottom formation. Specifically with the recent bullish break and retest, bulls are picking up momentum. We just have to see a break above the current key resistance level in the foreseeable future!
📝Levels to watch:
$140
SwingTraderPhil
SwingTrading.Simplified. | Investing.Simplified. | #LONGTERMVISION

Alibaba | BABA | Long at $108.84Like Amazon, I suspect AI and robotics will enhance Alibaba's NYSE:BABA e-commerce, logistics, and cloud computing operations. There is some risk here, like other Chinese stocks, that they could be delisted from the US market if trade/war tensions rise. But I just don't think that is likely (no matter the threats) due to the importance of worldwide trade and investment. I could be way wrong, though...
NYSE:BABA has a current P/E of 14.2x and a forward P/E of 2x, which indicates strong earnings growth ahead. The company is very healthy, with a debt-to-equity of 0.2x, Altmans Z Score of 3.3, and a Quick Ratio of 1.5. If this were a US stock, investors would have piled in long ago at the current price.
From a technical analysis perspective, the historical simple moving average (SMA) band has started to reverse trend (now upward), indicating a high potential for continued (overall) price movement up. It is possible, however, that the price may reenter the SMA band in the near-term - the $80s aren't out of the question - as tariff threats arise. But that area is another personal entry zone if fundamentals hold.
Thus, while it could be a bumpy ride and the risk is there for delisting, NYSE:BABA is in a personal buy zone at $108.84 (with known risk of drop to the $80s in the near-term).
Targets into 2028:
$125.00 (+14.8%)
$160.00 (+47.0%)

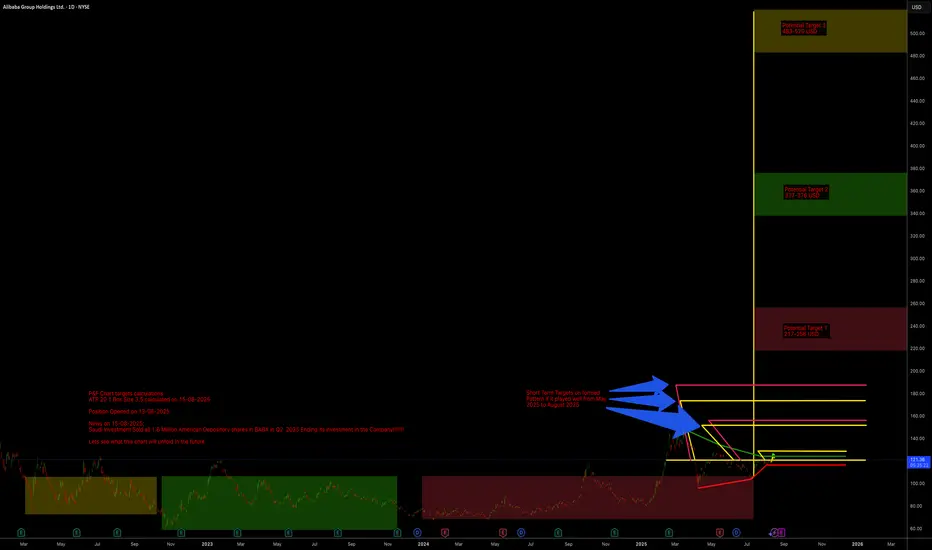
BABA About to EXPLODE—Weekly 140C Play—Don’t Miss Out
# 🐂💎 BABA WEEKLY OPTIONS ALERT (2025-09-01) 🚀📈🔥
### 📊 Multi-Model Consensus → **STRONG BULLISH**
* ✅ **Momentum:** RSI Daily 71 / Weekly 74 📈
* ✅ **Volume Surge:** 🔺 2.9x last week → Institutions loading bags 👜
* ✅ **Options Flow:** Calls ≈ 2.84x puts 💥
* ✅ **Volatility:** VIX \~15.3 → perfect for calls 🎯
---
### 🎯 Recommended Trade (Consensus Pick)
👉 **BABA 140C (2025-09-05)**
💵 Entry: \~\$1.59
🛑 Stop: \$0.95 (-40%)
🎯 Target: \$2.39 (+50%)
📏 Size: 1 contract (risk-adjust)
⏰ Entry: Market open
🔥 Confidence: 85%
---
### ⚡ Aggressive Play (OTM)
👉 **BABA 145C (\~\$0.84)**
⚡ Higher leverage, stronger flow, but faster theta decay ⏳
---
### 🕒 Risk & Exit Plan
* Close **by Thursday EOD** 🗓️ (avoid Friday theta/gamma trap)
* Stick to stop-loss & risk sizing 💡
* Watch for profit-taking after +9.8% last week 📉
---
📌 **Trade JSON (for algo/backtest nerds 🤓)**
```json
{
"instrument": "BABA",
"direction": "call",
"strike": 140.0,
"expiry": "2025-09-05",
"confidence": 0.85,
"profit_target": 2.39,
"stop_loss": 0.95,
"size": 1,
"entry_price": 1.59,
"entry_timing": "open",
"signal_publish_time": "2025-09-01 22:19:55 EDT"
}
```
---
\#️⃣ **Hashtags / Tags**
\#BABA #OptionsTrading #FlowTrading #StockMarket 🚀📈🔥
\#UnusualOptionsActivity #SwingTrade #TradingSignals #SmartMoneyFlow
\#CallOptions #WeeklyOptions #ChinaStocks
Alibaba - This chart is pretty bullish!🎁Alibaba ( NYSE:BABA ) will head much higher:
🔎Analysis summary:
After we saw the perfect creation of the rounding bottom on Alibaba, the trend finally shifted back to bullish. Especially with the recent bullish break and retest, Alibaba is now preparing for another major move higher. All we need now is simple bullish confirmation.
📝Levels to watch:
$140
SwingTraderPhil
SwingTrading.Simplified. | Investing.Simplified. | #LONGTERMVISION

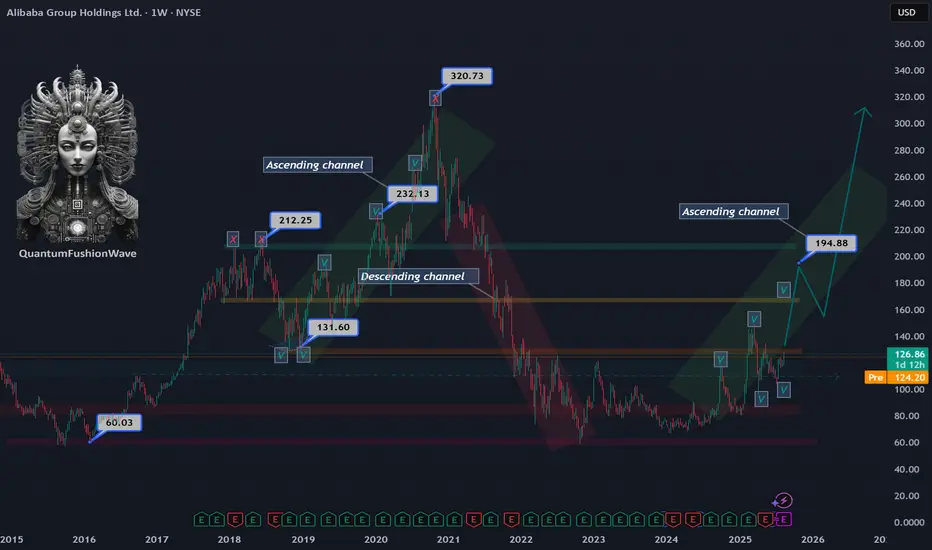
Alibaba’s Next Stop: $200Alibaba (BABA) is showing clear signs of strength as it trades around $126, confirming entry into a new bullish channel.
The stock rejected further downside at $95, a level that aligns with major resistance-turned-support zones from 2016, 2023, and 2024. This successful defense signals that market sentiment has shifted, laying the groundwork for a sustained move higher.
If momentum holds, BABA could rally aggressively into the $190–$200 range by November–December 2025, where a significant resistance zone from 2018 awaits.
Alibaba - A remarkable reversal!🛒Alibaba ( NYSE:BABA ) reversed exactly here:
🔎Analysis summary:
Recently Alibaba has perfectly been respecting market structure. With the current bullish break and retest playing out, there is a very high chance that Alibaba will rally at least another +20%. But all of this chart behaviour just looks like we will witness a major bottom formation soon.
📝Levels to watch:
$110, $135
🙏🏻#LONGTERMVISION
Philip - Swing Trader

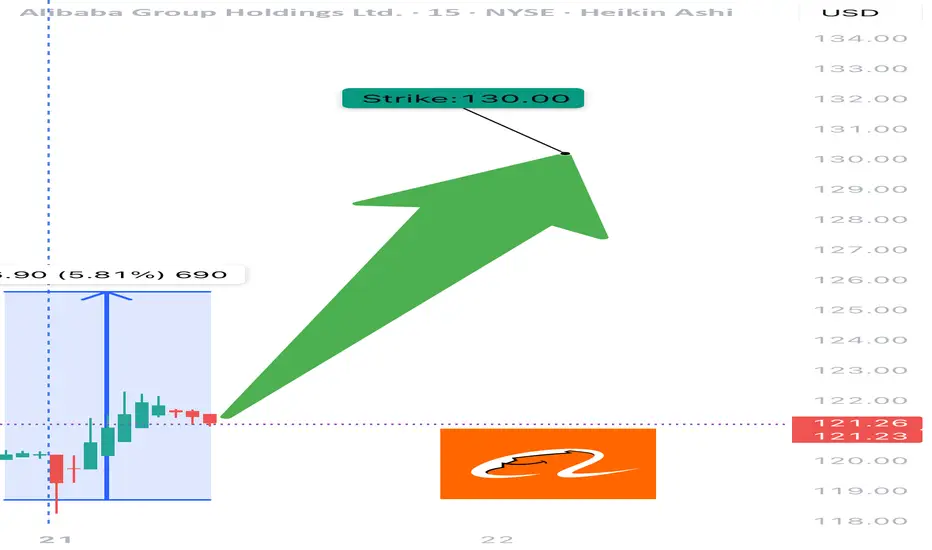
BABA WEEKLY TRADE IDEA – JULY 21, 2025
🐉 NYSE:BABA WEEKLY TRADE IDEA – JULY 21, 2025 🐉
📈 Strong RSI. Institutional Accumulation. Gamma-juiced upside.
Momentum is building — timing is key.
⸻
📊 Trade Setup
🔹 Type: Long Call
🎯 Strike: $130.00
📆 Expiry: July 25, 2025 (4 DTE)
💰 Entry Price: $0.52
🎯 Profit Target: $0.74 (📈 +42%)
🛑 Stop Loss: $0.30 (~40% Risk)
📈 Confidence: 70%
🕰️ Timing: Enter at Monday Open
📦 Size: 1 Contract (or scale accordingly)
⸻
🔍 Why This Trade?
✅ Daily RSI = 68.3 → Bullish momentum building
✅ Volume = 1.3x week-over-week → Institutional buying confirmed
📊 Neutral Call/Put Flow → Sentiment not overheated = better entry
🧠 Multiple models agree on MODERATE BULLISH bias
🌬️ VIX stable = ideal for controlled option premium entries
💎 Gamma risk manageable, but monitor price spikes at resistance near $130–132
⸻
⚠️ Risk Management Notes
🔸 RSI near breakout zone → monitor for fakeouts
⏳ Only 4 days to expiry → time decay risk accelerates
📉 Watch for rejection near key levels ($130.50–132.00)
🛑 Respect the stop: If momentum stalls early, exit fast
⸻
📌 Execution Strategy
🔹 Enter clean, single-leg naked call
🔹 Exit partial at 30% profit, full by Thursday unless breakout is strong
🔹 Avoid spreads: delta exposure preferred for upside spike capture
⸻
🏁 Verdict:
All models point to upside, but not full conviction.
This is a momentum + positioning trade, not a breakout gamble.
NYSE:BABA 130C – Risk $0.30 to Target $0.74 📈
Tight structure. Moderate aggression. Execute with precision.
⸻
#BABA #OptionsTrading #CallOption #WeeklyTrade #MomentumPlay #UnusualOptionsActivity #TradingViewIdeas #GammaFlow #FlowBasedSetup #Alibaba
BABA: Swing Trade Setup with 14% Upside🚨Swing Trade Setup: NYSE:BABA
Breakout = 🎯$162
Entry: $142.20
S/L: $135.65 (3to1 R/R)
Target: $162 (14% Higher)
NOT FINANCIAL ADVICE

BABA in a falling wedge (NEW)BABA stock has been in a long-term downtrend.
We're expecting the price to continue droping as it looks like it got rejected from the downsloping resistance line on the weekly timeframe.
What we can see on the chart is a pattern called a falling wedge.
Most likely the price will revisit $60 or lower but eventually we expect the breakout in Q2 or Q3 2023.
How to trade:
Enter long position if/when we get a breakout with a volume increase.
Final target and the take profit level are shown on the chart.
Good luck

BABA looks bullish. Are you ready?Are you still waiting for lower prices ?
Buying lows from 2016 was not cheap enough for you?
Baba created higher lows structure on weekly. Looks mega bullish. Expecting more upside soon
Target 1: 170 $
target 2: 200 $
Stop loss: 76,50 $

Alibaba Stock Surges 10% as Earnings Beat Expectations Shares of Alibaba Group Holding Ltd. (NYSE: NYSE:BABA ) are soaring after the Chinese tech and e-commerce giant reported quarterly earnings that exceeded Wall Street expectations. Alibaba’s latest financial results reflect strong growth in its cloud computing division, which includes artificial intelligence (AI) initiatives, and the broader market optimism surrounding its strategic moves.
Beating Estimates with Strong Revenue Growth
Alibaba posted revenue of 280.15 billion Chinese yuan ($38.5 billion) for the December quarter, marking a 7.6% increase year-over-year. The company’s earnings per share per ADS came in at $2.93, surpassing analyst expectations tracked by Visible Alpha. CEO Eddie Wu emphasized that Alibaba’s strategic focus on "user-first, AI-driven" operations has contributed significantly to its reaccelerated growth.
One of the standout aspects of Alibaba’s performance is its cloud computing segment, which saw a 13% year-over-year revenue increase. Notably, AI-related product revenue surged at a triple-digit rate for the sixth consecutive quarter, underscoring Alibaba’s position as a dominant player in China’s AI landscape.
Adding to the bullish sentiment is speculation that Alibaba may be collaborating with Apple (AAPL) to integrate AI-powered features into iPhones in China. Moreover, reports suggest that co-founder Jack Ma has re-established ties with Beijing, a development that could ease regulatory pressures and pave the way for smoother business operations.
Technical Outlook: Bullish Breakout with Strong Momentum
From a technical perspective, NYSE:BABA shares have been on an impressive run, climbing over 80% in the past year. At the time of writing, the stock is up 8.09% in intraday trading, signaling strong bullish momentum.
The breakout from a falling wedge pattern—a classic bullish reversal setup—has been a key catalyst in Alibaba’s upward trajectory. The Relative Strength Index (RSI) currently sits at 84, indicating that the stock is in overbought territory. However, with momentum building, further upside potential remains, particularly if BABA clears its recent one-month high.
In the event of a pullback, the 38.2% Fibonacci retracement level is acting as a solid support zone, providing traders with a potential re-entry point. A decisive breakout above resistance could trigger another leg up, reinforcing the stock’s bullish sentiment.
Conclusion
With cloud computing and AI revenues expanding at a rapid pace, alongside renewed investor confidence, the stock remains in a strong uptrend. While technical indicators suggest caution due to overbought conditions, a breakout above resistance could unlock further gains.

Alibaba Group | BABA | Long at $80.00Alibaba Group NYSE:BABA has the potential for massive growth. From a technical analysis perspective (and using my selected simply moving averages (SMAs)), the price of NYSE:BABA is reconnecting with its primary SMA. It could ride this area for a while as it consolidates further, but this often means a future reversal of the downward trend. Thus, at $80.00, NYSE:BABA is in a personal buy zone.
Target #1 = $89.00
Target #2 = $94.00
Target #3 = $107.00
Target #4 = $116.00
Target #5 = $305.00 (very long-term view...)

I'm GAGA for BABA!NYSE:BABA
🎯134🎯150🎯171
Five weeks of green candles for over 55%!
Road this one higher from the beginning and fully exited. Now that we are pretty extended and broke out of the Inverse H&S Pattern I'd like to see a pullback to retest the breakout at $115-118 for an entry back in.
- Green H5
- Volume GAP
- Wr% Up trending
- Inverse H&S breakout
- China has momentum (look for tariff news or earnings this week to provide a dip buying opp.)
Not financial advice

BABA: It is finally TIME!NYSE:BABA 🐼
China's GDP is soaring! 🚀
With the highest GDP growth since July 2023, all indicators are pointing to a BIG MOVE upwards. Check out the daily chart, friends—it’s looking bullish!
Catch you at George Washington 💵
Not financial advice

Why Alibaba is the Top Stock to Buy. Long-Term Investment 2025A very strong weekly demand imbalance at $85 took control on Alibaba NYSE:BABA Chinese E-commerce giant. Expecting a decent rally in 2024 and 2025. Long-term swing trade investment trade idea.

$BABA Primed for a Retest and Bounce! 80% Upside Potential!🚀 NYSE:BABA Primed for a Retest and Bounce! 80% Upside Potential! 🚀
🔍 Key Points:
Looking for a bounce after retesting the symmetrical triangle breakout
Awaiting the H5 Indicator to flip green for a bullish signal
Crucial to hold the volume profile shelf for continued upward momentum
Target Prices:
🎯 $107
🎯 $134
MM 🎯 $157

BABA looks to be bottoming I like $88 range as support buy, BABA has the look of a 2 year bottoming price accumulation.
First target $177.

Alibaba Group $BABA stock investment opportunity Alibaba Group NYSE:BABA stock is trying to pull back to strong demand imbalance on the weekly timeframe located at $86 per share. Patiently waiting for the correction before buying this giant Chinese stock.
