BAC Bank of America 1Y Chart Review - RSI/KC concernToday you can review the technical analysis idea on a 1Y linear scale chart for Bank of America (BAC).
It seems there is some action going on here with BAC reviewing the RSI and the Keltner Channel. This may be a concern.
If you enjoy my ideas, feel free to like it and drop in a comment. I love reading your comments below.
Disclosure: This is just my opinion and not any type of financial advice. I enjoy charting and discussing technical analysis. Don't trade based on my advice. Do your own research! #millionaireeconomics #BAC
BAC

BAC, Massive Descending-Triangle, Huge BREAKOUT-Expansion Setup!Hello There!
Welcome to my new analysis of BAC. In recent times I have spotted important value stocks within the market that have the potential to emerge with a major transformational reversal and indicate main expansional determinations once the appropriate confirmations have emerged. In this case, I have analyzed BAC with the current ongoing underlying dynamics and with BAC it has to be mentioned BAC is a stock that can unfold its full potential with the current Consumer Demand to appropriately increase further. More and more supply-chain disruptions are repaired again and are recovering now, if this dynamic holds on it sets up a crucial turning in the overall market sentiment. Also, the fact that CPI has declined now for a consecutive period of time builds an important market from where stocks as I have spotted in my watchlist confirm the necessary opportunities.
When looking at my chart now, BAC is forming an important structure, firstly as it is still trading within this gigantic ascending-trend channel in which it has the main supports within the lower boundary and already bounced several times within there. Secondly, BAC has the main support levels between the 26.3 and 27.5 area as it is marked in my chart. Thirdly, BAC is already bouncing within the areas and is forming an important support base within this zone. All these factors are building a determined support base from where BAC has considerable potential to emerge with a major reversal and increase the bullish edge.
The most important formation in this whole structure is the momentous descending triangle formation. Such a formation is leading to a meaningful substantial expansion reversal in almost all of the cases. Once the whole descending triangle formation has been completed with the final setup as it is marked in my chart this is going to activate the further bullish price-action accelerations into the upper directions and emerge with the major wave-C within the whole wave-count that BAC already established. The completion of the formation also means BAC is going to activate the target zones within the 62.50 and 66.50 areas.
Now, taking all these factors into consideration, currently, there is a massive digitization boom with digitization developments increasing within recent times and the growth rates in this sector are accelerating. When BAC moves further with the potential to transform their holdings into the newly developed ecosystem this is going to have a tremendous effect on the actual bullish sentiment prevailing here, especially in combination with the fact that the Consumer Expenditures in this sector are increasing. With such a backing and increase of these factors, this is actually indicating that the price-action accelerates in pace. Once the formation has been completed the next phase targets mentioned will be active.
Thank you everybody for watching my idea about BAC. Support from your side is greatly appreciated.
"With a prime perspective on stocks history, we can have a better understanding of the past and present, and thus a clear vision of the stocks future."
VP

Bank of America ($BAC): Commodities Lead 2026 ‘Run-It-Hot’ TradeBank of America (NYSE: NYSE:BAC ) Stock: Commodities Lead 2026 ‘Run-It-Hot’ Trade
Bank of America (NYSE: NYSE:BAC ) has doubled down on its “run-it-hot” thesis for 2026, calling commodities the top trade of the year as the global economy enters a high-growth, high-stimulus phase. The bank’s strategists, led by Michael Hartnett, argue that commodities are set to outperform due to strong fiscal expansion, potential inflationary pressure, and policy shifts under the Trump administration. Energy, industrial metals, and broad-based commodity indices have already delivered impressive gains this year as investors position around the AI-driven data-center boom.
The Vanguard Commodity Strategy Fund is up 17% YTD, beating the S&P 500, while commodities-heavy sectors such as Industrials (+17%), Utilities (+15%), and Energy (+7%) continue to attract flows. According to BofA, these returns can extend into 2026 thanks to four core drivers: higher inflation expectations, fiscal stimulus, the weakening appeal of bonds, and structural de-globalization. Tariffs, geopolitical fragmentation, and supply-chain recalibration are boosting demand for raw materials, while gold’s historic rally—up 60% this year—shows investors are pricing a long runway for commodity strength.
BofA also highlights that oil could be the top contrarian trade of 2026, especially if geopolitical tensions moderate. Combined with infrastructure investment and AI-related energy demand, the commodity complex may continue to lead risk assets.
TECHNICALS
Bank of America’s stock shows a strong bullish structure on the 3D chart. BAC broke above the previous $48–$50 supply zone and is now trending firmly above its 9-SMA. Price is consolidating near $54–$55, building a base just below its recent high.
RSI remains bullish at ~64, indicating healthy momentum without extreme overbought conditions. The MACD line is hovering near a bullish continuation signal, suggesting the uptrend has room to extend. If BAC holds above $52.50, the next upside target is $58, followed by $60–$62. A breakdown below $50 would be the first sign of weakening momentum, but current structure favors continued upside in line with the commodities-driven macro outlook.

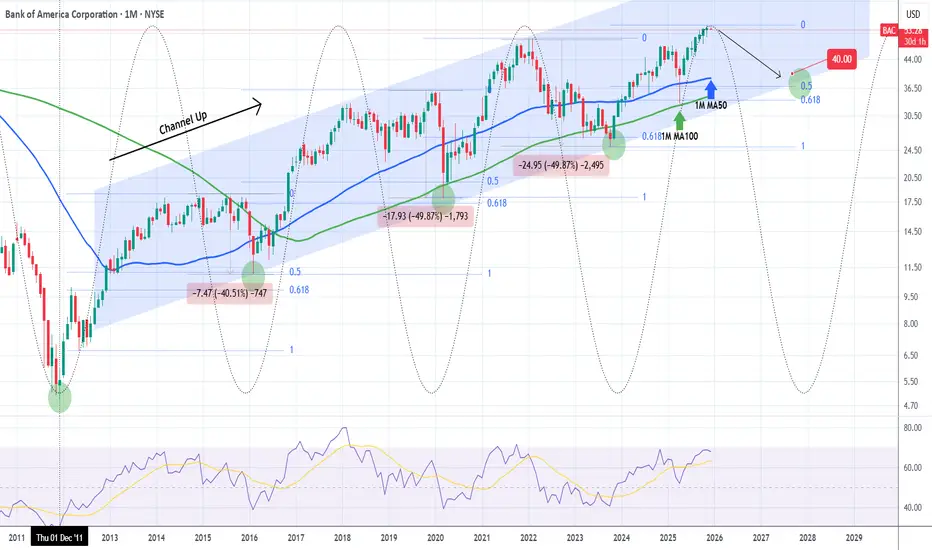
BANK OF AMERICA Cyclical correction to $40 starting.Bank of America (BAC) has been trading within a Channel Up for the past 13 years. The Sine Waves have had a fair success at pricing both Cyclical Tops (Bull Cycles) and bottoms (Bear Cycles).
Based on that, Bank of American is entering into peak territory. Whether that lasts for longer (like 2014 - 2016 an 2018 - 2020) or shorter (2022), the common parameter has been the 1M MA100 (green trend-line), marginally below which the last two corrections took place.
At the same time, every such Bear Cycle since 2012 has always hit its 0.5 Fibonacci retracement level, making a direct Higher Low at the bottom of the long-term Channel Up. Right now the 0.5 Fib sits exactly at the bottom of the pattern, so we expect at least $40 to get hit before the stock becomes a long-term buy opportunity again.
Notice also how the 1M RSI is reversing just before it turned overbought (70.00).
---
** Please LIKE 👍, FOLLOW ✅, SHARE 🙌 and COMMENT ✍ if you enjoy this idea! Also share your ideas and charts in the comments section below! This is best way to keep it relevant, support us, keep the content here free and allow the idea to reach as many people as possible. **
---
💸💸💸💸💸💸
👇 👇 👇 👇 👇 👇
BAC Bank of America Corporation Options Ahead of EarningsIf you haven`t bought BAC before the rally:
Now analyzing the options chain and the chart patterns of BAC Bank of America Corporation prior to the earnings report this week,
I would consider purchasing the 48usd strike price Calls with
an expiration date of 2025-7-18,
for a premium of approximately $0.34.
If these options prove to be profitable prior to the earnings release, I would sell at least half of them.
SPX - Are you catching the rotation trends? SPX is still holding very bullish price action. Technicals are pointing towards higher price and todays inside consolidation day certainly helps digest recent gains.
Along with the flat indices market session, we did observe some massive capital rotation trends.
Financials saw a pretty strong down move across the board. JPM / BAC / C all saw large outflows. We were positioned on the short side of financials and took profits on JPM puts.
Even with the big selloff in financials, SPX held up surprisingly well.
Capital simply rotated instead of outright leaving the market. Bullish Signal.
Technology, Energy, Materials, Health care, Transports all saw capital inflow trends.
Rotation into under preforming sectors is a sign that markets could be staging another healthy leg up.
We still have an upside target over 6300 on SPX.

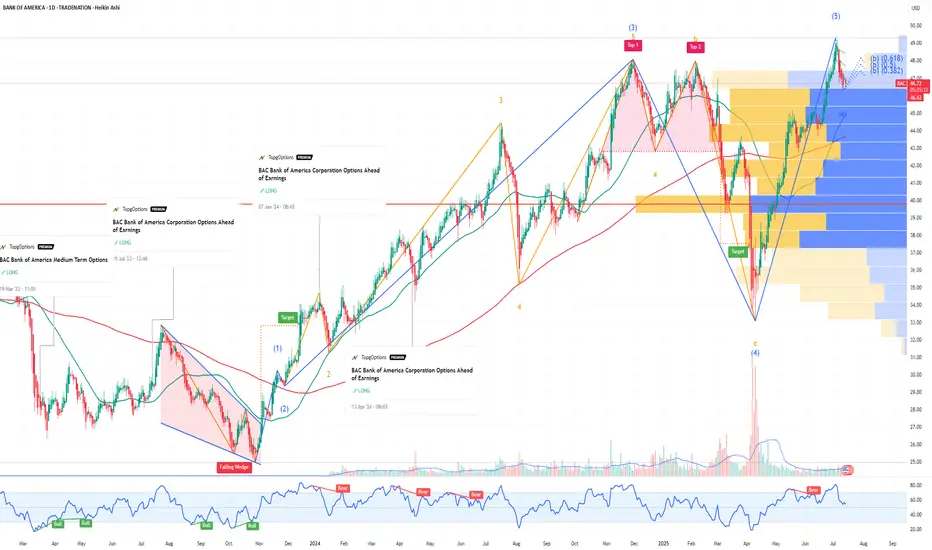
BANK OF AMERICA: Strongest rebound since 2023 eyes $65.Bank of America is heavily bullish on its 1D technical outlook (RSI = 68.687, MACD = 1.120, ADX = 62.779) as it's on an impressive rebound since the April low, which was priced on the 0.236 Fibonacci level of the long term Channel Up that begun in December 2011. Every rally on the 0.236 Fib always hit the 0.786 Fib. Long until the end of the year, TP = 65.00.
## If you like our free content follow our profile to get more daily ideas. ##
## Comments and likes are greatly appreciated. ##

OptionsMastery: Sitting at resistance on BAC!🔉Sound on!🔉
📣Make sure to watch fullscreen!📣
Thank you as always for watching my videos. I hope that you learned something very educational! Please feel free to like, share, and comment on this post. Remember only risk what you are willing to lose. Trading is very risky but it can change your life!

BAC on the UPTRENDBAC has completed the correction. Now running on the Uptrend.
On chart frame WEEK, the price was crossed MA200 then back up.
On chart frame Day, the volume so high and RSI look good.
It's mean, the Uptrend started from 04.09.25.
In the short term, the price still has to come back to fill at least 1 or 2 gaps that it has just created.
Price target: $43.63
Price entry: $37.99 (Today, 04.15.25).
Price stoploss: $36.20
R/R: 3.15.
IMO amateur trader.
Good luck!

BAC Bank Of America (NAS100) Long Hi guys,
Stock Alert
Bank Of America
Symbol: BAC
🦇Entry: 40.30
⚠️SL: 36.47
✔️TP1:44.33
✔️TP2: 49.68
✔️TP3: 56.44
Happy trading, hope you are earning lots of profit.
Sarah

3 Explosive Setups I'm looking at this week $TSLA, $BAC, and $BPThis week should be massive for these 3 stocks.
I'm waiting for a signal on the weekly and all of these stocks should run to price targets.

BAC Bank of America Corporation Options Ahead of EarningsIf you haven`t bought BAC before the recent rally:
Now analyzing the options chain and the chart patterns of BAC Bank of America Corporation prior to the earnings report this week,
I would consider purchasing the 47usd strike price Calls with
an expiration date of 2025-2-7,
for a premium of approximately $0.89.
If these options prove to be profitable prior to the earnings release, I would sell at least half of them.


$BAC Trade AnalysisThe daily chart for BAC shows a downtrend within a broader bullish channel. The recent price action has broken below critical short-term moving averages (8 EMA and 21 EMA) and is currently testing a key support level at S1 (43.05). The chart includes pivot points, trendlines, and dark pool activity, which provide additional context for potential price movements.
Key Observations:
1. Trend Analysis:
Uptrend Channel: The long-term green trendline remains intact, suggesting the broader uptrend is still valid.
Short-Term Downtrend: A lower high (LH) and a series of bearish candles indicate short-term downward momentum. The price is below the 8 EMA and 21 EMA, confirming bearish bias in the short term.
2. Support and Resistance:
Resistance Levels:
Pivot (45.87): The first resistance level, aligning with the 8 EMA.
46.24: A significant resistance level near the 21 EMA.
47.00: A dark pool level that may act as a ceiling if price rebounds strongly.
Support Levels:
S1 (43.05): Immediate support and current price zone.
40.95: Historical support level, providing further downside protection.
S2 (38.60): A critical support zone aligning with dark pool levels and prior lows.
3. Volume Analysis:
Recent volume spikes on red candles suggest distribution, but the bounce on the most recent green candle (December 20) indicates potential accumulation near support at 43.05.
4. Dark Pool Levels:
47.00: A dark pool print from December 5, marking potential institutional resistance.
39.70–39.49: Significant dark pool activity from earlier in the year, which may act as a magnet if price continues lower.
5. Moving Averages:
The price is below both the 8 EMA and 21 EMA, indicating bearish momentum.
A recovery above these moving averages would signal a potential trend reversal.
Trade Setup:
Scenario 1: Bullish Reversal from S1 (43.05)
Trigger: A strong bounce off S1 with price reclaiming the 8 EMA (~45.36) would confirm bullish momentum.
Profit Targets:
45.87 (Pivot): First resistance level and a key target for a short-term trade.
47.00: Dark pool resistance level.
48.08: The upper range of the recent downtrend and potential long-term target.
Stop-Loss: Below 42.50, as a break below S1 invalidates the bullish setup.
Scenario 2: Bearish Breakdown Below S1 (43.05)
Trigger: A daily close below 43.05 with increased volume would signal bearish continuation.
Profit Targets:
40.95: Previous low and historical support.
39.70–39.49: Dark pool levels and a strong institutional support zone.
38.60 (S2): Key pivot support for a deeper downside move.
Stop-Loss: Above 44.50, as a move back above this level would signal recovery.
Scenario 3: Consolidation Before Directional Move
If the price remains range-bound between 43.05 and 45.87, traders can look for breakout trades in either direction. Volume and candlestick patterns will be key indicators.
Final Thoughts:
Short-Term Outlook: Watch for price action at 43.05. A bounce with strong volume would favor a bullish trade, while a breakdown opens the door for further downside.
Long-Term Outlook: The green trendline suggests that the broader uptrend remains valid. A deeper pullback into dark pool levels (~39.50) could offer long-term buying opportunities.

BAC | SHORTNYSE:BAC
Technical Analysis of Bank of America Corporation (BAC)
Key Observations:
Current Price Action:
Price: $37.58
Recent Drop: -1.92 (-4.86%)
Support and Resistance Levels:
Immediate Support: $37.18 (Bearish Line)
Further Supports: $36.00 (Target Price 1), $35.22 (Target Price 2), $33.39 (Target Price 3), and $30.98 (Target Price 4)
Resistance: The price recently broke below a support level at around $41.78.
Trendlines:
The price has broken below a key upward trendline, indicating a potential shift from a bullish to a bearish trend.
Relative Strength Index (RSI):
Current RSI: 48.91
The RSI shows a decline, indicating increasing selling pressure but still in a neutral zone.
Target Prices:
Target Price 1: $36.00
This level is the immediate support and a potential first target for any continued downward movement.
Target Price 2: $35.22
If the price breaks below the immediate support, the next target is around $35.22, a previous support level.
Target Price 3: $33.39
Further downside could see the price reaching $33.39, another key support level.
Target Price 4: $30.98
In a more bearish scenario, the price could fall to $30.98, a significant support level.
Summary:
Bank of America Corporation (BAC) has experienced a significant drop, breaking below a key support level and its upward trendline. The next levels to watch are $37.18, $36.00, $35.22, $33.39, and $30.98. The RSI indicates potential for further declines if market conditions remain negative.

Bank of America (daily - log )Hello community,
Following the publication of Warren Buffet's results, I looked at the Bank of America stock.
Since the beginning of the year, performance 28%
Why did you sell the stock, there must be a reason that I don't know.
Upward trend, I put the 3 accumulation zones on the chart.
Make your opinion, before placing an order.
► Thank you for boosting, commenting, subscribing!

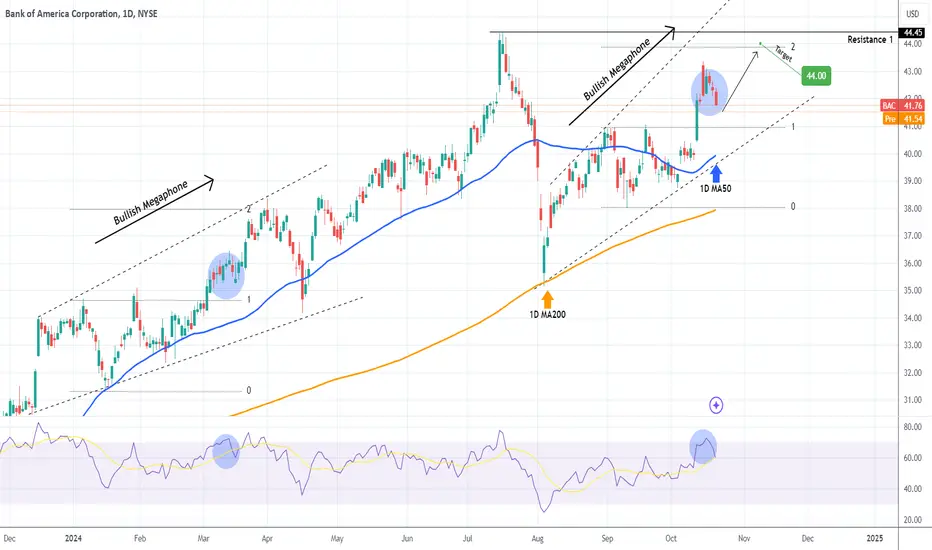
BANK OF AMERICA Short-term buy signal.Last time we gave a signal on the Bank of America Corporation (BAC), was exactly a year ago (October 11 2023, see chart below), with the stock giving us a highly profitable buy trade, hitting the $44.00 long-term Target:
This time our focus is on the shorter term 1D time-frame where the stock is forming a Bullish Megaphone similar to the one in January - March 2024. Currently the price is pulling back (blue circle) and the symmetric pattern of mid March 2024 suggests that it should now rebound towards the 2.0 Fibonacci extension.
As a result, we are turning bullish mid-session, targeting $44.00 (above Fib 2.0 and below Resistance 1).
-------------------------------------------------------------------------------
** Please LIKE 👍, FOLLOW ✅, SHARE 🙌 and COMMENT ✍ if you enjoy this idea! Also share your ideas and charts in the comments section below! This is best way to keep it relevant, support us, keep the content here free and allow the idea to reach as many people as possible. **
-------------------------------------------------------------------------------
💸💸💸💸💸💸
👇 👇 👇 👇 👇 👇
Bank of America Stock Surge on Q3 Earnings BeatBank of America (NYSE: NYSE:BAC ) delivered impressive third-quarter results, showcasing its resilience amid a challenging economic landscape. The bank reported $25.34 billion in revenue, slightly up from $25.17 billion a year earlier and above the analysts' consensus projection of $25.28 billion. Although profit fell to $6.90 billion ($0.81 per share) from $7.8 billion ($0.90 per share) last year, this was still better than the expected drop to $6.45 billion** or $0.75 per share.
Key Financial Highlights:
- Net Interest Income (NII) was reported at $13.97 billion, down from $14.38 billion a year ago but exceeding the expectation of $13.85 billion.
- The bank's trading revenue saw a significant uptick, with fixed income trading revenue rising 8% to $2.9 billion and equities trading jumping 18% to $2 billion.
These results come on the heels of similar positive reports from rivals like JPMorgan Chase and Wells Fargo, highlighting a robust start to the big bank earnings season. This broader positive sentiment in the banking sector is likely contributing to a favorable outlook for Bank of America.
Technical Analysis
As of the time of writing, NYSE:BAC shares are up 1.62%, signaling a bullish trend. The stock has recently rebounded from a consolidation zone, gathering momentum for further upward movement. A key indicator of this bullish sentiment is the Relative Strength Index (RSI), currently hovering around 71, indicating that the stock is entering overbought territory.
The stock's performance is further supported by its trading above key moving averages, which traditionally signals a strong bullish trend. Analysts note that this upward momentum, combined with the bank's robust earnings, positions Bank of America (NYSE: NYSE:BAC ) favorably for potential further gains, especially as NII shows signs of recovery.
Investment Implications:
The current trajectory suggests that Bank of America (NYSE: NYSE:BAC ) is turning a corner in terms of NII, as indicated by analysts like Wells Fargo's Mike Mayo. With the Federal Reserve having recently cut interest rates, analysts believe this should help improve bank earnings moving forward, as lower deposit costs may enhance profitability.
Additionally, with a provision for credit losses reported at $1.5 billion, slightly under the estimated $1.57 billion, the bank appears to be managing its risks effectively, further instilling confidence in investors.
Conclusion
Bank of America's latest earnings report reflects a strong performance amid a dynamic banking environment. The combination of better-than-expected trading results, a recovery in NII, and robust investor sentiment positions NYSE:BAC as a compelling investment opportunity. As the bank continues to navigate the evolving landscape of interest rates and economic conditions, investors may want to keep a close watch on its performance in the upcoming quarters.

TSLA: 125% gains Best Level to BUY/HOLD 🔸Hello traders, today let's review 4hour price chart for TSLA.
Currently a mixed package overall with limited upside potential,
I don't recommend entering any buys at current price.
🔸Ongoing accumulation since May 2023, significant lows printed
in April 2023 / 2024, so I'm tagging April 2025 as a potential reversal
for TSLA / bottom buying near range lows totally makes sense.
🔸Accumulation range defined by range lows at 175 usd
and range highs at 255 usd. premium prices below at 145/165
and above at 280 and 305 usd.
🔸Recommended strategy bulls: expecting pullback based on measured move projection set to extend further down towards 175 usd. currently
trading at 250 usd, no entries recommended on buy side. This is a
trade setup for patient traders. may take more time to develop.
conservative target is 350 USD, so +125% gains off the lows.
🔸Finally, check out the TSLA related story below and let me know
in the comments section if you'd like to get more updates like this.
Don't forget to follow/like/comment, this is much appreciated.
Year 2030. Tesla coupe safely lands on Mars. Exploration mission
starts in April 2030.
▪️ In this fictional tale in 2030, Tesla founder Elon Musk and his wife Grimes make a historic landing on Mars, marking a new era in space exploration.
▪️ Upon arrival, they establish a settlement called "New Teslaville," aiming to turn it into a sustainable colony for future generations.
▪️ Their first day involves setting up essential infrastructure, including solar panels, an oxygen generator, and a Mars rover.
▪️ The next day, they plant a Tesla flag on Mars, signifying humanity's first successful landing on the red planet.
▪️ On day three, Musk shares a heartfelt message about the importance of space colonization for humanity's survival.
▪️ After a successful first week, they receive a message from Earth, indicating the start of the "New Mars Era" and their status as the first Martian settlers.
▪️ The couple ends their week by enjoying the Martian sunset in a Tesla coupe.
🎁Please hit the like button and
🎁Leave a comment to support our team!
RISK DISCLAIMER:
Trading Futures , Forex, CFDs and Stocks involves a risk of loss.
Please consider carefully if such trading is appropriate for you.
Past performance is not indicative of future results.
Always limit your leverage and use tight stop loss.

Are financials topping? XLF hitting major resistance.
JPM hitting major resistance.
Financial have been putting a very strong bid under the SPY & IWM
If financials are topping here i do think it will be a major headwind for the market.
I'm watching to see if the Fed rate cut becomes buy the rumor sell the news!

Are financials topping here? Financials have been one of the leading and strongest sectors on the back of rate cut narratives.
The resilience and strength can easily be observed...
XLF has been making new highs despite the QQQ & SPY not.
Now it begs the question; is all the rate cut priced in?
We think financials are set for some downward rotation.
If this rotation occurs it opens up many other opportunities as financials do carry some decent weight in the indices.
Today names like JPM & XLF gave us a potential daily topping tail.

Is Warren Buffett Losing Faith in Bank of America?A Strategic Shift with Far-Reaching Implications
Warren Buffett, the legendary investor and CEO of Berkshire Hathaway, has taken a significant step that has sent ripples through the financial world. Berkshire, a long-time major shareholder of Bank of America (BofA), has been steadily selling its stake in the bank. This strategic move, totaling over $3.8 billion in sales, has raised eyebrows and sparked speculation about the future of BofA.
Buffett's decision to reduce Berkshire's holdings in BofA is a departure from his typical investment strategy, which often involves long-term, unwavering commitments. This shift raises questions about his perception of the bank's prospects and the broader financial landscape.
The implications of this move extend beyond Berkshire and BofA. As one of the most closely watched investors in the world, Buffett's actions can influence market sentiment and investor behavior. His decision to sell BofA shares could signal a potential shift in his outlook on the banking sector or broader economic conditions.
To learn more about the reasons behind Buffett's decision, the potential impact on Bank of America, and the broader implications for the financial sector, please visit our website.

