BANDBTC forming bullish BAT | Upto 361% move expectedHi, my friends hope you are well, there is another bullish wave possible by the price action of the BAND protocol token.
Formation of bullish BAT pattern:
This time on a 4-day chart the BAND token is forming a harmonic bullish BAT pattern and soon it will be entered in potential reversal zone.
Buying And Sell Targets:
The buying and sell targets according to harmonic BAT pattern and its Fibonacci sequence should be:
Potential reversal or buying zone: 0.00040957 to 0.0002697 btc
Fibonacci projection or sell zone: 0.00074126 to 0.001246 btc
Stop Loss:
The potential reversal zone area that is up to 0.0002697 btc can be used as stop loss in case of complete candlestick opens and closes below this level.
Possible profit and loss ratio:
As per the above targets, this trade has the profit possibility of 361% and as per the above-mentioned stop loss, the loss possibility is 34%
Note: This idea is education purpose only and not intended to be investment advice, please seek a duly licensed professional and do you own research before any investment.
Band

BAND showing positive divergences and heavy POC supportBAND showing positive divergences and heavy POC support / Cross-Chain Data Oracle

Crypto & Precious Metals. Biden jobs pledge. Growth in markets.Bitcoin picked up a bid while I was finishing the first video. I used the opportunity to discuss a notion that Joe Biden's plan would create 7 million more jobs than Trump, according to one economic forecast.
I also look at Bitcoin, Litecoin, Chainlink and Ethereum again to discover that Bitcoin is outperforming the rest as it rose by $150 at the weekly open. I discuss the legend John Bogle, his views on investing and taking a small risk by investing rather than holding money is necessary to become truly wealthy. the money may be worth more in the first two years but then after being patient more than most begin to return far greater sums than they would earn from a regular job.
#Bitcoin #BTC
#Ethereum # Eth
#litecoin #ltc
#Chainlink #link
#Band
#Silver #XAG
#Fibonacci #fibs
#Chaikin #Money #Flow
#Bollinger #Bands
#Moving #Averages

BAND ascending triangleIf you like my TA or other ideas, please leave a like to show support. It helps me out a lot
-------------------------------------------------------------------
-BAND touching heavy on that support zone
- Forming an ascending triangle; tendency to break to the upside
- MACD bullish crossover
If we close 70K sats we might see a move towards 80K or even 85K sats.

BANDBTC - UPDATE: Following Papa LINK?I took a look at BANDBT C a little while ago, we had some interesting moves today.
Market in general was pumping, BAND had some good movement.
Let's have quick recap, plus some things I'm seeing.
We're in a downward channel since the highs just before the dump.
We had hit what seemed to be the first solid support in a while. Though no real historic claim to that.
BAND tends to follow LINK. They are both security protocols, I think a lot of people conflate the two.
EMA 100 was bounced back to nicely today.
MACD looking like a healthy cross with some greens sprouting. Ripe for action.
Stoch is building, but not quite at overbought yet.
decreasing sell volume the last few red days.
There's a decent chance she'll swing back down to support, if LINK or BTC decides to drop rapidly for example. But if LINK holds strong above $10 I think we can confidently say BAND will keep moving, maybe after a little correction down.
Closest indicator to it retesting would be the Stoch is getting high.
Invest at your own risk here, I'm just speculating.
TP 's:
#1- 0.00075
#2- 0.0009
SL : Just below prior support. If she breaks it'll be down to the next historic support likely.
--
“Test fast, fail fast, adjust fast.” — Tom Peters
--
I'm a guy that you don't know posting his ideas on the internet for the sake of improving as a human being. If you take this as financial advice, that's on you.
If you like my analysis, then leave a like and feel free to follow for more free content. Feedback, criticism and crude humor are welcome :)


BAND Price: +200% by the end of 2020?> BAND is extremely volatile and bullish. Marketcap is growing rapidly and volumes increase.
> BAND protocol has support from Sequoia Capital and has a strong team of young engineers.
> Baking/staking is extremely attractive. More retail investors join the program.
I predict a new high for BAND in the upcoming months.
40%-70% on BAND by September 28?It looks like right now is the time to go LONG on BAND.
The asset is oversold and looks appealing.


Buy Zone and Target for Band Protocol BAND/USDT $BANDMy buy zone and targets for BAND. I'd cut loss if it doesn't hold the support trend line.
(Not financial advice)

BAND/USDT - a map for the futureBAND/USDT make a crazy run up, incredibly overextended! wow!
By the way, volumes suggest that a temporary top could have been made.
Hopefully for holders, the rising black vector will resist and keep up the price. In this case, targets are in red at 10.333, and longer term target is 26 dollars, if this coin have a future.
Otherwise a good support will be the 4.222 area
Talking about time, March 2021 looks a good time to accumulate, and December 2021 a good time to distribute.
Good Luck :)

wow! BAND and 22% profit is ready ! ;-)you can have short position for band and btc and take a 22% profit for a short position.


Band Trading Analisis Hello Traders,
Band is the newest fashion crypto currencie and possibly it will give us very good trading opportunities in the future. However, it seems that is correcting from its last upward movement.
Base on its upward lines and on the Fibonacci levels, we recommend you pay attention to our buy zone levels drafted at out chart for the next buy opportunity.
Please push the like button and follow us.

BANDUSDT forming bullish BAT | Upto 401% possibilityHi, my friends hope you are well, there is another bullish wave possible by the price action of the BAND protocol token.
Formation of bullish BAT pattern:
This time on a 12-hour chart the BAND token is forming a harmonic bullish BAT pattern and soon it will be entered in potential reversal zone.
Buying And Sell Targets:
The buying and sell targets according to harmonic BAT pattern and its Fibonacci sequence should be:
Potential reversal or buying zone: $4.57 to $2.89
Fibonacci projection or Sell zone: $8.57 to $14.49
Stop Loss:
The potential reversal zone area that is up to $2.89 can be used as stop loss in case of complete candlestick opens and closes below this level.
Possible profit and loss ratio:
As per the above targets, this trade has the profit possibility of 401% and as per the above-mentioned stop loss, the loss possibility is 58%
Note: This idea is education purpose only and not intended to be investment advice, please seek a duly licensed professional and do you own research before any investment.


$Band Triggers a BUY!Band Protocol Has just trigger a buy on the daily trading Plan
3rd September 2020 0:00UTC
Although it triggers a buy now expect downward pressure intraday as 4 hour showing downward momentum
All Rules are met
Just to recap the rules are:
Trigger:
Close above the 20 day Moving average while in an upward direction
Entry Rules:
Stochastic RSI in an upward direction but cannot have either SLOW/FAST in overbought area
MACD in Bullish projection

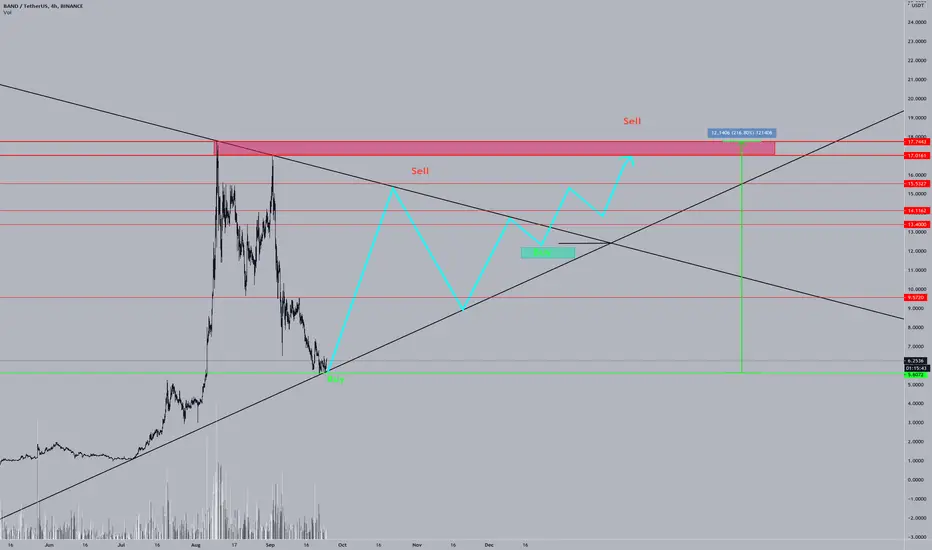
Don't miss the great buy opportunity in BANDUSDTTrading suggestion:
. There is a possibility of temporary retracement to suggested support line (12.68). if so, traders can set orders based on Price Action and expect to reach short-term targets.
Technical analysis:
. BAND/TetherUS is in a range bound and the beginning of uptrend is expected.
.The price is above the 21-Day WEMA which acts as a dynamic support.
. The RSI is at 65.
Take Profits:
TP1= @ 15.47
TP2= @ 17.76
TP3= @ 20.46
TP4= @ 27.15
SL= Break below S3
❤️ If you find this helpful and want more FREE forecasts in TradingView
. . . . . Please show your support back,
. . . . . . . . Hit the 👍 LIKE button,
. . . . . . . . . . . Drop some feedback below in the comment!
❤️ Your Support is very much 🙏 appreciated! ❤️
💎 Want us to help you become a better Forex trader ?
Now, It's your turn !
Be sure to leave a comment let us know how do you see this opportunity and forecast.
Trade well, ❤️
ForecastCity English Support Team ❤️


$BAND cup and handle playIf this closes above the resistance then it's game day baby. Buy me a coffee ;)
