bandbtcBand Oracle Project
After a long correction, it is ready for a good parabolic movement. I hope you don't miss this position

Band Protocol Long-Term Support Holds (380% Bullish Wave Mapped)Since June 2023 we have at least 9 attempts by the bears to break support, failing every single time—this is the yellow space on the chart.
As the current session has a long lower wick, this means that BANDBTC manages to close above support once more and at the same time produces a higher low.
Whi

✳️ Band Protocol 120% Rise MappedBand Protocol (BANDBTC) is preparing to print a very nice, and potentially profitable, bullish wave.
I say this based on the fact that a strong support level has been established.
BANDBTC hit a low 10-June. This low has been tested multiple times and continues to hold.
After 6 months consolidating

BandBtc buy opportunityBandbtc is currently showcasing a falling wedge formation on the chart, with the price rebounding consistently from the bottom trendline. Considering the wedge's contraction, the setup suggests an imminent price breakout.
The immediate level to monitor is the internal supply zone (ISZ), anticipated

Band Protocol (BAND) - Bullish divergenceOn the above 2-day chart price action has corrected 90% since the sell signal back in July 2020 following a massive 5500% from the buy signal in January 2020. A number of reasons now exist to be bullish, including:
1) Really? You don’t see it?!
2) Price action has corrected to the 0.786 Fibonacci

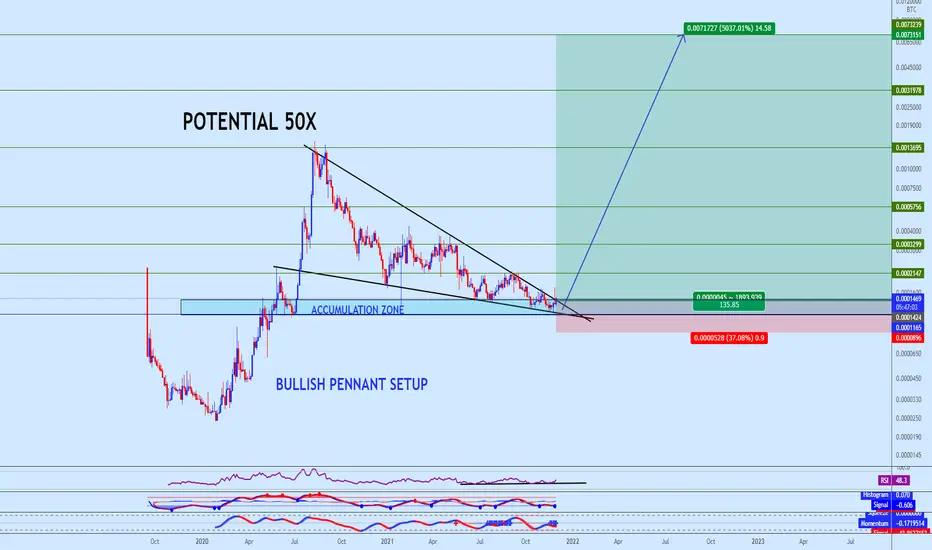
BandBtc with 50x potentialsSpotted Bullish Pennant with strong bullish divergence.
Make sure to follow the suggested BUY zone on the chart and always respect the given stop level.
I would appreciate your support by dropping your likes on my posts and follow us for more important market updates.
Thank you
One breakout please, BANDBTC?BANDBTC has been in a downward trend for more than a year. On the daily this looks like a huge bull flag and there were already a couple of attempts to breakout to the upside in the recent weeks.
It is a good time to watch BANDBTC in my opinion: If it holds above ~1040 we may see a big push to the

Band Long- Elliot Waves and Charts PatternsIn the bigger picture, we can see a perfect Elliot waves count, we have a perfect (i-v) impulse, after that we have an a-b-c correction, that seems to be ending.
With this correction, the price made a massive descending wedge, it did not play that well, but the break down could be a false one. Mo

Now or neverRSI is currently at the bottom; Chaikin money flow is at the top.
The strong RSI trend will force a breakout of CMF (btc moving into the project).
Retest -> boom -> price discovery
Osmosis listing Band too!

Major reversal momentThe rest of the month should be very bullish.
RSI has hit the trend bottom
Stoch RSI has hit a trend bottom and ready to break out
Price is currently trading 36% under the all-time VWAP
Cloud is slightly bullish
Supertrend is bullish
A major fib time zone level was hit

See all ideas