Trade Idea: HII - Flat Base Breakout in Strong Sector (Defense) Trade Idea: HII – Flat Base Breakout in Strong Sector (Defense)
Ticker: NYSE:HII
Sector: Industrials – Aerospace & Defense
Trade Type: Breakout Swing
Thesis:
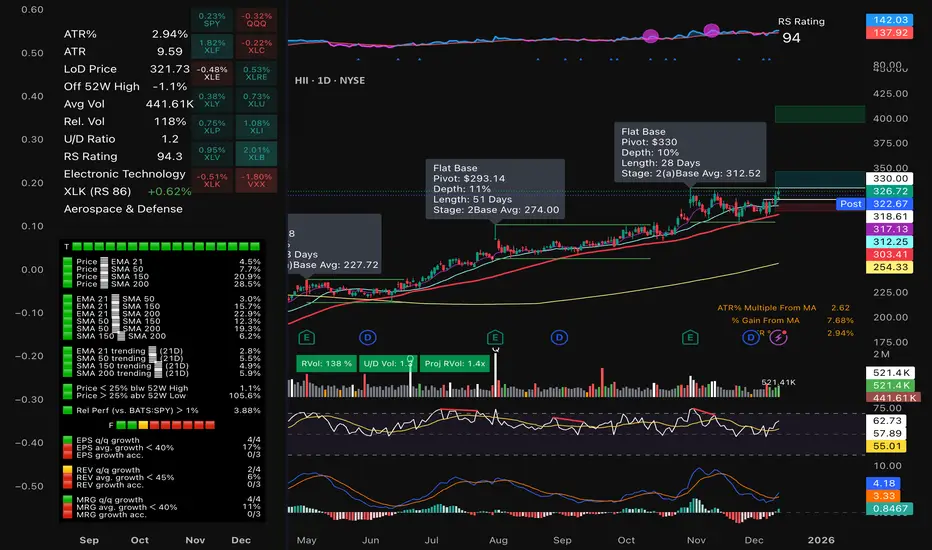
HII is forming a flat base just below all-time highs, within a high relative strength sector (Defense), as small caps and industrials rotate into leadership. Price is consolidating tightly near the $330 pivot with rising volume on up days — a classic pre-breakout setup.
Technical Setup:
• Flat base forming for 7+ weeks, ~10% deep (ideal)
• Pivot: $330.10
• Support zone: ~$318.50 (prior resistance)
• MACD: Turning up
• RSI: Rising above 60
• Volume: Increasing on accumulation days
• MA Structure: Price above 10/21/50/200 EMAs – bullish alignment
Trade Plan:
• Entry: Breakout over $330.10 (confirmation with volume)
• Stop: $317.70 (below base + prior swing low)
• Target 1: $354 (measured move)
• Target 2: $365+ (extension zone)
Reward/Risk Ratio: ~5.6:1
Position Sizing: Based on 1% risk per trade
Market Context:
• Industrial sector (XLI): Relative strength increasing
• Small caps (IWM): Breaking multi-month base
• Defense stocks: Leading group (LMT, GD, RTX also constructive)
Summary:
HII is showing institutional characteristics with a flat base, strong sector alignment, and favorable market context. Waiting for volume-backed breakout to trigger long entry. Tight risk, strong upside.
Not financial advice. Just sharing trade structure. Trade your plan.
BASE
BRETT/USDT — Approaching the Break Point: Breakout or BreakdownBRETT/USDT is approaching one of its most critical zones of the entire downtrend structure. After months of sustained bearish pressure under a persistent descending trendline, the market is now forming a large falling-wedge compression, a pattern that often precedes strong trend reversals when a breakout is confirmed.
The chart shows a clear dynamic:
Price continues to respect the descending resistance, while the lows begin stabilizing around a gradually flattening support zone. As these two structures narrow, the market is essentially coiling, building pressure before releasing its next major directional move.
The key level to watch is 0.02120.
This isn’t just another resistance—it's the decision point that separates a continuation of the downtrend from the first true structural shift toward bullish territory.
A confirmed daily close above 0.02120, ideally supported by a volume expansion, would mark the first legitimate breakout from the multi-month wedge. If this happens, BRETT opens a wide path toward a series of upside targets:
0.02550 → 0.03050 → 0.03850 → 0.04800 → 0.05600.
Each of these levels represents both structural and psychological checkpoints where momentum tends to accelerate once the wedge breaks.
However, as long as price remains below 0.02120, bears still have control. A strong rejection at this level could trigger renewed sell pressure, dragging price back toward the mid-support zone at 0.013–0.014, or even a retest of the major low around 0.01101 if sentiment weakens.
BRETT is now in its compression phase, often the calm before a significant move. Conservative traders will wait for a confirmed breakout, while aggressive price-action traders may already be watching for early signals in volume and candle structure.
In short:
The market is quiet—
not because it's dead, but because it's preparing for a major decision.
And that decision will be dictated by the battle around 0.02120.
---
Bullish Scenario
If 0.02120 breaks with confirmation:
Trend shifts from bearish → neutral → bullish.
Targets unlock sequentially: 0.0255 → 0.0305 → 0.0385 → 0.0480 → 0.0560.
Expect momentum acceleration as the wedge breakout gains participation.
Validation: strong daily candle close + higher-than-average 7-day volume.
---
Bearish Scenario
If 0.02120 rejects strongly:
Market falls back into distribution.
Downside targets: 0.014 → 0.011.
A breakdown below 0.011 may create new cycle lows and extend the bearish trend.
#BRETT #BRETTUSDT #CryptoAnalysis #BreakoutWatch #FallingWedge #PriceAction #TrendReversal #KeyLevels #CryptoOutlook #MarketStructure

RIVN Massive base breakout incomingAbove 19 this will possibly enter into a massive squeeze mode,
The weekly base is enormous and we are finally breaking it.
Worth the watch

(TOSHI) toshi Is Toshi a fluke this year? So far, the price of the meme has not left the price of the origin starting price. 10 months and no change in price for long term holders, not great. Meme stability not a fluke? The price is not lower than the starting price and that is not always a bad thing because keeping money is better then losing money.

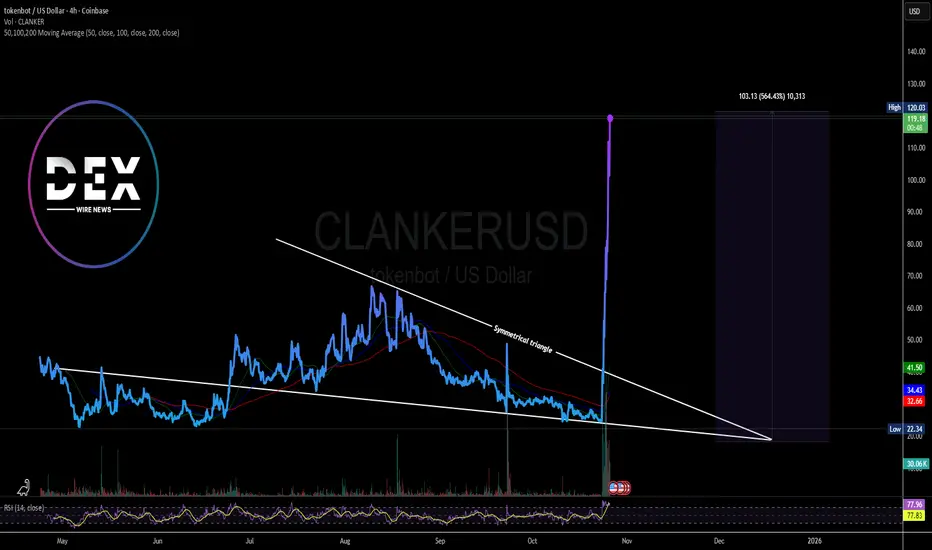
Tokenbot ($CLANKER) Broke Out of A Symmetrical Triangle The price Tokenbot ($CLANKER) a set of audited smart contracts that create token markets which reward token creators. spike 65% today breaking out of a bullish symmetrical triangle pattern gearing to reclaim the recent All time high of $193 a year ago.
While the RSI is 77, indicating the altcoin is trading in overbought region, bullish momentum seems to surpassed sellers. Only 1 million of this token was ever created with an all time low of $0.003875 as of November, 2024 and an All time high of $193.11 recorded in the same month of November, 2024 representing a whooping gain of +3019694.94% ROI.
All eyes are set on the $193 zone with stop losses set on the ceiling of the symmetrical triangle.
BRETT/USDT — Is This the End of the Long Downtrend?The 3D chart of BRETT/USDT is currently sitting at a critical juncture — right where a major horizontal support zone meets a long-term descending trendline.
This setup reflects the classic “moment of truth” in technical analysis — a key crossroads between a potential trend reversal or a continuation of bearish momentum.
At the time of analysis, the price is around 0.02639 USDT, positioned inside the strong demand zone at 0.022–0.0265, which has historically acted as a major accumulation area. The long wick down to 0.01101 indicates a possible liquidity sweep — a typical signal that weak hands have been flushed out, often followed by a relief rally or reversal phase.
However, the descending trendline continues to act as a strong dynamic resistance, compressing every attempt of upward momentum. As long as this trendline holds, sellers remain in control — but the persistence of this support zone suggests the potential for a major reversal base.
---
Pattern & Structure Overview
Main Pattern: Descending Triangle — lower highs compressing against a flat support line. While this pattern traditionally leans bearish, a failed breakdown from it can trigger a strong bullish reversal.
Liquidity Sweep (0.011): A deep wick likely cleared stop-loss clusters, meaning liquidity below support may already be exhausted.
Descending Trendline: Acts as the psychological “barrier” — a clean breakout above it could trigger a short squeeze.
Momentum: Seller pressure is slowing down near the support area; watch for increasing volume as a sign of accumulation.
---
Bullish Scenario (Reversal Potential)
If buyers continue to defend the 0.022–0.0265 zone, the market could be forming a structural bottom.
A bullish confirmation would require:
1. A clear break and 3D close above the descending trendline (around 0.03866).
2. A visible increase in trading volume, signaling strong buying participation.
3. Formation of a higher low above 0.026, confirming a shift in market structure.
Bullish Targets:
0.03866 → first breakout target
0.06305 → medium-term resistance
0.07784 → confirmation of full reversal
0.15278+ → potential expansion target if bullish momentum extends
---
Bearish Scenario (Breakdown Continuation)
If the price fails to hold above 0.022, especially with a confirmed 3D or weekly close below it:
Expect a continuation of the current distribution phase.
The market could retest the liquidity area near 0.011, or even form new lows if sell volume spikes.
Bearish Targets:
0.017–0.013 → potential short-term reaction zone.
Below 0.011 → opens the door for a deeper capitulation phase.
---
Conclusion
BRETT is currently standing on its final line of defense.
The 0.022–0.0265 zone is not just a regular support — it’s the stronghold for bulls and a potential entry point for smart money accumulation.
A breakout above the trendline could mark the beginning of a major trend reversal, while a breakdown below support could confirm a new leg down.
Given the current structure, BRETT is one of the most technically interesting assets to watch in the upcoming quarter — both for swing traders and long-term players.
---
#BRETT #CryptoAnalysis #MarketReversal #TrendlineBreak #CryptoTrading #SupportZone #BreakoutSetup #Downtrend #TechnicalAnalysis #SwingTrade #SmartMoney #LiquiditySweep

Envision (VIS) on BASEEnvision (VIS) on BASE – Multi-Target Accumulation Setup
This analysis focuses on the long-term accumulation structure forming on VIS/BASE following a prolonged downtrend and multi-month consolidation near historical lows. Price has compressed within a narrow range (~$0.0060–$0.0070), showing exhaustion in selling volume and the first signs of structural support holding above the previous capitulation wick.
Technical Outlook
Accumulation Zone: $0.0058–$0.0070
This zone aligns with the lowest historical range and coincides with visible demand clusters on weekly structure. A clean reclaim and close above $0.008 would confirm a short-term reversal.
Breakout Confirmation:
A break and weekly close above $0.008139 (≈125%) signals initial strength and potential rotation toward mid-range resistance.
Target Levels
Target 1: $0.008139 (short-term breakout target, +125%)
Reclaiming this level confirms strength and may attract early momentum traders.
Target 2: $0.023874 (mid-range retracement, +368%)
This area represents the 0.382–0.5 retracement zone of the prior impulse move and prior consolidation shelf.
Target 3: $0.029982 (major fib confluence and liquidity pocket, +463%)
This aligns with the 0.65–0.786 Fibonacci retracement range and a historically heavy supply area (60K–98K BKR levels).
Volume & Liquidity Context
Volume shows compression near the base, and historical BKR (breaker block) metrics indicate previous sell-side inefficiency around $0.023–$0.030. These zones are likely to attract liquidity hunts and partial profit opportunities during a recovery leg.
Not Ever Financial Advice.

ZORAUSDT Coin Analysis and CommentaryZORAUSDT Coin Analysis and Commentary
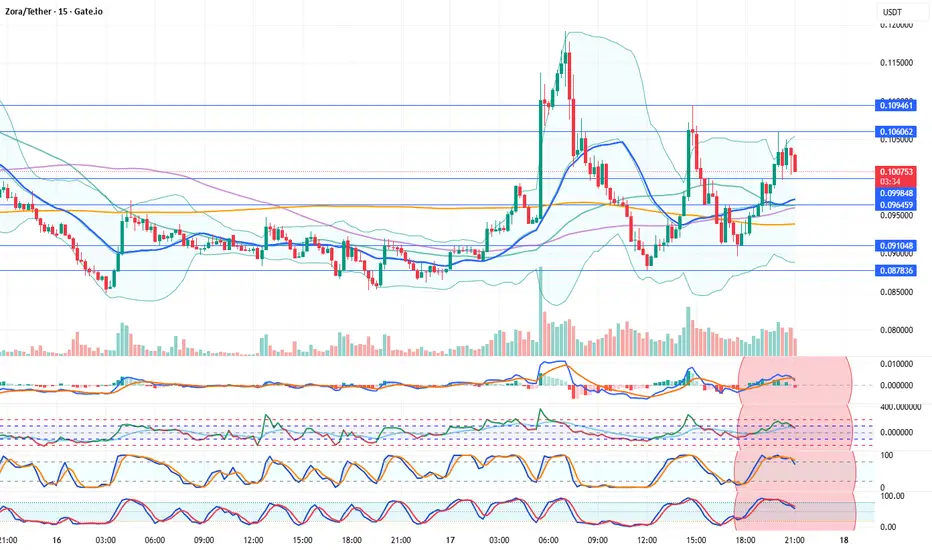
Indicators for Zora Coin are currently negative. On the 15-minute technical chart, selling pressure is increasing. The coin has turned downward from the 0.106 resistance level, entering a negative phase. Additional selling may occur in the short term. In this situation, support levels will be closely monitored.
Resistances: 0.106062 – 0.109461
Supports: 0.099848 – 0.096459 – 0.091048 – 0.087836
We’d appreciate it if you could boost our posts and share them on your social media. 🚀
Legal Disclaimer:
The information, comments, and recommendations contained herein do not constitute investment advice. Investment advisory services are provided only within the framework of an investment advisory agreement to be signed between the investor and authorized institutions such as brokerage firms, portfolio management companies, and non-deposit banks.
The opinions expressed here are personal views and may not be suitable for your financial situation, risk profile, or return preferences. Therefore, no investment decisions should be made based solely on the information and opinions presented on this page.
BRETT/USDT — Triangle: Market Compression Before a Big Breakout?🔎 Pattern Analysis
BRETT/USDT is currently trading inside a contracting triangle (descending resistance + flat/rising support). This pattern shows:
Lower Highs: sellers consistently pressing the price lower.
Higher Lows / Flat Support: buyers holding the floor strongly.
The market is in a “pressure cooker” phase — volatility is shrinking, and once price escapes, the move is usually explosive.
Technically, a symmetrical triangle is neutral, but since the prior trend was bearish, probabilities lean slightly bearish unless a breakout to the upside is confirmed with strong volume.
---
📈 Bullish Scenario
If price breaks upward:
1. Trigger: 2D candle close above 0.05617 with strong volume.
2. Healthy Retest: price pulls back to confirm support and then bounces.
3. Upside Targets:
TP1: 0.06472 (+44%)
TP2: 0.07961 (+77%)
TP3: 0.09073 (+102%)
TP4: 0.11532 (+156%)
TP5 (measured move / extension): 0.130–0.150 (strong momentum case).
4. Psychology: breakout means buyers take control, and if BTC/ETH are stable or bullish, momentum could accelerate.
---
📉 Bearish Scenario
If price breaks downward:
1. Trigger: 2D candle close below 0.038–0.040 with strong volume.
2. Failed Retest: price retests support turned resistance and rejects.
3. Downside Targets:
TP1: 0.03400
TP2: 0.03000
TP3: 0.02340 (major low, nearly −48% downside).
4. Psychology: breakdown signals capitulation — sellers dominate while buyers step aside.
---
🎯 Measured Move
Applying the height of the triangle gives a projected target:
Upside breakout: 0.11 – 0.13
Downside breakdown: 0.023 – 0.025
---
⚖️ Risk & Money Management
Confirmation is key: wait for a 2D close + volume, not just intraday wicks.
Stop Loss:
For longs → below triangle support / under 0.039.
For shorts → above triangle resistance / above 0.056.
Risk/Reward: aim for at least 1:2 before entering.
Position sizing: risk only 1–2% of total capital per trade.
---
🚨 Key Catalysts to Watch
1. Bitcoin & Ethereum trend: if BTC dumps, alts usually follow.
2. Liquidity/volume: thin order books risk false breakouts.
3. News/events: project updates, listings, or partnerships can be catalysts.
4. Macro market: US equities, Fed policy, and the Dollar Index (DXY) often influence crypto capital flows.
---
📝 Summary
BRETT/USDT is compressing inside a 2D contracting triangle, and volatility is set to expand.
Bullish trigger: 2D close >0.05617 + volume → targets 0.0647 / 0.0796 / 0.0907 / 0.115–0.13.
Bearish trigger: 2D close <0.038–0.040 → targets 0.034 → 0.030 → 0.0234.
Golden rule: wait for confirmation (2D close + strong volume) to avoid false breaks.
This setup provides a clear trading map with defined upside/downside levels, offering opportunities in both directions.
---
#BRETT #BRETTUSDT #Crypto #Altcoin #TechnicalAnalysis #TrianglePattern #Breakout #SupportResistance #CryptoTrading
BRETTUSDTIf you buy Brett today you are still early buyer of this coin, There is so much potential in Brett ,One of the leading meme coin on base chain, try to accumulate as much as you can....

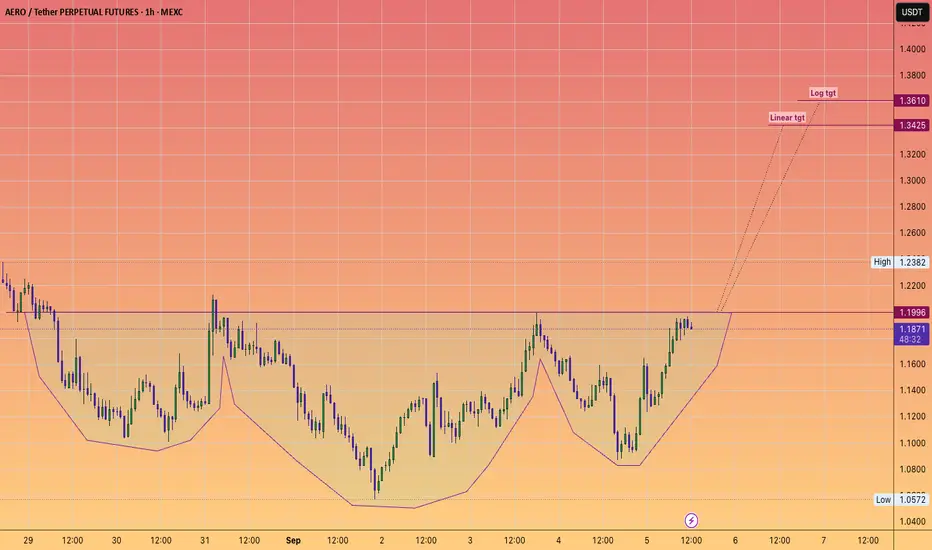
*Trade IDEA* Aerodrome to $1.35Inverse Head and shoulder is about to trigger.
"How Aerodrome Integrates with Coinbase Base DEX
Aerodrome's integration with Coinbase's Base DEX has been a game-changer for the platform. This partnership has created a powerful liquidity flywheel, with approximately 44% of Base's GDP flowing through Aerodrome. Post-integration, the platform experienced a 30% surge in trading volume and achieved a staggering $1.17 billion in 24-hour trading volume. By leveraging Coinbase's robust infrastructure, Aerodrome has simplified DeFi access for millions of users, making it a pivotal player in the Base ecosystem.
AERO Tokenomics: A Model for Sustainable Growth
Aerodrome's native token, AERO, is at the heart of its ecosystem. The platform employs dynamic emission throttling, reducing token inflation to just 1%. This ensures sustainable yields for liquidity providers while preserving the token's long-term value. Additionally, Aerodrome's ve(3,3)-style governance model incentivizes liquidity growth and rewards token holders with swap fees and staking benefits. This innovative approach has driven an 80% price surge for AERO, solidifying its appeal among investors and users alike."
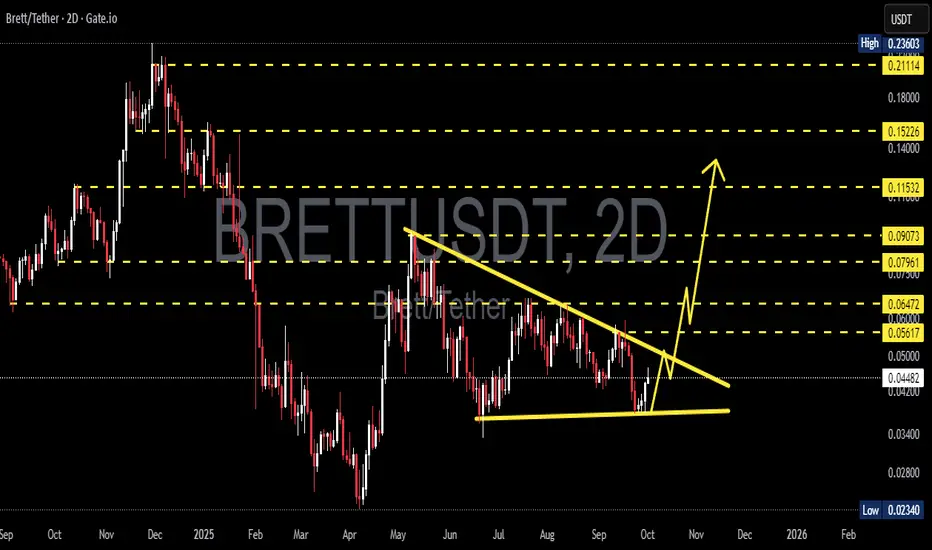
BRETT/USDT — End of Consolidation, Beginning of a Big Move?BRETT/USDT is currently forming a symmetrical triangle pattern on the Daily timeframe (1D). This structure is shaped by lower highs (selling pressure) and higher lows (buying pressure), which are now converging near the apex zone (0.049–0.064). As price approaches the tip of the triangle, volatility often expands sharply, leading to a major directional breakout.
---
🔹 Pattern & Key Levels
Pattern: Symmetrical Triangle (neutral — can break either way).
Strong Support: 0.045 – 0.049
Key Resistance: 0.064
Major Horizontal Levels:
0.091 → mid resistance
0.115 → strong resistance
0.152 → psychological zone
0.211 – 0.236 → previous highs
Lower Supports: 0.037 / 0.031 / 0.026 / 0.023
---
🚀 Bullish Scenario
1. Breakout confirmation if daily close happens above 0.064 with strong volume.
2. A successful retest of 0.064 as support will further strengthen the bullish setup.
3. Upside targets:
TP1 = 0.091
TP2 = 0.115
TP3 = 0.152
Measured move projection (long-term potential) = ~0.277
4. Stop-loss idea: below 0.049 or under the lower trendline.
---
🔻 Bearish Scenario
1. Breakdown confirmation if daily close happens below 0.045.
2. Failed retest of 0.045–0.049 as resistance would confirm further downside.
3. Downside targets:
TP1 = 0.037
TP2 = 0.031
TP3 = 0.026
Final strong support = 0.0234
4. Stop-loss idea: above 0.058–0.064 (upper trendline zone).
---
⚖️ Conclusion
BRETT/USDT is approaching a critical decision zone. The symmetrical triangle shows market compression — pressure is building up for a powerful breakout.
A bullish breakout above 0.064 could fuel a rally toward 0.091 – 0.152 and potentially higher.
A bearish breakdown below 0.045 may trigger a correction toward 0.026 – 0.023.
Best strategy: Wait for breakout confirmation with daily close + volume, apply strict stop-losses, and take profits step by step at key levels.
#BRETTUSDT #BRETT #AltcoinAnalysis #CryptoBreakout #TechnicalAnalysis #SymmetricalTriangle #ChartPattern #CryptoTA #SupportResistance

Ethereum season is here for a yearWho's leading the crypto market right now?
- Coinbase, Base, and Farcaster
Let me ask you a question. Will base launch its own token? No.
USDC on Base is their main token, and they are happy with it.
What people don't see yet is, base is base.eth.
Also, ETH hit its all time low dominance, and bouncing back up.
Ethereum foundation laid off many people, and going through hard reform.
I think Ethereum market dominance will hit 14% within a year.
That would be about 1ETH = $10,000.
Let's come back in a year.

ETH / USDC Pool StakeSharp sell-off following the U.S. strike on Iran—ETH whale has entered. Set your liquidity pool range wide to capture a potential rebound. If the price continues to drop, no problem—full ETH position is anchored at the bottom of the range. Avoid swapping ETH to realize losses. Hold your original ETH and continue adjusting the range downward if needed. Your only real costs are minting and gas fees, so operate on a low-cost network like Arbitrum or Base to keep expenses minimal.

$VVV - Wave 2 & 30.618 fib support at $3.20
1.618 projection at $8.84
Wave 3 target has confluence with prior peek on 10th/11th of feb.

Brett Weekly Chart - $0.049 Next (55%+)Red = Weekly Bottom
Blue = Proven support & Resistance lines
Currently there is a breakout and a W around the Red Bottom telling me the next move is up. Combined with an inverse head and shoulders with a 0.049 target

Mochi on Basewe are still in accumulation zone. last pump on january was for exit liquidity, some whales sold it and forget for the project and on another side come new whale who was DCA that downside pullback. Or just simple shakeout of weak hands who can't wait time)
I can show you any patern such as imbalance or order block / support level but in global we are still on same prices more than one year and i haven't seen any distribution yet.
By the way, Mochi is the oldest meme on Base network after Toshi, received grant from coinbase and named after CEO CB cat

(B3) Base3 "NFT opensea challenge"Something to consider when developing an NFT project to be offered on Opensea; Even though Base is offered as an alternative to Ethereum, the highest cost blockchain, B3 is tradable. With NFT projects an aspect of their profitability comes from the tradability history of Ethereum NFT information, as we know. If you consider developing and offering an NFT on Opensea you may want to consider a tradable layer-1 that you can hold in value along with offering NFTs for trade/sale, such as; B3, Avalanche, Polygon, Sei, Arbitrum, Berachain, Blast, Ethereum, Flow, and Optimism. And if you use Binance you could also consider Klaytn--not traded on Coinbase or Kraken. BASE is the new cutting edge offering trending so much based on PEPE coin yet what it does not have is the ability to see the growth of the chain improve the price of the NFT. This is something to consider when you decide to offer an NFT on Opensea, or elsewhere. I'm not trying to hate on Brian or BASE so much as I'm seeing the concept behind why I would actually choose B3 over using BASE, and so on. Berachain is sort of new and I would not swear by it, plus, who wnats to see a bear market right now, not me. Lots of people talked about Arbitrum and the fact is for as much hype as was placed on Arbitrum the outcome was not great enough to counter the more popular Solana.

Live Trade Unfiltered: Real-Time Breakout, Strategy & Market PsyWatch me execute a live trade in COINBASE:B3USD breaking down price action, trend lines, and market psychology in real time. I also guide a fellow trader through the trade via text. Whether you're new to day trading or a seasoned pro, this is a raw look at how I navigate fast-moving markets. No financial advice—just live insights!
Key Takeaways
Trade Type: Bull flag breakout, intraday scalping, ahead of huge multi day rally.
Indicators Used: Trend lines, Bollinger Bands, price action.
Exit Strategy: Momentum signals, clearly defined criteria for price behavior.
Psychological Tip: Don’t chase trades—wait for price to come to you.
Live Trading Lesson: Limit vs. market orders for optimal exits.
I'll update this post with the trade outcome and lessons learned. Let me know in the comments if you’d like to see more live trading breakdowns!
CRYPTO:B3USD CRYPTO:BTCUSD CRYPTO:XRPUSD
As always this is not investment advice, I would never place myself in such a liable situation, and you shouldn't take advice from a stranger on the Internet, do your own research and CY your own A and trade at your own risk.

More memecoin misery for Murad?Murad Mahmudov is a polarising figure in the cryptocurrency world, known for his shift from staunch Bitcoin advocacy to emerging as a leading influencer in the meme coin arena. Previously, he served as an analyst at Goldman Sachs and held the position of Chief Investment Officer at Adaptive Capital, a fund that faced bankruptcy following significant losses during the Bitcoin crash in March 2020.
Murad Mahmudov's most significant investment at the moment is in SPX6900 (SPX), where he transformed a $387,000 stake into an astonishing $23.6 million in a mere four months. Additionally, he has invested over $1 million in various meme coins such as APU and MINI, reflecting his confidence in the impending meme coin supercycle.
His portfolio is diversified across Ethereum and Solana, featuring a selection of tokens like MOG, POPCAT, and GIGA, which he believes possess fervent, cult-like communities.
His ascent has ignited discussions, especially following the disclosure of his significant investments in meme coins such as #SPX6900, which has led to skepticism regarding his authenticity and possible conflicts of interest.
Although his emphasis on mid-cap, community-oriented tokens has yielded profits, it highlights the inherently speculative aspect of meme coins, where fervent fanbases can drive dramatic yet unpredictable price fluctuations.
In fact, his widely circulated address at Token 2049 in Singapore may have triggered a market peak, suggesting that additional turmoil and recovery will be necessary to clear out the excesses that have accumulated.

$AIXBT – AI-Powered Crypto Analysis Tool with Real Market Utilit💡 What is $AIXBT?
$AIXBT is an AI-driven analytics platform under Virtuals Protocol, integrating blockchain, AI, and big data for advanced market insights.
📊 Key Features:
AI-driven market analytics – Monitors Crypto Twitter & CoinGecko.
Trending narrative detection – Finds key narratives influencing market moves.
Alpha-generating insights – Uses AI to provide data-driven trade signals.
On-chain & sentiment analysis – Tracks 400+ Key Opinion Leaders (KOLs).
🔹 Built on: Base L2 (Ethereum) – Low fees, fast transactions.
🔹 Listed on: Gate.io, gaining liquidity & visibility.
🔹 Growing user base: 100K Twitter followers in 2 months.
🛠 Key levels to watch:
Sweep of $0.167 expected soon – setting up a potential long trade.
Downside risk: $0.08
Upside targets:
$0.3 - $0.43 = conservative/local peaks.
$0.75 - $1.00+ = possible in 2025 if market euphoria kicks in.
🤔 Is $AIXBT Worth Watching?
AI + crypto is a major 2025 trend.
Not a meme coin – real utility for traders.
Unique AI-powered sentiment & narrative tracking.
High volatility.
🚀 Bottom Line:
$AIXBT has a strong AI-driven concept but needs to prove itself in the competitive AI crypto sector. If market enthusiasm for AI tokens continues, this could be a major breakout play.
📌 Key trade idea:
Watch for liquidity sweep at $0.167 → long if price bounces back up immediately.

$BRETT - The Leading Memecoin on BaseBrett is the legendary character from Matt Furie’s Boys' club comic. He is a dancer and loves video games. Now he is living on the BASE blockchain as a Fan tribute. He has become blue mascot of the blue chain, BASE.

B3 buy opportunity of a lifetimeEarly buyers will be rewarded, just spot buying.
Orders set up around the "point of no return" in case some lovely whale wants to market slam us.
