$DOCN – One of the Hottest Multi-Year Base Breakouts on the BoarDigitalOcean ( NYSE:DOCN ) is printing a monster weekly chart breakout — easily one of the cleanest multi-year bases I can find right now.
🔹 The Big Picture (Weekly):
NYSE:DOCN has been basing for years, building real cause.
We are now breaking through the $54 level, which marks the top of the entire multi-year range.
This is not a short-term pattern — this is a cycle-level breakout.
🔹 Why This Matters Right Now:
The market is heating up, and we’re seeing money rotate into cheap, forgotten stocks on the bottom.
These names are getting bought piece by piece, not chased — classic early-stage accumulation.
NYSE:DOCN fits perfectly into that rotation profile.
🔹 My Trade Plan:
1️⃣ Entry: Breakout over $54 on the weekly structure.
2️⃣ Risk: Stop down to the 9 EMA on the weekly — giving the trade room to work.
3️⃣ Mindset: This is a swing / position trade, not a scalp.
🔹 Why I Love This Setup:
Multi-year base = stored energy.
Clean breakout level with very little overhead supply.
Exactly the type of stock that can trend for months once it gets going.
This is what real base breakouts look like — not noise, not chop.
Basebreakout

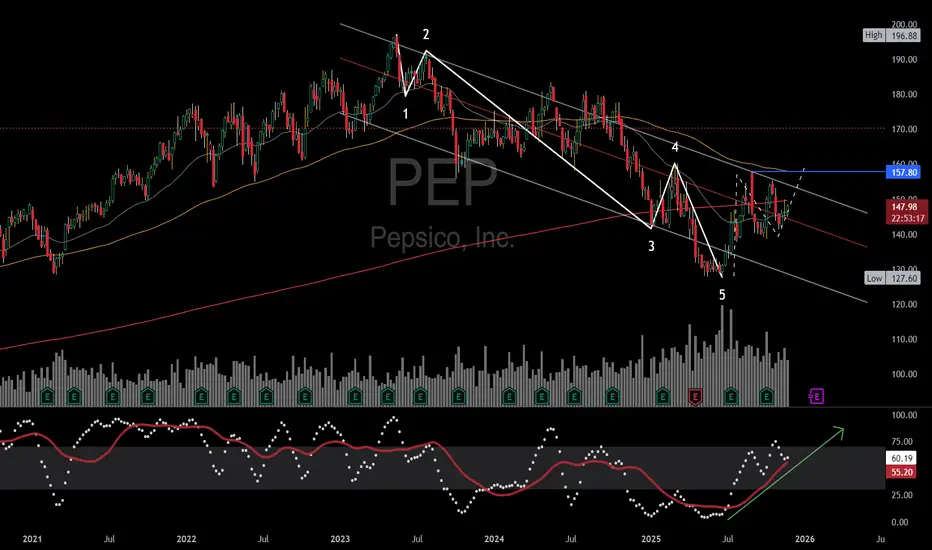
PEP Wave Analysis: The OverviewPepsiCo has been declining for the last 2 years. The impulse pattern down to a 5-year support level was influenced by higher interest rates; comparing PEP to the US10Y will show this relationship. I remember "Higher-for-longer" being the main idea behind the 3rd wave down, and we saw that pin, in the 5th wave, at a large support level with a strong reaction.
My initial thesis was $170 and I still believe that to be a large inflection point. I am looking for daily closings above the 157.8 pivot for a longer hold towards $170.
I added the Stochastic indicator to represent the divergence in price to momentum. Getting above the upper trend line (about $154) will open the door to the 120ema (sourcing the highs).
The 400sma (red line) shows the dominant trend is still upwards. Price has traded beneath this moving average for some time. It looks like a Head & Shoulders pattern is forming around this longer-term support level. A weekly close above the wave 4 pivot high can activate a thrust into the larger consolidated range.
2026 will prove to be an important year for cyclicals, in my estimation.
10 Stocks READY to EXPLODE!🔥 10 STOCKS READY TO EXPLODE! 🔥
NYSE:LMND , NYSE:FUBO , NASDAQ:GRAB , NYSE:PATH + 6 more primed setups. 🚀
Watch before they run 👇
Are you in any of these trades/ investments?

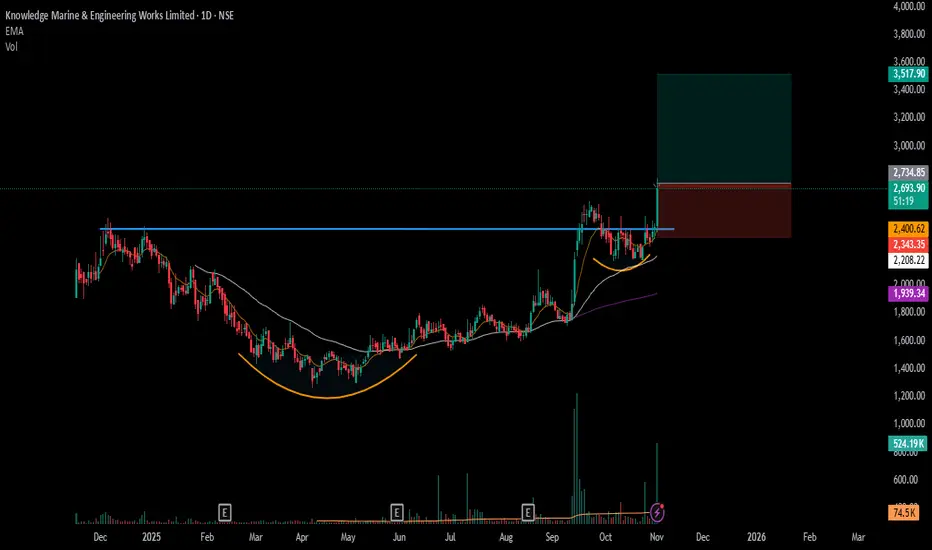
#KMEW - IPO Base Breakout in DTFScript: KMEW
Key highlights: 💡⚡
📈 IPO Base Breakout in DTF / C&H BO in DTF
📈 Short consolidation below Resistance
📈 One Fake Breakout seen during the base formation
📈 Volume spike seen during Breakout.
📈 MACD Bounce
⚠️ Important: Always Exit the trade before any Event.
⚠️ Important: Always maintain your Risk:Reward Ratio as 1:2, with this RR, you only need a 33% win rate to Breakeven.
✅Like and follow to never miss a new idea! ✅
Disclaimer: I am not SEBI Registered Advisor. My posts are purely for training and educational purposes.
Eat🍜 Sleep😴 TradingView📈 Repeat 🔁
ALLCARGO MAKING STRONG BASE FOR HUGE BREAKOUT SOONAllcargo Logistics operates as a global integrated logistics solutions provider, specializing in multimodal transport, container freight stations, contract logistics, and project cargo. It plays a pivotal role in global trade, with a presence in over 180 countries.
Yes, Allcargo Logistics is showing signs of short-term strength. The stock is currently trading around 33.30, slightly above key pivot and resistance levels , a VCP pattern is emerging and waiting for full confirmation ,
- 📈 Bullish trigger: Sustained close above 33.76 (100-day EMA) with volume
- 📉 Bearish risk: Breakdown below 31.20 could invite further downside
short to mid term it may show good upside as risk and reward ratio looking good at current levels .

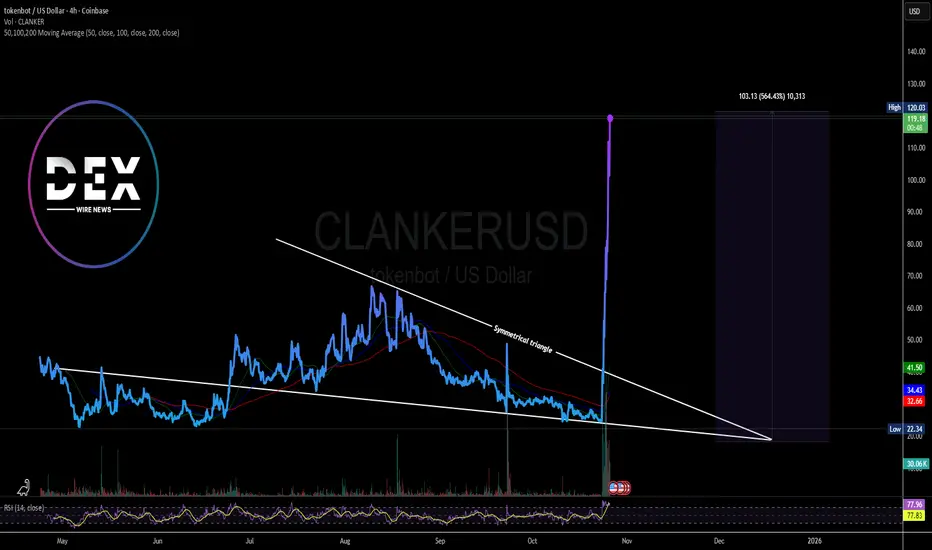
Tokenbot ($CLANKER) Broke Out of A Symmetrical Triangle The price Tokenbot ($CLANKER) a set of audited smart contracts that create token markets which reward token creators. spike 65% today breaking out of a bullish symmetrical triangle pattern gearing to reclaim the recent All time high of $193 a year ago.
While the RSI is 77, indicating the altcoin is trading in overbought region, bullish momentum seems to surpassed sellers. Only 1 million of this token was ever created with an all time low of $0.003875 as of November, 2024 and an All time high of $193.11 recorded in the same month of November, 2024 representing a whooping gain of +3019694.94% ROI.
All eyes are set on the $193 zone with stop losses set on the ceiling of the symmetrical triangle.
Nice and simple Breakout on high relative strengthFTDR is a pattern breakout .
Even with the S&P falling more sharply and the NASDAQ rallying, FTDR is able to breakout from a base today on good, rising volume. A breakout under these market conditions shows high relative strength.
The fundamentals also look good. EPS increased significantly by almost 50% in each of the last four quarters.
The homebuilding sector has been stronger in recent months, although the Fed's decisions this week may have a greater impact here.
True leader! I'll buy it.

CL educate trying to breakout of consolidation Watch CL educate breaking out of a base. Check the chart for levels. Please do your due diligence before trading. Chart shared is for educational purposes only.

MUNJALAU | SWING | LONGVolume Contraction
Creating Base near ATH
High Momentum
Needs a final basing to plan entries

BBTC | SWING | LONGVolume Contraction
Creating Base near ATH
High Momentum
Price reacted from Fair Value Gap


ITC | SWING | LONGPrice is showing high momentum.
Price is making base near ATH.
Volume activity is also really good.


JYOTHYLAB | SWING | LONGPrice showing momentum
Volume Dry-up
Creating a base near ATH
Caution:
Overall market conditions are highly volatile which can impact the trade idea

HUHTAMAKI | SWING | LONGPrice came out of stage 1, creating a nice base on daily TF.
Price is being followed by 20 EMA.
Volume activity is also stable.

SAKHTISUG | COMING OUT OF STAGE 1Price is contracting nicely near its swing highs.
Price is currently in Stage 1.
Some areas of liquidation are to be looked out for before initializing a position.

EBS Base Breakout SetupHey everybody got my camera working for this trade idea. Here we have the ebs stock setting up for a breakout in an uptrend and we're hoping for a bullish continuation here. I describe my entry points my stop loss and my profit target one and the logic behind them and how to position your share count so you can manage your risk and prepare to lose as much or as little money that you want if the trade goes against you every decision in this trade has meaning and logic to it that pertains to the particular stock and the setup therefore you know why you are doing everything that you're doing when trading. Let me know if you have any questions or if this is new to you or if you need help setting it up or calculating how much money you should win or lose. The only issue with this stock is that it's not in the technology sector and it's not in the communication sector so it is not in the most high performing sector right now although the healthcare sector is performing pretty decently with financials as well.

CHEF Stock Base Breakout 6/20/2024The Stock CHEF is in a tight range and creeping up nicely on the base. Volume increasing over the last 3 days. I have a buy to open order waiting at $39.85 and a $43
ENTRY = $39.85
STOP LOSS = $38.50
1ST PROFIT = $42.93

#Cyient long ideaStock have corrected as much as it wanted. Now after forming base it have given break-out of its base and falling trend line. Volume guttering is too good before giving break-out and breakout candle. It's only for education purpose. I will not be liable for your anyone lose.

JBL (Long) - an outperforming value-playFundamentals
The market is obviously overbought (still expecting a pullback), which could potentially give space to the stock to consolidate and form a cup-and-handle formation
Fundamentally, the company is sound - it has seen a decrease in demand, reflected in the decrease of revenue. However, efficiency gains meant that profit has gone up regardless, hence the price rise.
The earning are currently pricing another fall in revenue (yet, the price is still rising), hence a potential beat could serve as a nice boost to the share price.
Why am I interested in a firm with declining revenue? Because it has a lot of things going - the firm is expanding into various sectors (including healthcare, semiconductor equipment, and AI-driven data centers), which gives it a diversified customer base + it has signed a massive $2.2bn agreement with BYD , giving it an entry into the EV market
Cheap - P/E ratio of 23, despite the rise in price (based on Willliam O'Neill - the biggest winners of his careers had a starting P/E between 20-40)
Only problem is a pretty high level of debt
Technicals
The usual - accumulated base , currently on the verge of breaking the upper resistance
Another way to look at it is a broken bullish pennant
The most likely scenario I see is a consolidation along with the market and then breaking either close to the earnings or on earnings
The bottom indicator shows a recent outperformance compared to S&P500
Stochastics has been in the upper range for a while - again, showing that it will probably pull back for a little while
Trade
There are plenty way to go about it - I will likely choose to wait until the stock price consolidates around the resistance and wait for a breakout
If the breakout happens now, I would once again advise to enter the trade, but with the caveat of giving the trade more space for a potential pullback back to the support
Of course, if the stock starts receding from here, the trade is off; same goes for a failed break out
Main caveat is the earnings - if the stock disappoints, then once again, the trade wouldn't be advisable
Follow me for more analysis & Feel free to ask any questions you have, I am happy to help
If you like my content, Please leave a like, comment or a donation , it motivates me to keep producing ideas, thank you :)

IPO base break and base on base formationThe stock has been trading in a range since the last few months between 330-390 after breaking the IPO base
Company has issued a QIP at 341rs/share for 500cr and has a pending order book of 1000+cr and a new order worth 457cr and 16cr
a range break of 330-390 on the upside can take the stock up to 880 levels

SNOW (Long) - Beautiful Technicals, Don't look at FundamentalsFundamentals
Really not here to admire the pristine fundamentals - the stock is severely overpriced with a price-to-sales over 20
However, having been at this for a while, for a 6-month horizon, the technicals, price and the momentum are the things to focus on
Regardless, NYSE:SNOW is an outstanding company with a very bright future. However, its price might fluctuate wildly over the coming years until its sales catch up with the valuation
For now, the technicals are the key...
Technicals
The longer a firm has been forming a bottom, the more excited I tend to get about a breakout
The price of SNOW has been oscillating around for a while, forming a basing pattern (pick any of the three names on the screen) and accumulating share demand and momentum
If everything goes well, the price breaks out cleanly over the resistance (black line)
Looking at the stochastics, momentum is strong and volume has been on our side for the duration of the most recent up leg - shown by the Chaikin Money Flow indicator.
However, considering my slight doubts about the overall market, I would shorten the horizon on this trade to 2-3 months - to hedge the best in case the market calls the investors' "soft-landing" bluff
Trade
I see two potential way s of playing this trade: (i) enter where the price touched the red-coloured line, catching the pullback and frontrunning the breakout (if you have a strong conviction) or (ii) wait for the actual breakout - best-case scenario is a long, fat green candle which sustains the highs towards the close and does so on volume
Given the first choice, stop loss just below the red line or the 19-day EMA. With the second option, the black line is the obvious stop
Failed breakout would be an obvious no-no for me and I would abort the trade and wait how the price action develops
Also closely watch the NASDAQ:QQQ , Snowflake likes to follow it and I have some worries about the sustainability of the tech rally
Follow me for more analysis & Feel free to ask any questions you have, I am happy to help
If you like my content, Please leave a like, comment or a donation, it motivates me to keep producing ideas, thank you :)
