Next report date
—
Report period
—
EPS estimate
—
Revenue estimate
—
16.40INR
204.59 BINR
706.32 BINR
8.13 B
About ITC LTD
Sector
Industry
CEO
Sanjiv Puri
Website
Headquarters
Kolkata
Employees (FY)
55.25 K
Founded
1910
ISIN
INE154A01025
FIGI
BBG000BMYW46
ITC Ltd. is a holding company, which engages in the manufacture and trade of consumer products. It operates through the following segments: Fast Moving Consumer Goods (FMCG) Cigarettes; FMCG Others; Hotels; Paperboards, Paper and Packaging, and Agri Business. The FMCG Cigarettes segment markets and sells tobacco and cigars. The FMCG Others segment distributes packaged foods, clothes, school and office supplies, safety matched, agarbattis, and personal care products. The Hotels segment manages and operates hotel and restaurant chains. The Paperboards, Paper and Packaging segment produces and supplies specialty boards, graphic boards, and printing papers. The Agri Business segment exports feed ingredients, food grains, processed fruits, coffee, and seafood. The company was founded on August 24, 1910 and is headquartered in Kolkata, India.

ITC Long term Trading IdeaStock trade in symmetrical triangle pattern that is indecisive pattern we can expect both the direction after it can be bullish it can be bearish as per trade volume and delivery percentage but today, we can see a good volume on day chart with RSI 60 breakout and above 20sma volume. after a two-time

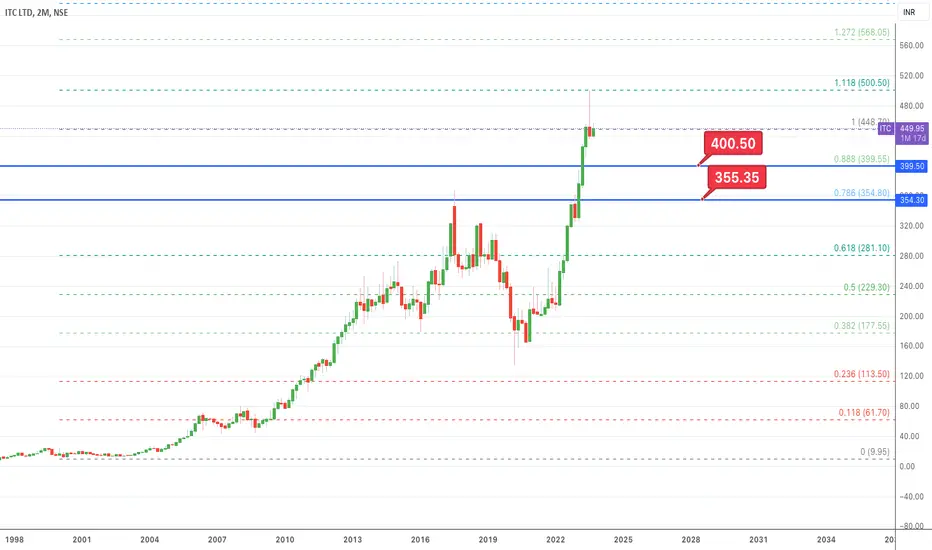
ITC: Long term viewLooks like ITC has done well so if one has to enter in this stock 400 or 355 will be a good place, so I think it has to correct more lets see what happens
Target 1: 400
Target 2: 355
ITC ready To Flyy...Buy ITC at 420 or above 440...
Target1 - 499
Target2 - 548
Target3 - 605
Disclaimer :-
I am not SEBI registered. The information provided here is for education purposes only.
I will not be responsible for any of your profit/loss with this channel suggestions.
Consult your financial advisor befo

ITCITC (monopoly in cigareete business) given confirmation of W pattern in weekly pattern. it can be a gud buy on this price range. sl will be 420
\
FIRST TARGET - 500
Risk reward ratio and probability is only the holy grail in the market.
Dont lose more than your entry reason.

ITC-SELLITC- HOURLY-- Hit our 1st 5th wave trg of 464-65.40 and now heading toward fibo support 1 and 2 ( 442-446 ) LONGS TRG 494, 540 as given earlier.

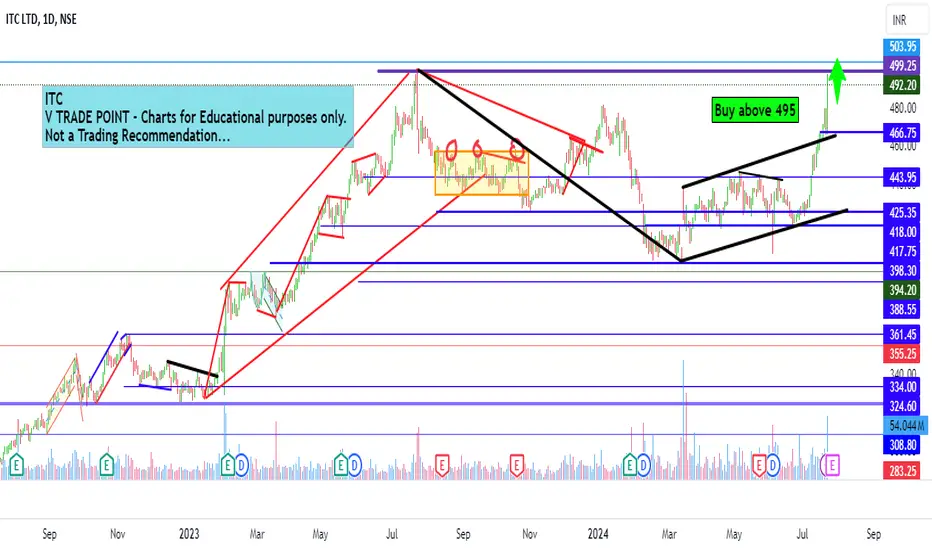
ITC Ltd Intraday level for 24th July #ITC ITC Ltd Intraday level for 24th July #ITC
Buying may witness above 495
Support area 490. Below ignoring buying momentum for intraday only
Charts for Educational purposes only.
Please follow strict stop loss and risk reward if you follow the level.
Thanks,
V Trade Point
ITC...Pattern Breakout....BuyFlag breakout...Tgt calculated and posted on chart...Time tgt calculated approximately..as per pattern...So buy..this is a good stock and you get good dividents too...

ITC Limited Intraday level for 18th July #ITC ITC Limited Intraday level for 18th July #ITC
Buying may witness above 467
Support area 462-460. Below ignoring selling momentum
Charts for Educational purposes only.
Please follow strict stop loss and risk reward if you follow the level.
Thanks,
V Trade Point

See all ideas
An aggregate view of professional's ratings.
Trade directly on the supercharts through our supported, fully-verified and user-reviewed brokers.


Curated watchlists where ITC is featured.


Frequently Asked Questions
The current price of ITC is 502.20 INR — it has increased by 2.50% in the past 24 hours. Watch ITC LTD stock price performance more closely on the chart.
Depending on the exchange, the stock ticker may vary. For instance, on NSE exchange ITC LTD stocks are traded under the ticker ITC.
ITC stock has risen by 6.62% compared to the previous week, the month change is a 18.72% rise, over the last year ITC LTD has showed a 5.86% increase.
We've gathered analysts' opinions on ITC LTD future price: according to them, ITC price has a max estimate of 585.00 INR and a min estimate of 400.00 INR. Watch ITC chart and read a more detailed ITC LTD stock forecast: see what analysts think of ITC LTD and suggest that you do with its stocks.
ITC stock is 3.90% volatile and has beta coefficient of 0.59. Track ITC LTD stock price on the chart and check out the list of the most volatile stocks — is ITC LTD there?
Today ITC LTD has the market capitalization of 6.12 T, it has increased by 4.72% over the last week.
Yes, you can track ITC LTD financials in yearly and quarterly reports right on TradingView.
ITC LTD is going to release the next earnings report on Jul 26, 2024. Keep track of upcoming events with our Earnings Calendar.
ITC earnings for the last quarter are 4.00 INR per share, whereas the estimation was 4.03 INR resulting in a −0.80% surprise. The estimated earnings for the next quarter are 4.04 INR per share. See more details about ITC LTD earnings.
ITC LTD revenue for the last quarter amounts to 165.79 B INR, despite the estimated figure of 171.21 B INR. In the next quarter, revenue is expected to reach 169.89 B INR.
ITC net income for the last quarter is 51.21 B INR, while the quarter before that showed 53.35 B INR of net income which accounts for −4.02% change. Track more ITC LTD financial stats to get the full picture.
ITC LTD dividend yield was 3.21% in 2023, and payout ratio reached 83.75%. The year before the numbers were 3.33% and 82.26% correspondingly. See high-dividend stocks and find more opportunities for your portfolio.
As of Jul 27, 2024, the company has 55.25 K employees. See our rating of the largest employees — is ITC LTD on this list?
EBITDA measures a company's operating performance, its growth signifies an improvement in the efficiency of a company. ITC LTD EBITDA is 262.54 B INR, and current EBITDA margin is 36.79%. See more stats in ITC LTD financial statements.
Like other stocks, ITC shares are traded on stock exchanges, e.g. Nasdaq, Nyse, Euronext, and the easiest way to buy them is through an online stock broker. To do this, you need to open an account and follow a broker's procedures, then start trading. You can trade ITC LTD stock right from TradingView charts — choose your broker and connect to your account.
Investing in stocks requires a comprehensive research: you should carefully study all the available data, e.g. company's financials, related news, and its technical analysis. So ITC LTD technincal analysis shows the strong buy rating today, and its 1 week rating is strong buy. Since market conditions are prone to changes, it's worth looking a bit further into the future — according to the 1 month rating ITC LTD stock shows the strong buy signal. See more of ITC LTD technicals for a more comprehensive analysis.
If you're still not sure, try looking for inspiration in our curated watchlists.
If you're still not sure, try looking for inspiration in our curated watchlists.