BAT/USDT — Descending Channel: Reversal or Bearish Continuation?On the 12-hour timeframe, BAT/USDT remains in a medium-term downtrend after failing to hold the supply area above 0.28. Price continues to move consistently within a descending channel, indicating that selling pressure is still dominant, although bearish momentum has started to slow down.
The current price structure shows lower highs and lower lows, confirming that the primary trend remains bearish until a valid breakout is confirmed.
---
Pattern Explanation
Price is forming a Descending Channel (Bearish Channel):
Upper line (red): dynamic resistance
Lower line (yellow): dynamic support
Channel midline: temporary reaction zone
This pattern reflects stable seller control, where buyers are only able to generate short-lived relief bounces without changing the overall trend structure.
The descending channel is technically considered a bearish continuation pattern, unless a strong breakout to the upside occurs.
---
Key Levels
Resistance:
0.2325 – 0.2430 → supply zone / horizontal resistance
0.2800 → major resistance & previous breakdown area
Support:
0.2000 → psychological support & current reaction area
0.1750 → lower channel support
0.1547 → previous low (major support)
---
Bullish Scenario
The bullish scenario is only valid if a confirmed breakout occurs:
1. Price breaks and closes above the upper channel
2. Break above 0.2325 – 0.2430 accompanied by increasing volume
3. Structure shifts into higher highs and higher lows
Bullish targets (step-by-step):
0.2600
0.2800
0.3040 (previous high)
Without a channel breakout, any upward move should be considered a pullback within a downtrend.
---
Bearish Scenario
The bearish scenario remains the primary scenario:
1. Price fails to break the upper channel
2. Rejection occurs around the 0.2200 – 0.2300 area
3. Breakdown below 0.2000 support
Bearish continuation targets:
0.1750
0.1547 (major support / potential capitulation zone)
As long as price stays inside the channel, the probability of forming a new lower low remains high.
---
Conclusion
BAT/USDT is still trading within a valid descending channel, indicating that the bearish trend is not yet over. Buyers need a clear structural breakout to reverse the trend. As long as price is capped below channel resistance, downside risk remains dominant.
Recommended approach:
Wait for a breakout + retest for safer long entries
Or look for rejection at resistance to trade in line with the trend
#BATUSDT #BAT #CryptoAnalysis #TechnicalAnalysis #DescendingChannel #BearishTrend #Altcoin #PriceAction #Downtrend
Batusdttrend

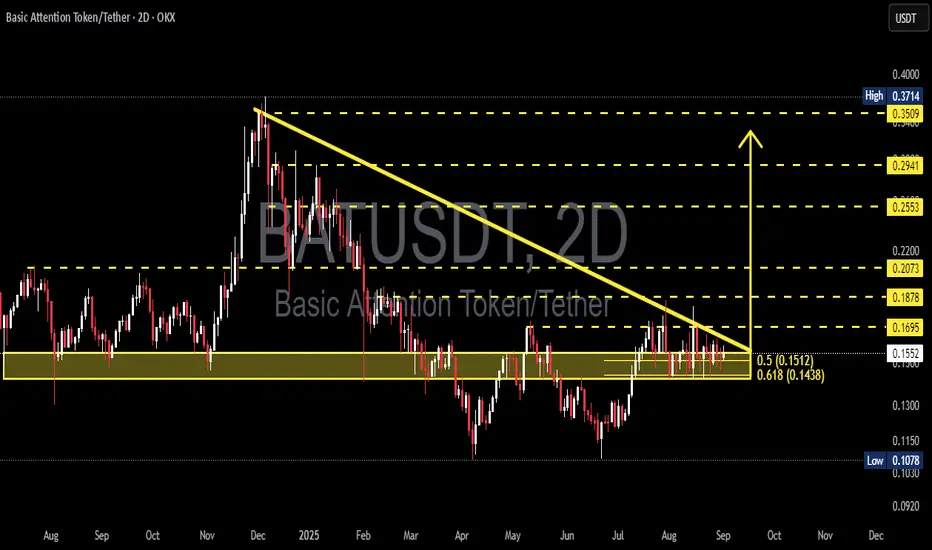
BAT/USDT — Critical Zone: Breakout or Breakdown Ahead?Summary:
BAT is currently consolidating at a critical support zone after a prolonged downtrend. Price action is being squeezed between a descending trendline from late 2024 highs and a strong horizontal support area at 0.1438–0.1512 (Fibonacci 0.618 & 0.5). This structure has formed a descending triangle / falling wedge on the 2D timeframe. The market is waiting for a decisive move: will bulls manage a breakout reversal, or will bears push for a breakdown continuation?
---
🔎 Chart Breakdown
1. Strong Support Zone
0.1512 (Fib 0.5) and 0.1438 (Fib 0.618) have repeatedly acted as a demand area.
Price is consolidating inside this yellow box region.
2. Descending Trendline
Connecting lower highs since December 2024.
Price is now at the apex, nearing a decisive breakout or breakdown.
3. Key Resistances to the Upside
0.1695 → 0.1878 → 0.2073 → 0.2553 → 0.2941 → 0.3509 (with 0.3714 high as the major resistance).
4. Supports Below
First target at 0.115.
Deeper support at 0.1078 (previous structural low).
---
📈 Bullish Scenario
Trigger:
A confirmed 2D candle close above the descending trendline and 0.1695, supported by strong breakout volume.
Validation:
Retest of the broken trendline as new support.
Targets:
TP1: 0.1878
TP2: 0.2073
TP3: 0.2553
Extended: 0.2941 → 0.3509
Stop-loss:
Conservative: below 0.1435.
Aggressive: below 0.151.
Bullish Conclusion:
If price breaks upward, this pattern may act as a falling wedge reversal, opening room for a significant rally after a long accumulation.
---
📉 Bearish Scenario
Trigger:
A 2D candle close below 0.1438, ideally with high selling volume.
Validation:
Failed retest of the support area, confirming it as resistance.
Targets:
TP1: 0.115
TP2: 0.1078 (previous macro low).
Stop-loss:
Above the descending trendline or between 0.155–0.17, depending on entry.
Bearish Conclusion:
If support breaks, the descending triangle will confirm as a bearish continuation pattern, exposing lower liquidity zones and potentially retesting macro lows.
---
📌 Pattern Insight
Descending Triangle: typically a bearish continuation signal.
Falling Wedge: often a bullish reversal pattern.
Current structure could validate either direction → confirmation is key.
---
📝 Trading Strategy & Risk Management
Risk per trade: 1–2% of capital maximum.
Watch for false breakouts (long wicks without strong volume).
Always check BTC market trend, as altcoins usually follow Bitcoin’s direction.
Confirmation tools: RSI above 50 & bullish MACD cross for upside, or opposite for downside.
---
📢 Final Notes
BAT is at a make-or-break level. The next 2D candle close, combined with volume confirmation, will likely decide the next major move. Traders should remain patient and avoid premature entries until the direction is clear.
#BAT #BATUSDT #Crypto #TechnicalAnalysis #Breakout #Bearish #Bullish #Altcoins #PriceAction
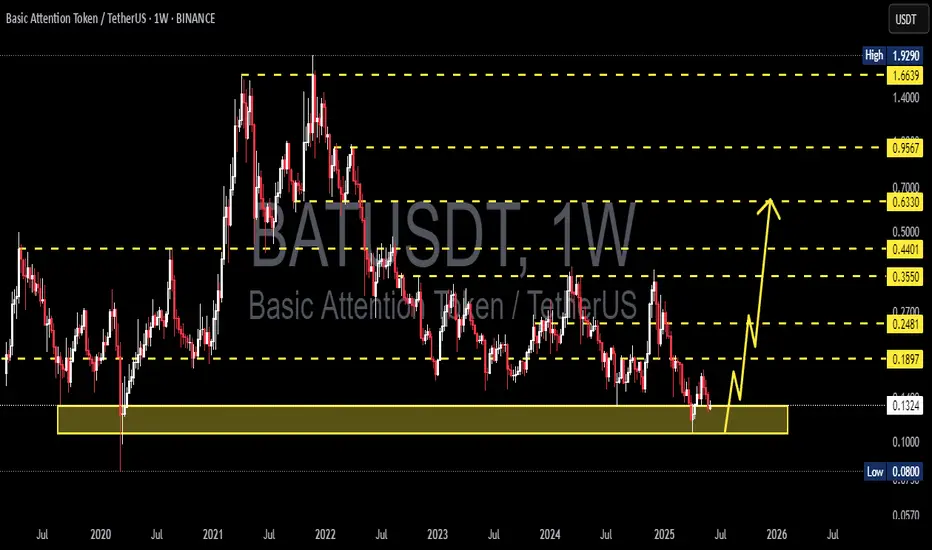
BAT/USDT Golden Zone: Massive Rebound Potential from Historical 🔶 1. Strong Support Zone (Highlighted in Yellow):
A key demand zone lies between $0.080 – $0.1212.
This area has acted as strong support multiple times since 2020, showing signs of institutional accumulation or whale interest.
🔼 2. Bullish Reversal Scenario:
A recent bounce from this golden support zone suggests a potential bullish reversal.
The projected path (yellow arrows) illustrates a step-by-step rally toward multiple resistance levels.
Potential Upside Targets:
🔹 $0.1648 (Initial minor resistance)
🔹 $0.2098 (Previous consolidation zone)
🔹 $0.3551 (2023 distribution zone)
🔹 $0.4368 (Major pre-breakdown resistance)
🔹 $0.6275 (Medium-term bullish target)
🔹 $0.9412 – $1.6487 (Long-term resistance levels)
📉 3. Risk Management & Invalidations:
A weekly close below $0.1212 may trigger a move toward the $0.090 – $0.080 historical low zone.
A breakdown below that would invalidate the bullish outlook and call for a reassessment.
📆 4. Timeframe & Additional Signals:
This is a weekly timeframe chart, ideal for swing or long-term traders.
While volume confirmation is not yet strong, the early formation of a higher-low suggests a possible trend reversal.
✅ Conclusion:
BAT/USDT is currently trading in a high-probability reversal zone with strong historical support. If this zone holds, it could trigger a significant multi-level bullish rally. A good opportunity for patient traders with proper risk management.

BATUSDT 1W AnalysisBAT ~ 1W Analysis
#BAT This trade is very high risk
This is the lowest support block for now. Buy with a short term target of at least 20%+ from here.
BATUSDT 1D AnalysisBAT ~ 1D Analysis
#BAT Buy when re -testing this support block with a short -term target of at least 10%+ from here.

BATUSDT 1WBAT ~ 1W Analysis
#BAT Buy gradually from here with a short -term target of at least 20%+. This is the lowest support block for now.

BATUSDT 1WBAT ~ 1W
#BAT If you still have a Conviction on this Coin, buy gradually from here with a minimum target of 20%+

BATUSDT 1WBAT Update ~ 1W
#BAT So far it still maintains its bullish structure. Buy gradually within this support block,. minimum target 20%+

BATUSDTBAT ~ 1W
#BAT If you have Conviction on this Coin,. It's time to start buying again. This is the best price to start accumulating as much.

BATUSDTBAT ~ 1W
#BAT If you have Conviction on this Coin,. It's time to start buying again. This is the best price to start accumulating as much.

🟢 BATUSDT - 1D (29.09.2022)🟢 BATUSDT
TF: 1D
Side: Long
Pattern: Bull Flag
SL: $0.27277
TP 1: $0.33069
TP 2: $0.35915
TP 3: $0.38215
BAT is getting stronger and on the verge of breaking out. It is a good buy and is going to be a strong crypto in the future with a lot of adoption.
RSI and MACD are getting ready to pop on 3D TF.

BATUSDT Buy Setup!BATUSDT Technical Analysis Update
BATUSDT Currently trading at $0.359
Buy zone : Above $0.355
Stop loss : $0.340
Target 1 : $0.378
Target 2 : $0.405
Target 3 : $0.44
Always keep stop loss
Thanks
Hexa

$BATUSDT 1D TECHNICAL ANALYSISAfter getting rejected at the resistance at around 0.48, Basic Attention Token ($BAT) has been having some downward movement even before the general market correction happened.
This looks to me like a possible breakout of a bear flag. I might take a short position here if confirmed.
We saw a fake out from previous data. So we must be careful.
Let's wait for confirmation.
I'll post more updates.

Short on BATUSD (Leverage Trade)With the current crypto sell-off that we are going through and the overall crypto meltdown,with our team we have prepared another short trading idea which looks at capitalizing on the overall market trend:
🔹 Leverage 10x
🔹 Entry price: 0.30-0.31 (current price)
1) Target 🎯 : 0.295
2) Target 🎯 : 0.29
3) Target 🎯 : 0.27
⛔️ STOP: 0.331

[ALTCOIN] BATUSDT TREND LINE ANALYSIS/a strong trend lineHello, everyone
We're a team that specializes in chart analysis
We will always analyze and provide you with charts to help you sell
There are so many trading laws and there are so many good technologies that come with them, but I'm confident that the trend line is really strong.
If you read the point of view and get to know the line, every line will adjust
Thank you.
------------------------------------------------------------------------------------------------
Chart Analysis Content -
Currently, there is a rebound in the horizon support section and it is rising along the upward trend, but it is showing a precarious appearance by failing to retest and posting again and repeating the retest.
Even if it goes up, it is expected to face resistance from the downward trend of thick red one to two times.
If it breaks through the downward trend of thick red, it can settle stably above the upward trend of thick blue.

Bst first target hitbat looking great since my chart when i called the bottom
hit my first target and taken some profit but we could keep going to next target

BATUSDTBATUSDT forming a M pattern
A good down move can be seen in this crypto
Enter after breakout or re-test.
Trade safe. Manage risk. Be profitable.
Please follow us for more simple trading analysis and setups. Also let me know in the comment in case you have any queries.
Disclaimer :- This is just my view. Please analyze charts yourself and then decide to take any trades.

BAT/USDT 1 HOURS UPDATE Welcome to this quick Update, everyone.
If you are reading my updates for the first time do follow me to get more complex charts in a very simplified way.
I also post altcoin setups on Spot, Margin, and Futures.
I have tried my best to bring the best possible outcome in this chart.
BAT/USDT breaks this DESCENDING CHANNEL pattern and now retests it.
Entry: CMP and more upside the 21 MA
Targets: 20%
Stop Loss: $0.79
What's your thought on this?
Do hit the like button if you like this update and share your views in the comment section.
Thank you
#PEACE

BAT/USDT 4 HOURS UPDATE Welcome to this quick Update, everyone.
If you are reading my updates for the first time do follow me to get more complex charts in a very simplified way.
I also post altcoin setups on Spot, Margin, and Futures.
I have tried my best to bring the best possible outcome in this chart.
BAT/USDT breaks out an ascending triangle pattern and already retested it on the support of 200 MA.
Entry: CMP
Targets 20% TO 30%
Stop Loss: $15.52
What's your thought on this?
Do hit the like button if you like this update and share your views in the comment section.
Thank you
#PEACE

BATUSDT Trade Setup!BATUSDT (4h Chart) Technical analysis
BATUSDT (4h Chart) Currently trading at $1.219
Buy level :Above $1.228
Stop loss: Below $1.037
TP1: $1.339
TP2: $1.418
TP3: $1.578
TP4: $1.720
Max Leverage 3x
Always keep Stop loss
Follow Our Tradingview Account for More Technical Analysis Updates, | Like, Share and Comment Your thoughts.

BATUSDT , It can move up . . . Hello guys
We analysed one of the most powerful project that is working on crypto BAT
According you can see on chart after rally we have , we are in correction wave until the first support and it is so important for the price to support in here and we expect after supporting in here it can go up until the trendline resistance
If it cant support in here and it wanna fall down the second support is the other main support that the price should support in there
Until the price is not fall down below the key point level the trend is upward and we are going up and reach to the new ATH
Dont forget use stop loss and attention to money management
Good Luck
Abtin

BATUSDT 4H: Possible LONGBATUSDT 4H: Possible LONG
Rebounding from the 0.75 level and a possible rise to 1.0000

Bull pennant breaked outHello BATA holders
After a correction we finally break out up , next top 1.72$
Details in the chart
-Goodluck
