$SPY BB OptimizationUsing @KioseffTrading BB Optimizer on SPY, really loving the data I am seeing on this. SPY is seeming to have a hard time currently at $410 and the BB optimizer has an exceptionally well win rate %, will be eyeing this down for an entry in the near future using this optimization tool!
BB

HOW TO SWING TRADE USING BB - MACD!Today im going to show you how to use Bolinger Bands and MACD together to understand where the price is going.
So you can swing trade easily.
By the way swing trade is holding assets for profit for more than a day.
So this strategy is suitable for novice investors. But you will need practice before applying this to your trading strategy!
First of all i do not recommend betting against the market.
Do follow the trend when using this strategy. If the trend is upwards do not short the asset.
But there can be breakout from the existing trend.
Therefore we can also use trendlines to have better understanding of the market.
Lets identify indicators that we are going to use then i will explain how to use them to swing trade.
MACD measure specific EMAs and their relations. EMAs are mainly 12 period EMA and 26 period EMA.
There are 2 lines and 1 histogram on MACD. They are called, MACD line, Signal line, Histogram.
MACD line = 12 EMA - 26 EMA
Signal line = 9 EMA of MACD line
Histogram = Difference between MACD line and Signal line
We use MACD to identify trends so we can trade accordingly.
If the MACD line is above 0, we are in a uptrend.
If the MACD line is below 0, we are in a downtrend.
If the MACD line is above or crosses above signal line it is a buy signal.
If the MACD line is below or crosses below signal line it is a sell signal.
Longer histograms and being too far away from zero line means momentum of the trend is high.
These are the basic of MACD.
Bolinger Band is easier to grasp than MACD.
There is an upper channel and lower channel calculated with volatility and 2 Standard Deviations from 20 Simple of MA line.
Generally if the price is closer to the upper band, market is considered overbought and vice versa.
If the market is highly volatile bands widen and if volatility is low bands contract.
The most important thing about BB is 20MA. Generally price will test 20MA line after it hits the upper or lower band.
If price breakout or rejceted from it, trend is established.
So how can we combine both of them to swing trade successfully?
1- We have to identify the market trend. We can simply draw a trendline on the chart to identify it.
2- Use 20 MA as entry-exit
3- Look MACD histogram for momentum
4- Use lower - higher band as SL-TP
Example;
Look at the chart on the left!
Feb 04 19, uptrend started and MACD signal buy.
But there is no momentum.
MACD far away from zero line and price far away from 20MA.
Wait until price breakout from 20MA.
1- is the confirmation of trend with momentum rising and price breakout above 20MA line. BB start to widen meaning high volatility.
You can enter long trade here since price and momentum rising with volatility.
2- is the upper band of BB. This is take profit levels.
If you are seasoned enough you can open short position here with 20MA area TP.
3- Test of 20MA. You can enter short or long here with lower BB being SL - TP.
But with MACD signaling sell and losing positive momentum in histogram, short seems to be the RIGHT CHOICE .
4-Price cant hold 20MA. Drop to the lower band. SL-TP zone.
If you are seasoned enough, potential entry zone for long trade. TP being with 20 MA zone.
Lets take a look at the chart on the right.
Same chart, after a couple of weeks from chart 1.
There is a clear uptrend that started 09 March 20.
1- At 20 April MACD signal buy but there is no momentum and price was still below MA20.
It is logical to wait for confirmation which is the breakout of MA20.
2-Price breakout MA20 after a week.
Between 27 April - 05 Oct, there are more than couple times that market offers good entry zones.
Between this time, MACD momentum and lines are rising to the positive-buy zone.
3- Price is around upper band for a long time. Could be a TP zone.
Price also lost %25 value 2 in weeks. Some people use here as TP zone.
But MACD lines and histogram were positive.
Price didnt test the 20MA.
Also BB is still widening. Meaning high volatility in a bull market.
Opening short is not logical here.
4- Last time price touched the upper band.
Histogram started to lose momentum.
Potential TP zone and short entry.
To be honest this seems to be a good point for short trade but didnt work out.
Price went up (2. ATH) couple of weeks later with MACD momentum nearly finished.
Therefore always put SL-TP with your orders.
5- MACD signaling sell.
Low negative momentum.
If open short here, it could be like NO.3 on the chart.
Wait for confirmation.
6- Price test MA20.
After couple of weeks we broke down MA20. Bear confirmed.
Momentum rapidly increase to the negative zone.
Potential short entry.
7-Price cant hold MA20.
Lower BB reached.
Possible SL-TP area.
So sign from MACD to enter a long trade just yet.
8- Possible long entry with MA20 breakout above.
MACD signal buy with low momentum. Therefore wait for confirmation is logical.
After a week momentum rises.
Long entry seems logical.
New ATH for BTC.
So in short,
Identify a trend!
Check MACD for momentum and trend strength.
Enter when price breakout MA20.
Confirm the breakout before enter!
TP-SL at the MA20 and Band limits.

SAND Short SetupSAND Short Setup
Sell Momentum
Please noted this setup is HIGH RISK because its already hit fibo 1,68 (Take profit of sell momentum area)
Entry:
Sell market high risk
Sell limit 4.2082 - 4.3809
Target:
TP1 4.0355
TP2 3.7561
TP3 3.3040
Stoploss:
You decide
Always do your own research!

$BB - Blackberry - investment idea 💡 ⚠️ - This idea is based on my technical analysis only. Do your research and trade on your own risk!

BlackBerry Falling? BlackBerry - Short Term - We look to Sell a break of 8.38 (stop at 8.97)
Previous support located at 8.50. The primary trend remains bearish. The trend of lower highs is located at 9.50. A break of bespoke support at 8.50, and the move lower is already underway.
Our profit targets will be 6.53 and 5.80
Resistance: 9.50 / 10.00 / 12.00
Support: 8.50 / 8.00 / 6.50
Disclaimer – Saxo Bank Group. Please be reminded – you alone are responsible for your trading – both gains and losses. There is a very high degree of risk involved in trading. The technical analysis, like any and all indicators, strategies, columns, articles and other features accessible on/though this site (including those from Signal Centre) are for informational purposes only and should not be construed as investment advice by you. Such technical analysis are believed to be obtained from sources believed to be reliable, but not warrant their respective completeness or accuracy, or warrant any results from the use of the information. Your use of the technical analysis, as would also your use of any and all mentioned indicators, strategies, columns, articles and all other features, is entirely at your own risk and it is your sole responsibility to evaluate the accuracy, completeness and usefulness (including suitability) of the information. You should assess the risk of any trade with your financial adviser and make your own independent decision(s) regarding any tradable products which may be the subject matter of the technical analysis or any of the said indicators, strategies, columns, articles and all other features.
Please also be reminded that if despite the above, any of the said technical analysis (or any of the said indicators, strategies, columns, articles and other features accessible on/through this site) is found to be advisory or a recommendation; and not merely informational in nature, the same is in any event provided with the intention of being for general circulation and availability only. As such it is not intended to and does not form part of any offer or recommendation directed at you specifically, or have any regard to the investment objectives, financial situation or needs of yourself or any other specific person. Before committing to a trade or investment therefore, please seek advice from a financial or other professional adviser regarding the suitability of the product for you and (where available) read the relevant product offer/description documents, including the risk disclosures. If you do not wish to seek such financial advice, please still exercise your mind and consider carefully whether the product is suitable for you because you alone remain responsible for your trading – both gains and losses.

Closing the Week (1/14) Above The Trend Line with MA's Curled UpTrade at your own risk.
My analysis is bullish. We've got a green week candle about to close above the trend line, the 100 & 200 day moving averages on the week chart about to cross, the Mac D & Stoch RSI on the week looking decent to pump, moving averages strongly curling & trapping on the month, similarly on the 3 month. My target would be 200 day moving average on the day chart (as it hit during last years run) or slightly lower due to the MA coming down sharply on the 3 month, right around $14.50.

Do you feel it?are we seeing a moment of cool down on IWM? if we are this is how i think this thesis could play out like my drawings but if you agree please drop a like!
cheers

BB Canadian Chart Geo MathsLets see if this GEO chart can get up to that price target on the top of the cypher.

BB Idea for the BullsBB has formed a familiar structure (in yellow) under this channel that can be drawn
A break out of this will send the bulls on a rally like the initial one
Lets see what happens, a long with no leverage would be the play on this weekly chart

DWAC Epic Market On Close VolatilityInto the final minutes, $DWAC was trading at $39 a share at about 3:58pm. It then flushed to $36.69 by 3:59 only to reverse and close at $42.29 by 4pm. It hit a high of $59.39 before closing at $55.40 after hours. This is off of news that they have reached a fundraising target. With Jack gone and the recent distribution in names like $TWTR and $FB, is this a rotation into a competitor? Or is it a rotation from meme stocks such as $GME, $AMC, $CLOV, $BB, and $BBBY that have recently rolled over? Either way, this is nothing short of epic volatility.
D


BB | SHORTNYSE:BB
Possible Scenario: SHORT
TP1: 10.5$$
TP2 : 10.10$
Evidence: Price action,
PUT options, Strike 9$, 29 October.
*This is my idea and could be wrong 100%


BB | InformativeBB
I expect it 10.50$ area as strong support, and then bounce up, above 11.75$ it's bullish.
*This is my idea and could be wrong 100%

BBBlackberry (NYSE:BB) pulled back before the weekend, getting rejected by the $12 area and falling to about 10.9 on Friday. I think this pullback is a great opportunity to enter. I'm playing it for another BIG pop.

BB looking good here - wedge likely to pop back to ATHBB following a similar pattern as before with a long term wedge. No more room left for shorters and short squeeze is imminent. Whatchu think? Funny what seems obvious when you just zoom out far enough!

$BB - We have a breakout. Will resistance become support now? We'll see. I am holding already, was buying in the low 10's and high 9's. thought about taking profits today, but going to see what happens in the morning.

AMC's 3rd Squeeze PredictionAMC has been prepping for it's next squeeze for almost 5 months now. Short Interests is at all time highs meaning shorts have not covered and the technicals show bullish momentum starting to build up once again.
Some indicators that suggest the next squeeze is starting.. low volatility, low volume (increasing now), high short interest, pennant close to breaking out, and previous trend analysis.
My price target is taken from AMC's Speed Trendline & Fib Retracement levels which suggest the next squeeze will peak end of November at around the $150 area
Low/High Weekly Price Targets:
October 22 - $38/$48
October 29 - $42/$62
November 5 - $52/$80
November 12 - $73/$88
November 19 - $87/$104
November 26 - $96/$150

Retest of 200 day Moving Average inbound!NYSE:BB “Reversion to the mean is the iron rule of the financial markets." ~John C. Bogle
Recent Upgrades by Analysts + Positive earnings = upward price action

Long | BBNYSE:BB
It looks bullish
TP1: 10.20
TP2: 11
TP3: 12
Call options 01/21/2022 Strike 10$
Timeframe 2 weeks
*This is my idea and could be wrong 100%

BBBlackberry (NYSE:BB) The stock pulled back on Friday after they reported recent results last week and provides an opportunity to invest at a better valuation. It should resume the upside move next week for a possible run to test the recent highs at 12

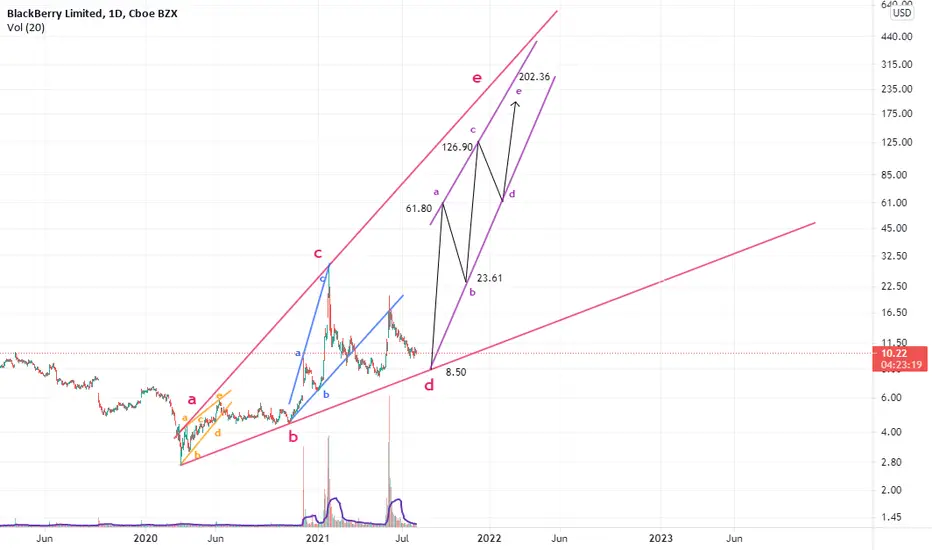
?Flag formation on BlackBerry. BBIt looks like one from Bird's eye view. If this is true may be climbing even further up. This is assuming that we are finishing up Wave 4 of main impulse. Time will tell.
Fibonacci goals are in green, reversal or invalidation is in red. This post is not financial advice, make your own financial advice or pay a certified professional ( you are to statistically faire better at blindly longing SnP500 incase of the latter). Playing on the market whether you are an investor or a trader is risky. No good thing is ever without. Good luck out there.
